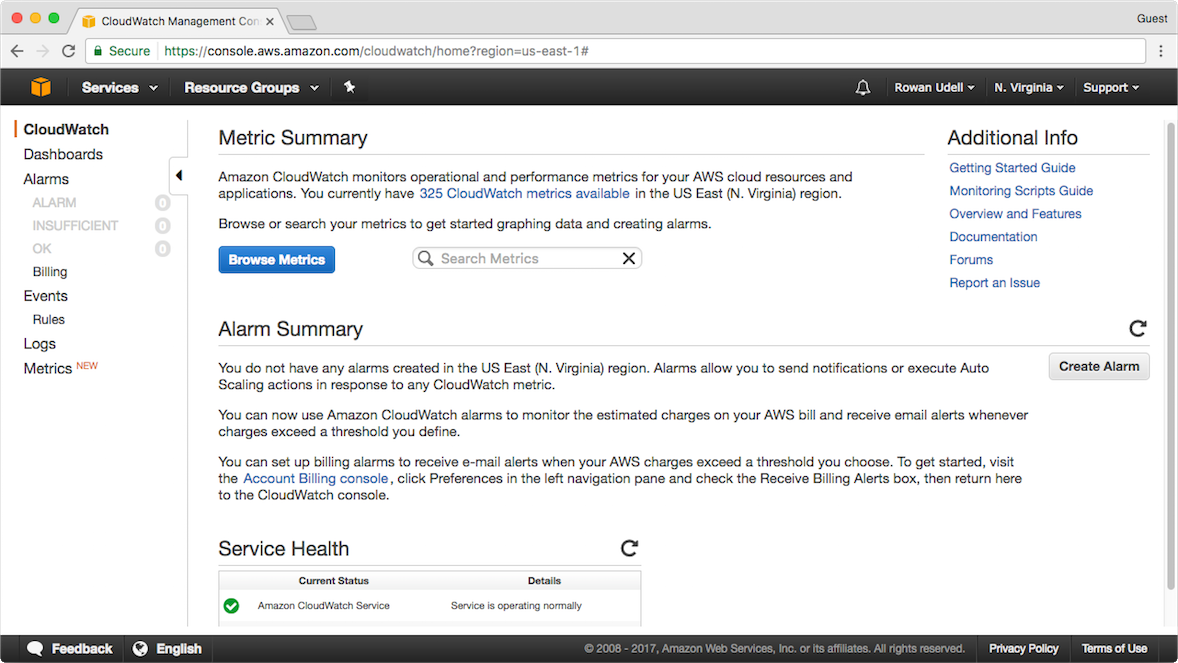
- Navigate to the CloudWatch section of the AWS console:
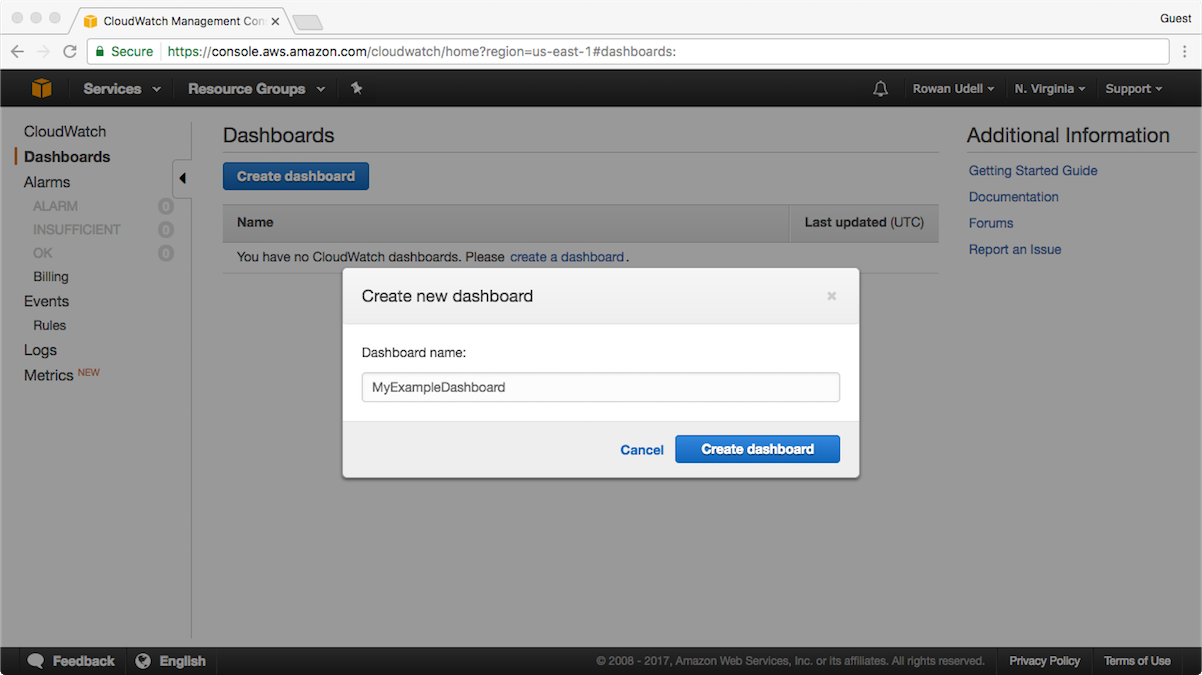
- Go to the Dashboards section of the console via the link on the left-hand menu:

- Click the Create Dashboard button:
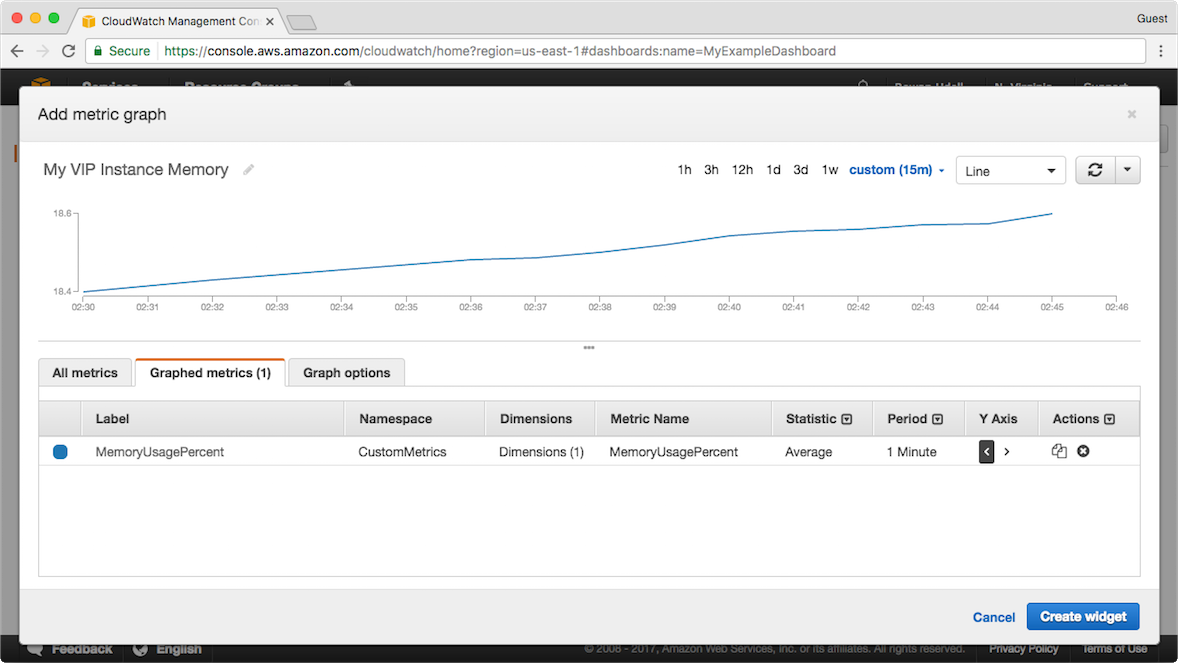
- Choose the type of widget you want to use to display your metric. In this example, we will choose the most versatile, Line:

- Navigate the All metrics tab to find the metric(s) you want to include, selecting it by clicking the tick box on the left of the metric details. You will see a preview of the metric(s) and how they will look:

- Once selected, you can modify how the metric is displayed via the settings on the Graphed metrics tab. In this case we have given the widget a name, and changed the Period setting for our metric to 1 Minute to reflect the additional granularity available (You can see that the metric line appears smoother because of it).
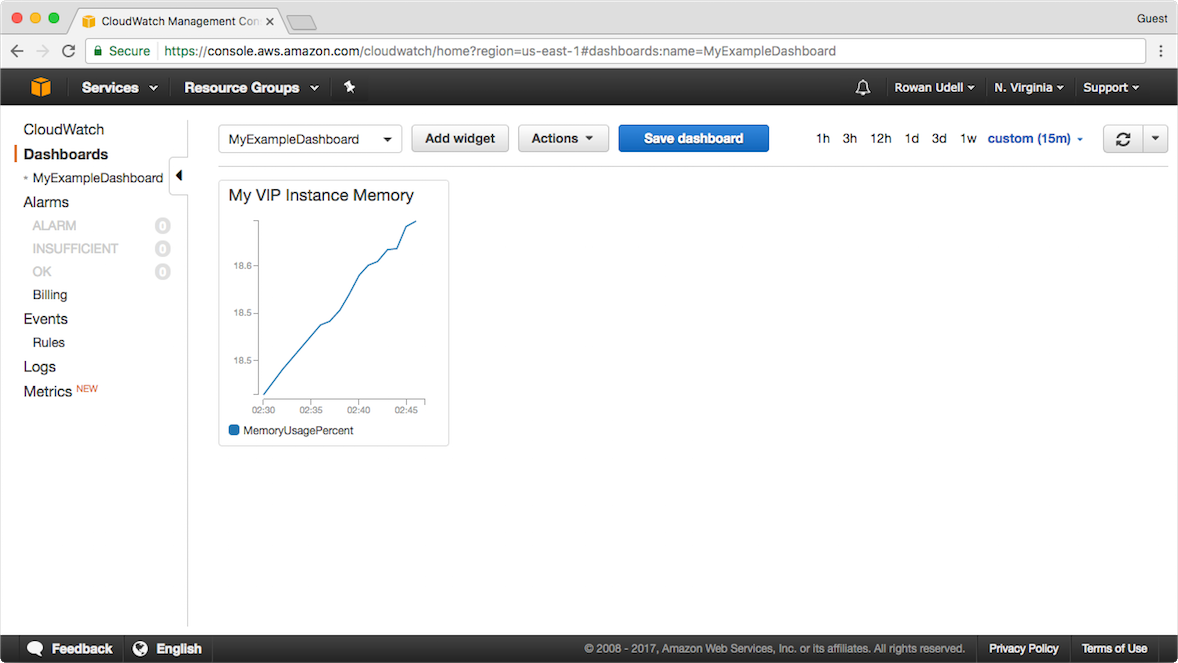
- Once you click Create widget, you will see your widget on the dashboard. Once you click Save dashboard, it will appear under the Dashboards heading on the left-hand menu:
- At a dashboard level, you can turn on Auto refresh and the refresh frequency interval:

- You can resize and rearrange your widgets by dragging them. Just remember to click Save dashboard to persist any changes:
