There are several ways to create a Sankey chart published on various blogs. Ian Balwin's post on Information Lab is excellent because it is flexible and does not require outside data prep. However, there are many calculations, which can make it hard to follow. But once it's set, there is a great deal of flexibility because of how the dimensions and measures have been created. The following directions are taken from his blog post at https://www.theinformationlab.co.uk/2018/03/09/build-sankey-diagram-tableau-without-data-prep-beforehand/.
Use Beer.twbx, beers.csv, and breweries.csv to work through this example:
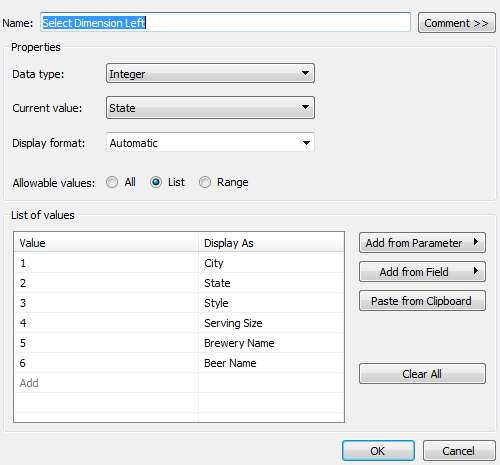
- Create the Select Dimension Left parameter or use the same one from the previous recipe:
- Create the Select Dimension Right parameter or use the same one from the previous recipe:

- Create the Dimension Left parameter or use the same one from the previous recipe:

- Create the Dimension Right parameter or use the same one from the previous recipe:

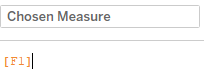
- Create the Chosen Measure parameter or use the same one from the previous recipe:
- Create the Top Dimension Values parameter or use the same one from the previous recipe:

- Add Dimension Right and Dimension Left to the Filters shelf.
- Right-click Dimension Right and Dimension Left in the Filters shelf, select Edit Filter, and set it as follows:

- Create the Path Frame parameter:

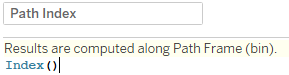
- Create a Path Index parameter:
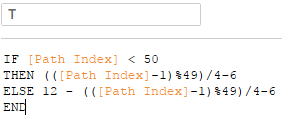
- Create the T parameter:
- Create the Sigmoid function:

- Create the Sankey Arm Size parameter:

- Create all the following calculations for the top of the Sankey Arm:
- Max Position Left
- RUNNING_SUM([Sankey Arm Size])
- Max Position Left Wrap
- WINDOW_SUM([Max Position Left])
- Max Position Right
- RUNNING_SUM([Sankey Arm Size])
- Max Position Right Wrap
- WINDOW_SUM([Max Position Right])
- Max Position Left
- Create all of the following calculations for the bottom of the Sankey Arm:
- Max for Min Position Left
- RUNNING_SUM([Sankey Arm Size])
- Min Position Left
- RUNNING_SUM([Max for Min Position Left])-[Sankey Arm Size]
- Min Position Left Wrap
- WINDOW_SUM([Min Position Left])
- Max for Min Position Right
- RUNNING_SUM([Sankey Arm Size])
- Min Position Right
- RUNNING_SUM([Max for Min Position Right])-[Sankey Arm Size]
- Min Position Right Wrap
- WINDOW_SUM([Min Position 2]
- Max for Min Position Left
- Create the Sankey Polygons calculation as follows:

- Create the Left Side sheet:

- Apply a Percent of Total option in Table Calculation to Chosen Measure:
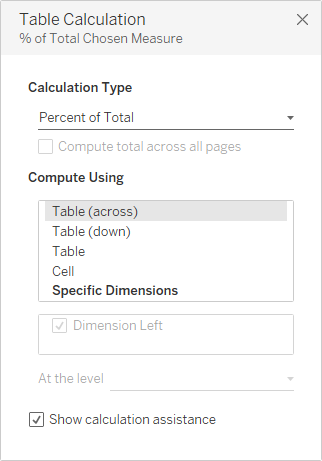
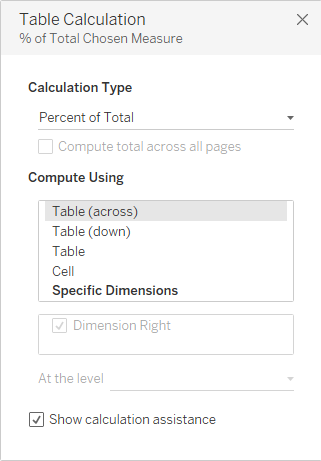
- Create the Right Side sheet:

- Apply a Percent of Total option under Table Calculation to Chosen Measure:
- Create INDEX() by double-clicking in the Marks card and typing INDEX():

- Apply INDEX() to the Color card:
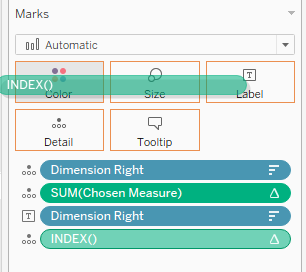
- Apply a table calculation to INDEX(), as shown in the following screenshot:

- Create the Sankey sheet:

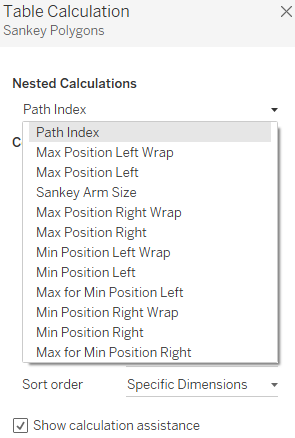
- Table Calculation for Sankey Polygons:
- These are all the table calculations we will need to configure for the Sankey Polygons:
-
- Path Index:

-
- Max Position Left Wrap:

-
- Max Position Left:
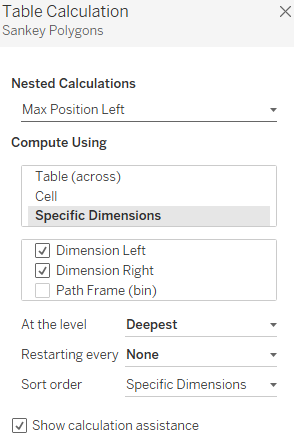
-
- Sankey Arm Size:
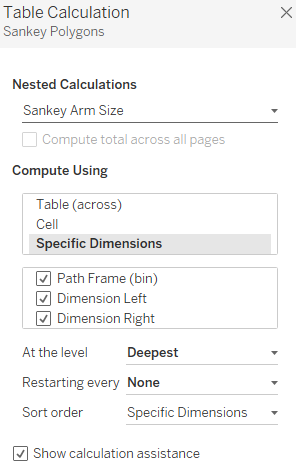
-
- Max Position Right Wrap:

-
- Max Position Right:

-
- Min Position Left Wrap:

-
- Min Position Left:
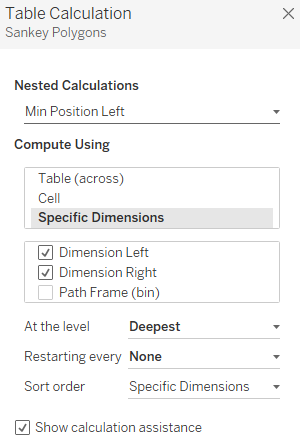
-
- Max for Min Position Left:
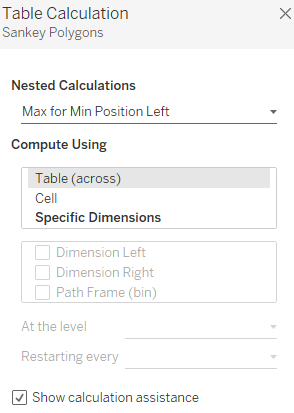
-
- Min Position Right Wrap:

-
- Min Position Right:

-
- Max for Min Position Right:

You will see the final dashboard in the following screenshot:
