Demanding visualizations can also create some trouble and slow down your workbook. If you encounter performance issues, or simply want to make sure your workbook is going to run smoothly, pay attention to the following:
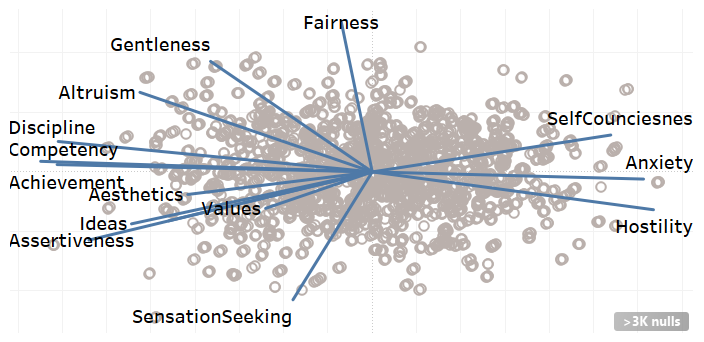
- A visualization that shows many data points, such as the one shown in the following screenshot, can slow down performance of the workbook:
The number of marks in the view is visible in the very bottom-left corner of the workbook, as shown in the following screenshot:

A large number of marks can make rendering the view a very demanding task for Tableau to process. So, make sure the number of marks in your view isn't excessive.
- Advanced visualizations aren't the only ones that give Tableau a hard time. Simple cross-tabs, especially with a higher number of rows and columns can also be very computationally demanding. Try to limit the number of rows and columns used in a single visualization—a table with too many rows and columns isn't easy to read anyway.