The Tableau performance recording functionality is a built-in tool that can help you assess the performance of your workbook and identify processes that might be slowing it down. In this recipe, we started the performance recording, and performed some actions, such as filtering. After we finished recording, Tableau automatically generated a read-only workbook that contains a dashboard with the processes that have taken place since we started recording, and the respective times they took to run.
The dashboard contains the Timeline, Events, and Query views, which are described here:
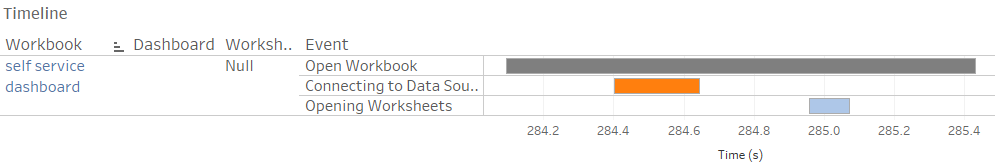
- Timeline: This view shows the processes that have taken place during the recording in chronological order. The processes are ordered from left to right along the
x
-axis, which represents the time since Tableau started. The view also provides information on the context of the events (Workbook, Dashboard, and Worksheet) and the nature of the event itself (Event). If you noticed performance issues with your workbook, this view is useful in exploring where the bottleneck occurs. Let's look at the processes that took place in the Timeline view, in the following screenshot:
- Events: This view also shows the processes (events), but sorted by their duration, which is shown on the
x
axis. This view is very helpful because it highlights the processes that are taking the longest to run, making it easier to identify where the performance issue might be. In the following screenshot, we can see the processes of the Events view:

Both of the preceding views can be adjusted by using the Show Events taking at least (in seconds): filter, located in the top of the dashboard. By default, events taking less than 0.10 second are filtered out of both views, but shorter events can also be displayed by moving the filter slider to the left. In the following screenshot, we can see how the views can be adjusted:

- Query: The view is, by default, empty. However, it will be populated when you select an Executing Query event in either the Timeline or Events view. Let's look at the Query view in the following screenshot:

When you select a query event, the SQL or XML text (depending on whether you're connected to a data source directly or to a published data source, respectively) of that query will be displayed in the Query view. You can then use the text of the query to optimize it. We can view the result in the following screenshot:
