Once we've connected to two data sources, we can use them both to create views. Let's try it:
- In the top of the Data pane, select Internet_satisfaction as the active data source by clicking on it.
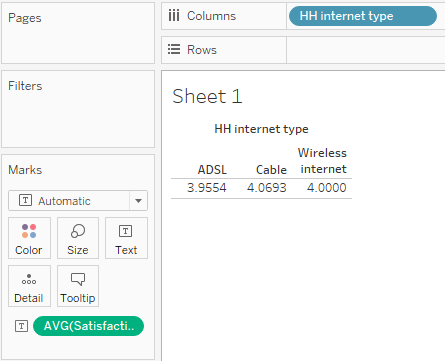
- Drag and drop HH internet type from Dimensions into the Columns shelf.
- Drag and drop Satisfaction overall from Measures onto Text in the Marks card.
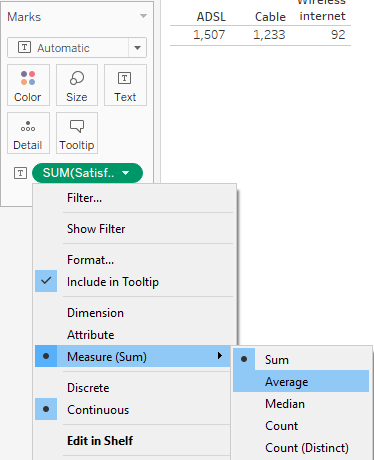
- Right-click on the SUM(Satisfaction overall) pill in the Marks card, navigate to Measure (Sum), and from the drop-down menu, select Average:
- We've created a view using the Internet_satisfaction data source:
- Now, open a new blank worksheet by clicking on the New Worksheet tab at the bottom of the workspace.
- In the top of the Data pane, select Internet_usage as the active data source by clicking on it.
- Drag and drop Settlement type from Dimensions into the Columns shelf.
- Drag and drop Internet penetration from Measures onto Text in the Marks card.
- Right-click on the SUM(Internet penetration) pill in the Marks card, navigate to Measure (Sum) and from the drop-down menu select Average:

Here, we've created two tables that contain data and fields from two different data sources, as shown in the preceding screenshot.