The Nitrogen Cycle
12.1 Introduction
In most natural systems available or “fixed” nitrogen is usually the limiting factor in plant growth. This realization led to the invention and massive use of nitrogen fertilizers during the 20th century and ever increasing crop yields per acre of farmed land. Without this use of nitrogenous fertilizers, the Earth could not support its current population of six billion people (Smil, 1997).
At the same time, the widespread use of fossil fuels releases not only carbon dioxide, but nitrogen oxides as well. These nitrogen oxides contribute to urban photochemical smog and acid precipitation. The combined effect of these two anthropogenic processes, agriculture and fossil fuel combustion, is similar in magnitude to natural nitrogen fixation. These substantial modifications to the global nitrogen cycle have important implications in a number of areas including photochemical smog, climate, stratospheric ozone, regional eutrophication, and ecosystem diversity, which will be discussed in this chapter.
12.2 Chemistry
Nitrogen has five valence electrons and can take on oxidation states between +5 and – 3. Most of the nitrogen compounds we will discuss either have nitrogen bonded to carbon and hydrogen, in which case the oxidation state of the nitrogen is negative (N is more electronegative than either C or H); or have nitrogen bonded to O, in which case the nitrogen has a positive oxidation state.
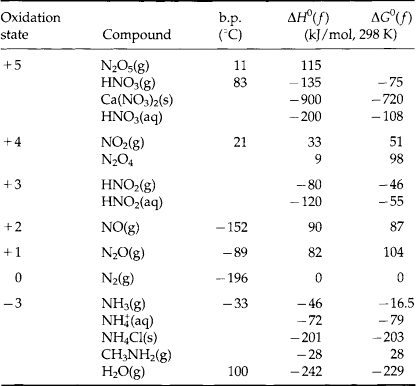
Table 12-1 lists the most common nitrogen compounds that exist in the natural world, by oxidation state. In addition it also lists the boiling point for each compound as well as its heat of formation (ΔH0(f)) and free energy of formation (ΔG0(f)). For comparison, the data on H2O are also included.
To fully understand some of the major players in the nitrogen cycle, we should also consider some of the industrial and social implications of these compounds.
1. HNO3. Nitric acid is a very strong acid; about 6.8 million metric tons per year are manufactured for industrial purposes in the US. Most of it is produced from ammonia by the catalytic oxidation to NO, which is then further oxidized to NO2. Addition of water forms HNO3. Most of the nitric acid produced is used in the manufacture of fertilizers, and a lesser amount is used to make explosives.
In the troposphere, nitrogen oxides react to also produce HNO3. The oxidants are free radicals produced photochemically, such as HO2, RO2, and OH. The HNO3 produced in this manner is an important contributor to “acid rain.”
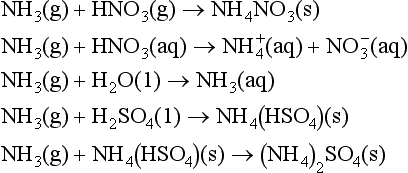
In its pure form, nitric acid is a liquid with a high vapor pressure (47.6 torr at 20°C), so that in the lower atmosphere HNO3 exists as a gas, in an aerosol or in a cloud droplet. When nitric acid reacts with a base a nitrate salt is produced. If the atmospheric base is ammonia, NH4NO3 is the result:
If the reaction is between two gas-phase species, then this reaction could be a source of cloud condensation nuclei, or simply a means to neutralize an acidic aerosol. Although there are some questions concerning the measurement of atmospheric HNO3, (Lawson, 1988) most measurements indicate that gaseous HNO3 concentrations predominate over particle NO3−.
In addition, there are numerous other nitrate salts. These are all high-melting, colorless solids, and are very soluble in water. Many of these, such as KNO3 and NaNO3, are mined for use in fertilizers and explosives. Prior to the industrial production of HNO3 from ammonia, the mining of these salts was the major means for producing explosives. During World War I, Germany’s supply of NaNO3 from Chile was cut off. The Haber process (N2 + 3H2 → 2NH3), developed by Fritz Haber only a few years earlier, allowed Germany to produce ammonia, and therefore nitric acid, to make nitrate salts for explosives. This allowed Germany to continue its war effort even without its Chilean source of NaNO3.
2. NO2. Nitrogen dioxide is a brown/yellow gas at room temperature due to its light absorption at wavelengths shorter than 680 nm. NO2 dimerizes into the colorless N2O4 (and indeed there is a very small amount of N2O4 found in urban atmospheres). Nitrogen dioxide has a very irritating odor, and is quite toxic. It is produced by the oxidation of NO, so that the concentrations of these two gases are coupled in the atmosphere. Since NO is a by-product of virtually all combustion processes, NO and NO2 are generally found in much higher concentrations in urban areas than in the natural background, and this is a significant source of photochemical smog.
3. NO. Nitric oxide, or nitrogen monoxide, is a colorless gas at room temperature. As we have already seen, it is industrially produced by the oxidation of ammonia. However, with respect to the urban environment, a more significant process is the high temperature reaction of N2 with O2 (as in a car engine) to produce NO.
4. N2O. Nitrous oxide is also a colorless gas at room temperature. Its principal uses are as “laughing gas” and as an aerosol propellant. Industrially, it is not produced in large quantities. In many respects N2O is analogous to CO2. It has the same linear structure, the same number of electrons (isoelectronic), and a similar (low) reactivity. However, CO2 is more soluble in water as a result of the acid-base reaction of CO2 and water. It is the low reactivity of N2O that results in a long tropospheric lifetime, and therefore its eventual transport to the stratosphere, where it is believed to be a primary control on the concentration of ozone in the stratosphere. Concentrations of N2O in the troposphere are increasing and this is significant since it is a “greenhouse” gas and plays a significant role in stratospheric ozone chemistry.
5. N2. Nitrogen is a colorless gas at room temperature. It is generally considered to be a very stable molecule; however, it is not its thermodynamic stability, but rather kinetics that accounts for its low reactivity. This is shown by the values of the thermodynamic parameters given in Table 12-1. In the presence of oxygen, N2 is thermodynamically unstable with respect to aqueous NO3−, but the high activation energy necessary to break the N2 triple bond results in its chemical inertness. If we lived in a world dominated by equilibrium chemistry, most atmospheric N2, and all of the O2 would be consumed, yielding an ocean containing approximately 0.1 M HNO3 (Lovelock, 1979). As a result of its non-polar nature N2 has a low solubility in water, but with its high partial pressure in the atmosphere it is the most prevalent nitrogen species in the ocean. Nitrogen constitutes some 78% by volume of the atmosphere, and is industrially separated by the liquefication and distillation of air.
6. NH3. Ammonia is a colorless gas. It is a strong base, forms hydrogen bonds, is soluble in water, and is a fairly reactive molecule. Each year 12.4 million metric tons are manufactured by the Haber process (N2 + 3H2 → 2NH3 at 400°C and 250 atm), principally for nitric acid production, which is then used to make fertilizers and explosives. As a fertilizer, ammonia can be utilized in three ways: first by direct injection of the boiling (-33°C) liquid. This method works only because most soils are moist and acidic, so that the NH3 dissolves in the wet soil before it evaporates. The second method is to use ammonia in ammonium salts, such as NH4Cl(s) or NH4NO3(s). The third method is to oxidize the ammonia to HNO3, and use it in a nitrate salt. In the atmosphere, ammonia is the primary gaseous base, so that it will react with acids either in the gas or aqueous phase to produce an ammonium salt, as in these reactions:
A significant proportion of the total reduced nitrogen in the atmosphere exists as aqueous or aerosol ammonium ion, with lesser amounts of gaseous ammonia (Quinn et al., 1988). Ammonia has a very irritating odor, and is toxic at low concentrations. Ammonium salts contain the tetrahedral ion. Some ammonium salts, like NH4NO3 and (NH4)2SO4, are manufactured on a large scale, 6.0 and 1.8 million metric tons per year respectively. Ammonium sulfate is used principally as a fertilizer, whereas ammonium nitrate is also used in explosives. Since plants can utilize nitrogen in both the – 3 and +5 oxidation states, ammonium nitrate is particularly well suited for use as a fertilizer; however, it must be handled with caution. In April 1947, a ship loaded with ammonium nitrate in Texas City, Texas, exploded, killing a total of 576 people both onboard and in the surrounding city.
There are also many significant nitrogen compounds that are a necessary part of all organisms. Most of these have nitrogen in a –3 oxidation state.
7. Amines. Amines (R—NH2) are an organic derivative of ammonia, where an alkyl group (—R) replaces one or more of the hydrogens. The simplest amine is methylamine, CH3—NH2. An amine can have one, two, or three alkyl groups, as in trimethylamine, (CH3)3—N. Like ammonia, amines are fairly basic and participate in hydrogen bonding; low molecular weight amines are quite water soluble. As the alkyl groups get larger the amine begins to show more properties of an organic molecule than of ammonia, and water solubility decreases. The amines are generally odorous compounds with relatively high boiling points, due to hydrogen bonding. Methylamine, and other amines, are often found in the flesh of rotting fish, and this could represent a pathway into the atmosphere for these compounds. Amines are bases, and their reaction with acids in the atmosphere is probably their principal removal mechanism (as for ammonia):
The alkyl ammonium ion is quite soluble in water. Like ammonia, amines may also be oxidized. As would be expected from their structure, amines are fairly polar. Amines (including aromatic amines) are quite common in the biological world. For example many vitamins (such as thiamine and niacinamide) and all alkaloids (e.g. caffeine, cocaine, nicotine, and lysergic acid) contain an amine functional group. Many of these groups are found in ring systems, with pyridine rings (C5H5N) being quite common.
8. Amides. Amides occur quite frequently in nature, most significantly in urea and proteins. Urea, NH2—CO—NH2, is an important carrier of nitrogen between animals and plants. Animals metabolize proteins and amino acids, and excrete large amounts of urea. Plants break urea down into ammonia, which they can utilize. For this reason, urea is also an excellent fertilizer, and five million metric tons are manufactured each year through the high-temperature reaction of CO2 and NH3. Animal excrement and urea fertilizers are thought to be significant sources of atmospheric ammonia (Freney et al., 1983).
Proteins are also important nitrogen compounds. They constitute much of the cell materials, and are present in every type of organism known. In humans, muscle tissue, skin, and hair is mostly protein, about half of the dry weight of our bodies. From a chemical point of view, proteins are polymers of amino acids, alpha amine derivatives of carboxylic acids. Only about 20 different amino acids are actually found in proteins. It is the large number of variations in the protein chain, using only these 20 amino acids that gives rise to the great diversity of proteins. Numerous other organic nitrogen compounds are found in natural systems in small amounts, some of which are very toxic or carcinogenic. These include certain types of nitro compounds, cyano compounds, or nitrosamines, for example.
Having considered many of the different type of compounds we will be discussing, we should briefly consider some of the uses of the data presented in Table 12-1. The thermodynamic relationships can be used to calculate equilibrium concentrations for such gases as NO and NO2 in air. This only requires the relationship between ΔG0 and the equilibrium constant. A more complex analysis would include the contribution of photolytically driven reactions, to derive steady-state concentrations for many trace species. Holland (1978) has presented such an analysis for an abiotic world, including the input energy from sunlight. His results show that virtually all nitrogen compounds are currently found at much higher levels than the calculated steady-state value, indicating that other important processes have been ignored. This can only happen if the chemical reactions are slow compared to the rates of other processes. Lovelock (1979) has stated that on Earth, the disagreement between abiotic steady-state calculated concentrations and measured atmospheric concentrations indicates the presence of life, and suggests that atmospheric chemical probes can be used as a simple means to detect life on any planetary system. If chemical measurements of a planet’s atmosphere show that it is close to thermodynamic equilibrium, substantial numbers of living organisms are probably not present. In natural systems, some thermodynamic equilibria do exist, but in many cases, environmental systems are in some type of dynamic non-equilibrium steady state. On Earth, the presence of life significantly alters the atmospheric concentrations of many trace species.
12.3 Biological Transformations of Nitrogen
Our next task is to consider the various ways that nitrogen is processed by the biosphere. These mechanisms are the primary mover in the terrestrial and oceanic nitrogen cycles. It is important to remember that even though much of our discussion of the nitrogen cycle revolves around transfer of nitrogen between the major global reservoirs (atmosphere, aquatic, and biosphere), these fluxes represent only a small portion of the nitrogen transferred within the biosphere-soil and biosphere-aquatic systems. Rosswall (1976) estimates that on a global basis, the “internal” biological nitrogen cycle accounts for 95% of all nitrogen fluxes. The important processes are indicated schematically in Fig. 12-1. The various terms are easier to identify if one remembers that they are defined from the perspective of the organism.
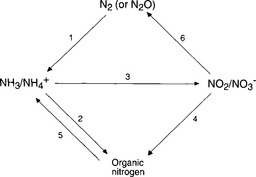
Fig. 12-1 Biological transformations of nitrogen compounds. The numbers refer to processes described in the text.
1. Nitrogen fixation is any process in which N2 in the atmosphere reacts to form any nitrogen compound. Biological nitrogen fixation is the enzyme-catalyzed reduction of N2 to NH3, NH4+, or any organic nitrogen compound.
2. Ammonia assimilation is the process by which NH3 or NH4+ is taken up by an organism to become part of its biomass in the form of organic nitrogen compounds.
3. Nitrification is the oxidation of NH3 or to NO2− or NO3− by an organism, as a means of producing energy.
4. Assimilatory nitrate reduction is the reduction of NO3−, followed by uptake of the nitrogen by the organism as biomass.
5. Ammonification is the breaking down of organic nitrogen compounds into NH3 or NH4+.
6. Denitrification is the reduction of NO3− to any gaseous nitrogen species, generally N2 or N2O.
All of the above processes are mediated by various types of microorganisms. Some of these processes are energy producing, and some of these occur in symbiotic relationships with other organisms. It is appropriate to start discussion of the processes with nitrogen fixation, since this is the only means by which nitrogen can be brought into natural systems (in the absence of artificial fertilization). Similarly, it is principally denitrification that removes nitrogen from the biosphere.
Biological nitrogen fixation is the ultimate source of nitrogen in all living organisms, in the absence of industrial fertilizers. It can be done by a variety of bacteria and algae, both symbiotic and free living, although, in general, the symbiotic organisms are thought to be quantitatively more significant. There are two major limitations to biological nitrogen fixation. The first is that the process takes a large amount of input energy to overcome the high activation energy of the nitrogen triple bond. Despite the fact that ΔG0 for the production of NH3 from N2 and H2 is negative at 25°C, only those organisms with highly developed catalytic systems are able to fix nitrogen. The second limitation is that nitrogen fixation is a reductive process, highly sensitive to the presence of O2, and so only those organisms that live in anaerobic environments, or can provide an anaerobic environment, will fix nitrogen. Burns and Hardy (1975) present a good review of biological nitrogen fixation.
In terrestrial systems the symbiotic bacteria, particularly strains of genus Rhizobium, are a significant source of nitrogen fixation. These bacteria are found on the roots of many leguminous plants (clover, soybeans, chickpeas, etc.), and have been used agriculturally as a means of replenishing soil nitrogen (“green manures”) (Smil, 1997). Many of these organisms are anaerobes, or have developed mechanisms to maintain an anaerobic environment (Granhall, 1981). Other symbiotic diazotrophs (nitrogen-fixing organisms) exist, but the Rhizobium have been the most extensively studied (e.g., Postgate, 1982).
Most diazotrophic (nitrogen-fixing) organisms utilize the nitrogenase enzyme. This enzyme has been the focus of intensive research in recent years due to the possibilities of utilizing it to improve industrial nitrogen fixation (Postgate, 1982). It has been isolated from 20 to 30 different prokaryotic organisms and appears to have very similar properties regardless of the source. Nitrogenase consists of two metalloproteins; one, a Mo-Fe protein, which serves to bind the N2 to the enzyme, probably at the metal site, the other an Fe protein, which is the source of electrons for the reduction. Both of these metalloproteins are very sensitive to O2. It is interesting to note that whereas microorganisms can fix N2 at a partial pressure of 0.8 atm and 20°C, the industrial fixation requires 250 atm and 400°C!
Once nitrogen has been fixed in the soil or aquatic system as NH3 or , there are two major pathways it can follow. It can be oxidized to NO2−/NO3−, or assimilated by an organism to become part of its biomass. The latter process is termed ammonia assimilation, and for those organisms that can directly utilize ammonia, this represents a significant nitrogen source. Since many plants obtain most of their nitrogen from nitrate, via reductive assimilation, direct ammonia assimilation yields a significant energy savings, and therefore gives those organisms a competitive advantage. Free NH4+ ion does not exist for long in aerobic soils before nitrification occurs, and so NO3− is the prevalent form of nitrogen in aerobic soil and aquatic environments (Delwiche, 1981). Ammonia assimilation does not involve nitrogen transfer to other reservoirs, and is quantitatively less significant than nitrification.
Nitrification consists of two energy yielding steps: the oxidation of ammonium to nitrite, and the oxidation of nitrite to nitrate. These equations are generally represented as follows:
There are several organisms that utilize nitrification as an energy source (Delwiche, 1981). The first step in the process is principally done by bacteria of genus Nitrosamonas, and the second by Nitrobacter, both autotrophic organisms. These organisms utilize CO2 as a carbon source and obtain their energy from the oxidation of . Heterotrophic bacteria, which utilize organic compounds rather than CO2, can also perform nitrification; however, these are thought to be quantitatively much less significant than the autotrophs (Bremner and Blackmer, 1981). In the oxidation of
 to NO3−, hydoxylamine (NH2OH) and other less stable compounds are likely intermediates, and NO and N2O are almost certainly intermediates, probably as enzyme bound complexes. These intermediates have brought attention to nitrification as a possible source of atmospheric constituents, particularly N2O.
Once in a soil or aquatic system, nitrate has two major pathways, it can serve as a terminal electron acceptor under anaerobic conditions (denitrification), or it can be simultaneously reduced and assimilated into an organism’s biomass. The latter process is termed assimilatory nitrate reduction, and is likely to be dominant when reduced nitrogen is in low supply, as during aerobic conditions. This represents a primary input of nitrogen for most plants and many microorganisms. Most plants can assimilate both and NO3−, even though there is an energy cost in first reducing the NO3−. After the NO3− has been taken up by the root system of a plant and reduced, it then follows the same pathway by which
 is incorporated into its biomass (Kikby, 1981).
Besides nitrogen fixation, the only other major source of reduced nitrogen is the decomposition of soil or aquatic organic matter. This process is called ammonification. Heterotrophic bacteria are principally responsible for this. These organisms utilize organic compounds from dead plant or animal matter as a carbon source, and leave behind NH3 and , which can then be recycled by the biosphere. In some instances heterotrophic bacteria may incorporate a complete organic molecule into their own biomass. The majority of the NH3 produced in this way stays within the biosphere; however, a small portion of it will be volatilized. In addition to this source, the breakdown of animal excreta also contributes to atmospheric ammonia. It is generally believed that volatilization from animal excreta is more significant than ammonification, as a source of atmospheric ammonia. Freney et al. (1983) present a good review on the overall ammonia volatilization process.
Denitrification is the only process in which the major end-product is removed from the biological nitrogen cycle. It is the principal means of balancing the input flux from nitrogen fixation. Generally, N2 is the end-product of denitrification; however, NO, and particularly N2O, are also common. Microorganisms use NO3− as a terminal electron sink (oxidant) in the absence of O2, as in waterlogged anaerobic soils. The overall process of oxidizing an organic compound, and reducing the NO3−, is an energy producing process for the microorganisms. There are approximately 17 genera of facultative anaerobic bacteria that can utilize NO3− as an oxidizing agent, and these are thought to be widespread. Denitrification occurs via a well-known series of intermediates, including NO2−, NO, and N2O. The ratio of N2:N2O production during denitrification is an interesting topic. Generally the major product is N2, accounting for 80–100% of the nitrogen released (Delwiche, 1981). Söderlund and Svensson (1976) used a global terrestrial average of 16:1 for N2:N2O in calculating the N2O flux to the atmosphere. Under certain environmental conditions, nitrous oxide can become a major product. Generally, conditions that increase the amount of N2O production also decrease the overall rate of denitrification. For example, at lower pH values, and higher O2 concentrations, the proportion of N2O increases, but the overall rate of denitrification decreases.
From a biogeochemical cycle perspective, the biological nitrogen cycle is not a simple system. It is clear that that the largest nitrogen input to the biosphere is biological fixation, and the primary loss from the biosphere is denitrification. However, from a biogeochemical perspective, it is not the exchange of N2 that is the most important process, but rather the exchange of various trace gases, such as NO, NO2, N2O, and NH3. Trace gases are released into the atmosphere at various stages in the biological nitrogen cycle. To understand the behavior of these trace gases, it is necessary to consider a wide range of biological processes.
12.4 Anthropogenic Nitrogen Fixation
Human activities result in the fixation of huge amounts of nitrogen on a daily basis. This occurs as a result of three different processes:
1. Direct intentional production of NH3 and HNO3 (mostly for fertilizer)
2. Unintentional production of NO during combustion (fossil fuels and biomass)
3. Biological nitrogen fixation as a result of agricultural practices (e.g., planting clover so as to replenish nitrogen on farmlands).
As mentioned in the introduction, the rapid growth in fertilizer use over the past 50 years has allowed us to feed the six billion inhabitants on the planet today (e.g., Smil, 1997). Over the same time period, fossil fuel usage has shot up dramatically and is now a major source of “fixed” nitrogen, both in developed and developing countries around the world. As a result of the rapid growth in these activities, the total anthropogenic N fixation (the sum of these three processes) is now similar to the global natural N fixation and this is thought to be an issue of some concern (e.g., Galloway et al., 1995; Vitousek et al., 1997a,b).
Production and use of industrial nitrogen fertilizers is a late 20th century phenomenon. Industrially produced nitrogen fertilizers come in many forms, including NH3, (NH4)SO4, NH4NO3, and urea. Starting around 1950, when production was less than 5 Tg N/yr, it has increased to a current value of around 80 Tg N/yr. Smil (1997) shows that fertilizer use is closely linked to rapid population growth over this same time period. Estimates by Galloway et al. (1995) suggest that this increase will continue into the 21st century, with most of the growth in fertilizer use coming in the developing world. This is also the region where most of Earth’s population growth is predicted to occur. Although industrially produced fertilizers have substantially increased agricultural yields, this process is not without its concerns, and these will be described in Section 12.7 below.
Unintentional N fixation occurs every time we burn fossil fuels to produce nitric oxide, NO. This occurs as a result of the high-temperature combination of N2 and O2 (described previously). In urban regions the NO is the primary cause for photochemical smog. Eventually most of the NO is converted into HNO3, which is a major contributor to acid rain. Galloway et al. (1995) estimate that NO produced from fossil fuel combustion has doubled over the past 30 years (from ∼ 10 to 20 Tg N/yr) and will double again over the next 30, with most of the increase in developing regions.
The use of plants, such as clover and soybeans, by humans to increase available nitrogen is a much older practice and not changing as rapidly as the other nitrogen fixing processes. The flux is also much less certain. Galloway et al. (1995) estimate that the current value for nitrogen fixation by legumes and other planted vegetation is ∼40 Tg N/yr, with only a modest (20%) increase over the past 20 years.
12.5 Atmospheric Chemistry
The atmospheric chemistry of nitrogen is quite complex and involves literally hundreds or thousands of chemical reactions. Although the fluxes are much smaller than the biological fluxes, these processes are important for a variety of reasons, including impacts on climate, stratospheric ozone, and photochemical smog. In this section we present an overview of the most important processes.
12.5.1 Homogeneous Gas Phase Reactions
Photochemistry plays a significant role in nitrogen’s atmospheric chemistry by producing reactive species (such as OH radicals). These radicals are primarily responsible for all atmospheric oxidations. However, since the photochemistry of the atmosphere is quite complex, it will not be dealt with in detail here. For an in-depth review on tropospheric photochemistry, the reader is referred to Logan et al. (1981), Finlayson-Pitts and Pitts (1986), Crutzen and Gidel (1983) or Crutzen (1988).
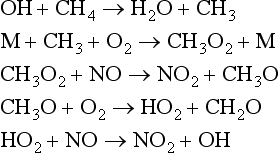
In most cases, the direct reaction of N2 with O2 is slow under ambient conditions. It is the presence of numerous odd electron species (for example, OH, HO2, and RO2 radicals) that are photochemically produced and responsible for most of the oxidizing reactions of nitrogen species in the atmosphere. Some of the important reactions are shown below: O3+hv→O2+O(1D)O(1D) is an electronically excited oxygen atom. It can decay back to a ground state oxygen atom (3P) (which will regenerate an ozone molecule), or else it can react with water to produce two OH radicals:O(1D)+H2O→2OHThe OH radical is a primary oxidizer in the atmosphere, oxidizing CO to CO2 and CH4 and higher hydrocarbons to CH2O, CO, and eventually CO2. OH and other radical intermediates can oxidize CH4 and NO in the following sequence of reactions:
Net reaction:
Hydroxyl, OH, acts as a catalyst for the oxidation of NO to NO2. NO2 molecules can react with the OH radical to produce HNO3, which may be removed in precipitation. This is how most tropospheric NOx eventually gets removed, either in wet or dry deposition.
NO2 may also photolyze and produce a ground state O atom, which will go on to produce ozone:
These reactions are important in a cycle that oxidizes CO and hydrocarbons and produces ozone, in the presence of NOx (NO + NO2). In photochemical smog, ozone can build up to unhealthy levels of several hundred parts per billion (ppb) as a result of these reactions. There are many other reactions that occur, some of which may be significant at various times, including the destruction of O3 by NO, production and loss of HONO (nitrous acid) and peroxyacetyl nitrate (PAN). These reactions, and many more, represent a complex set of chemical interactions. For our purposes here, it is only necessary to note the major features.
1. The oxidation of CO and all hydrocarbons to CO2 is indirectly driven by ozone and sunlight via the OH radical.
2. In the presence of sufficient NOx (roughly 30 parts per trillion) this oxidation produces ozone.
3. Most NO and NO2 eventually gets removed as HNO3.
4. The lifetime of gaseous NOx in the troposphere is on the order of 1–30 days (Söderlund and Svensson, 1976; Garrels, 1982; Crutzen, 1988).
5. Conversion of NOx to PAN can result in significantly greater disbursement (e.g., Honrath and Jaffe, 1992).
Nitrogen oxides also play a significant role in regulating the chemistry of the stratosphere. In the stratosphere, ozone is formed by the same reaction as in the troposphere, the reaction of O2 with an oxygen atom. However, since the concentration of O atoms in the stratosphere is much higher (O is produced from photolysis of O2 at wavelengths less than 242 nm), the concentration of O3 in the stratosphere is much higher.
Stratospheric ozone production is balanced by various catalytic destruction sequences:
Net:
where X can be any of the radical species NO, H, or Cl. For example substituting NO for X yields
Net:
Considering natural stratospheric ozone production/destruction as a balanced cycle, the NOx reaction sequence is responsible for approximately half of the loss in the upper stratosphere, but much less in the lower stratosphere (Wennberg et al., 1994). Since this is a natural steady-state process, this is not the same as a long term O3 loss. The principal source of NO to the stratosphere is the slow upward diffusion of tropospheric N2O, and its subsequent reaction with O atoms, or photolysis (McElroy et al., 1976).N2O + hv → N2 + ON2O + O(1D) → 2NOThe first of these reactions results in the generation of a single ozone atom, whereas the second reaction produces two NO molecules which leads to catalytic ozone destruction as shown above. The relative rates of these two reactions is in an approximate ratio 9:1, favoring the first. Since NO is a catalyst for O2 destruction (a single NO will destroy many ozone molecules before being removed), N2O is believed to exert a significant control on stratospheric O3 concentrations, although the effect is quite complex (e.g., Wennberg et al., 1994).
A ground level source and stratospheric sink for N2O is consistent with the observed vertical concentration gradient (Weiss, 1981). The chemistry of stratospheric ozone is complex and closely tied to nitrogen species. Data from Antarctica suggest that anthropogenically produced chlorofluorocarbons fragment and result in substantial ozone depletion in the stratosphere (Farman et al., 1985). This process is accelerated in the extremely cold vortex that forms over Antarctica each winter. Measurements suggest that the nitrogen oxides, which would generally remove Cl fragments, are tied up in ice particles in polar stratospheric clouds, which form only at very low temperatures. Once the nitrogen oxides are “frozen out,” the Cl fragments can go on to catalytically destroy ozone. Although the chemistry is complex, it is clear that N2O and NOx in the stratosphere play a critical role in the chemistry of ozone (Solomon and Schoeberl, 1988; Toon and Turco, 1991).
12.5.2 Heterogeneous Atmospheric Reactions
Heterogeneous processes play a role in several ways including: gas-particle conversions, gas uptake by cloudwater and precipitation, exchange of gases into or from the oceans, and exchange of gases into or from soil.
In the atmosphere, precipitation is the most important means to remove the and NO3− ions. These ions are produced by reactions such as the following:
All of these species are very soluble in a rain or cloud drop and are an important source of atmospheric aerosols. For ammonia and ammonium, the condensed phases (l and s) represent approximately two-thirds of the total atmospheric burden, whereas for nitric acid and nitrates, about two-thirds is in the gas phase (Söderlund and Svensson, 1976).
The oceans represent a large potential reservoir for any gaseous compound. The solubility of a particular compound is governed by its chemical structure, temperature, pH, and other chemical properties of the solution, as well as its atmospheric concentration. For some atmospheric gases, such as NH3 and NOx, the oceans are probably a net sink (through the mechanism of precipitation), since virtually all measurements of oceanic air show significantly lower concentrations than is found over continental regions. This seems reasonable in light of the fact that most sources for NH3 and NOx are in continental areas. However, recent measurements of gaseous and aerosol ammonia in seawater and air indicate that the oceans are supersaturated with respect to ammonia in some regions. Thus they are a likely source, locally, of gaseous ammonia, while at the same time being a net global sink for it (Quinn et al., 1988).
Loss of nitrogen compounds from soils is also a major pathway into the atmosphere for some compounds (e.g., N2O, NO, and NH3). As in the aquatic systems, parameters that play an important role in this process include: the nature of the compound; soil temperature, water content, pH, aeration of the soil; and a concentration gradient of the gas in question.
12.6 The Global Nitrogen Cycle
The global nitrogen cycle is often referred to as the nitrogen cycles, since we can view the overall process as the result of the interactions of various biological and abiotic processes. Each of these processes, to a first approximation, can be considered as a self-contained cycle. We have already considered the biological cycle from this perspective (Fig. 12-1), and now we will look at the other processes, the ammonia cycle, the NOx cycle, and the fixation/denitrification cycle.
12.6.1 Nitrogen Inventories
We will consider the inventories of nitrogen in the following compartments: terrestrial, oceanic, and atmospheric. In general, there is more agreement among researchers over the values for the nitrogen burdens, than for the fluxes. In considering these inventories it is significant to recall that 99.96% of the non-crustal nitrogen exists as uncombined atmospheric N2 and it is this fact that causes nitrogen to often be a limiting nutrient in the condensed phase.
The principal form of nitrogen in terrestrial systems is as dead soil organic matter, with biomass accounting for only about 4%, and inorganic nitrogen about 6.5%, on a global average (Söderlund and Svensson, 1976). There is, however, a large difference in the distribution of nitrogen in the tropics and the polar regions, with tropical regions having a larger proportion of nitrogen contained as biomass. Most of the reservoirs for organic nitrogen and biomass have been estimated by knowledge of the carbon content of soils and biomass and an appropriate ratio of carbon to nitrogen. The inventories of inorganic forms of nitrogen have a higher relative uncertainty.
Dissolved N2 is the principal form of nitrogen in the oceans, accounting for 95% of the total oceanic nitrogen. The remainder of the oceanic nitrogen is principally NO3− and dead organic matter. The oceans hold about 0.5% of the total non-crustal nitrogen (as N2). In contrast to CO2, where the oceans are a significant reservoir, the oceans contain only about 15% of the total N2O, due to its lower solubility. As in the terrestrial compartment, organic nitrogen compounds are estimated from knowledge of the carbon content and an appropriate C/N ratio, and the inorganic nitrogen inventories have a higher relative uncertainty.
In the atmosphere, N2 is the principal nitrogen component and over 99% of the remaining nitrogen is found as N2O. The other trace nitrogen species all have reactivities and removal mechanisms that result in residence times of less than a year and low atmospheric concentrations. Gaseous ammonia, for example, decreases significantly with height due to its removal by acidic gases, acidic aerosols, and liquid water (Hoell et al., 1980). The short residence times for these species results in concentration fields, which are highly inhomogeneous, and thus difficult to quantify on a global basis. The inventory accuracy of many of the trace species, particularly NH3, are limited by scant data, especially in the southern hemisphere and remote regions of the globe. For NOx, a large number of recent field campaigns have significantly increased our understanding of this important species (e.g., Emmons et al., 1997). Based on the use of a global three-dimensional model, Jaffe et al. (1997) estimate that the troposphere contains 0.6 Tg N of reactive nitrogen oxides (primarily NOx, PAN, and HNO3), with another 1–1.5 Tg N present in the stratosphere (mostly as HNO3). Figures 12-2, 12-3, and 12-4 show the distribution of various forms of nitrogen in the atmospheric, oceanic, and terrestrial reservoirs.
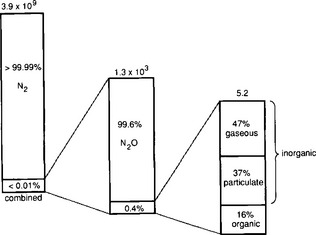
Fig. 12-2 Partitioning of the various forms of nitrogen in the atmosphere. Units are Tg N. (Reprinted with permission from R. Söderlund and T. Rosswall, The nitrogen cycles. In O. Huntizger (1982). “The Natural Environment and the Biogeochemical Cycles,” p. 70, Springer-Verlag, Heidelberg.)
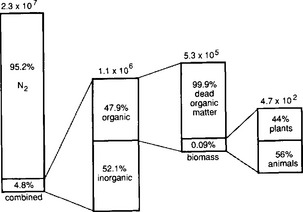
Fig. 12-3 Partitioning of the global inventories of nitrogen in the aquatic system. Units are Tg N. (Reprinted with permission from R. Söderlund and T. Rosswall, The nitrogen cycles. In O. Huntizger (1982). “The Natural Environment and the Biogeochemical Cycles,” p. 71, Springer-Verlag, Heidelberg.)
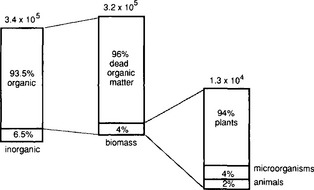
Fig. 12-4 Partitioning of the global inventories of nitrogen in the terrestrial system. Units are Tg N. (Reprinted with permission from R. Söderlund and T. Rosswall, The nitrogen cycles. In O. Huntizger (1982). “The Natural Environment and the Biogeochemical Cycles,” p. 72, Springer-Verlag, Heidelberg.)
12.6.2 Fluxes of Nitrogen
Figure 12-5 shows a schematic diagram of the NH3/ cycle. The largest source of atmospheric ammonia is ammonification and volatilization from animal excreta (Freney et al., 1983). This includes a substantial fraction, probably more than half of the total, due to domestic animals. Direct anthropogenic emissions, including combustion and fertilizers, are much smaller. The majority of this NH3(g) is returned as
 in precipitation or as NH3(g) via dry deposition. The ammonia is then available again to the biosphere, and the cycle is repeated.
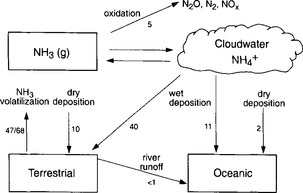
Fig. 12-5 The ammonia-ammonium cycle. Each arrow represents one flux. The magnitude of the flux is given in Tg N/yr−1. Where two numbers are given, the top value is the anthropogenic contribution and the lower is the total flux (natural + anthropogenic).
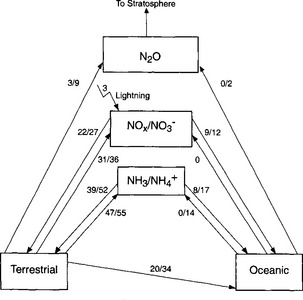
In the NOx cycle (Fig. 12-6), gaseous emissions of NO, and much smaller emissions of NO2, are balanced by dry deposition of NO2 and HNO3 and wet deposition of NO3−. The principal sources of NOx are anthropogenic combustion (both fossil fuels and biomass). Microbial processes in soils, lightning, and natural forest fires are much smaller NOx sources (Galloway et al., 1995). In the atmosphere, NOx is converted to HNO3 via photochemical oxidation, and therefore has a short residence time, on the order of a few days. Wet deposition occurs mainly as NO3− in precipitation, and since the anthropogenic emissions of NOx occur mainly in urban areas, HNO3 is a significant contributor to acid precipitation in adjacent regions (within a few thousand km). Anthropogenic acid deposition results from both sulfur and nitrogen oxides; however, since emissions of NOx are increasing more rapidly than SO2 in many regions, NO3− is becoming an increasingly important contributor to acid deposition (Mayewski et al., 1990; Sirois, 1993). Once nitrate is deposited back to the terrestrial or oceanic systems it can be incorporated into biomass, enter the fixation-denitrification cycle, or accumulate in the ocean.
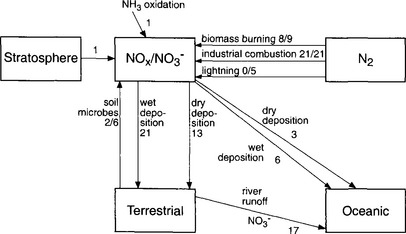
Fig. 12-6 NOx–NO3− cycle. Each arrow represents one flux. The magnitude of the flux is given in Tg N/yr. Where two numbers are given, the top values is the anthropogenic contribution and the lower number is the total flux (natural + anthropogenic).
As mentioned previously, the fixation-denitrification cycle (Fig. 12-7) is the most heavily perturbed by humans. This is due to both the increasing use of nitrogenous fertilizers and the planting of nitrogen-fixing plants. One of the most important results of this is the increasing emissions and concentration of atmospheric N2O.
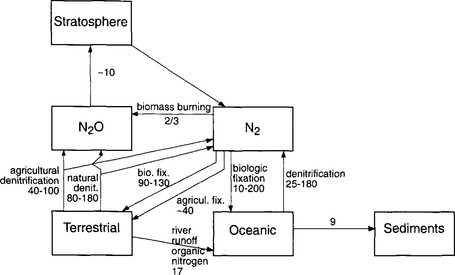
Fig. 12-7 Fixation-denitrification cycle. Each arrow represents one flux. The magnitude of the flux is given in Tg N/yr. Where two numbers are given, the top value is the anthropogenic contribution and the lower number is the total flux (natural + anthropogenic).
A summary of the major N fluxes is presented in Table 12-2 and Fig. 12-8 shows a summary of the N fluxes for atmospheric NH3, N2O, and NOx.
Table 12-2
Fluxes in the global nitrogen cycle (units are Tg N/yr)
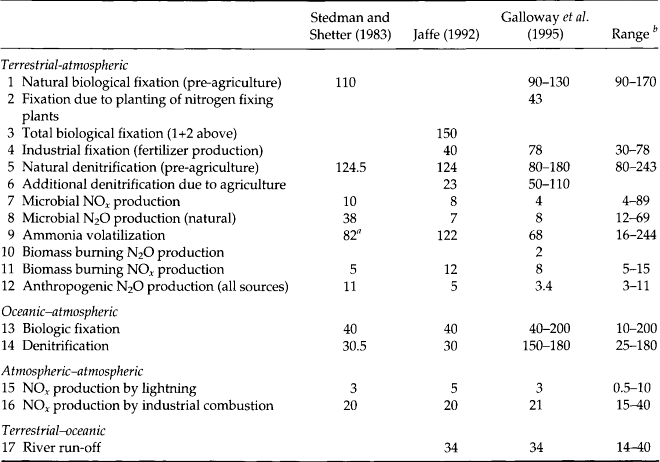
aNH only.
bFor additional flux estimates not reported here refer to Jaffe (1992).
12.7 Human Impacts
Vitousek et al. (1997a,b,c) describe a range of concerns associated with the large anthropogenic perturbations to the nitrogen cycle. This includes groundwater contamination from NO3− (agricultural runoff), eutrophication (agricultural runoff and atmospheric NO3− deposition), radiative forcing of climate (N2O and tropospheric O3), stratospheric chemistry, photochemical ozone “smog,” acid precipitation (HNO3 deposition), changes in species diversity (due to N deposition), and N fertilization of the global carbon cycle. We provide a brief overview of each of these issues.
12.7.1 Groundwater/Eutrophication
As described previously, agricultural fertilizer contains large amounts of fixed nitrogen, mostly in the form of NH3, , or NO3−. Some of this N is utilized by the growing crops, but a significant amount is not taken up by the biomass and instead washes off the farm and into either ground or surface waters. This can cause two different problems, NO3− toxicity and eutrophication.
Although NO3− is not usually thought of as a “toxic” chemical, it does cause several health problems including methemoglobinemia in infants (blue-baby syndrome) and may also be linked to stomach cancer. Agricultural runoff can lead to significant, potentially harmful, concentrations of NO3− in ground or surface water.
Eutrophication can occur when NO3− (or other nutrients such as PO43−) accumulate in lakes, ponds, or estuaries from agricultural runoff, sewage, or phosphate detergents. These nutrients will accelerate plant growth, often leading to algal blooms, oxygen depletion and sometimes mass fish death. Eutrophication can also lead to substantial impacts on the overall aquatic ecosystem. Impacts due to eutrophication are well known for the Baltic Sea, Black Sea, Chesapeake Bay, and other regions (Vitousek et al., 1997b). One example of the human influence on aquatic NO3− is the results reported by Turner and Rabalais (1991). These authors have shown that NO3− concentrations in the Mississippi River have more than doubled (since 1965) due to a variety of human causes. Similar results are known for other regions of the globe (Vitousek et al., 1997b).
12.7.2 Climate: N2O and Tropospheric O3
Due to the imbalance of sources and sinks, atmospheric N2O is increasing by 3 Tg N/yr or 0.2%/yr. Figure 12-9 shows average N2O mixing ratios from four stations in the NOAA–CMDL network, Barrow, Mauna Loa, Samoa, and the South Pole (data are from the NOAA–CMDL and can be obtained from http://www.cmdl.noaa.gov). The most recent IPCC estimate gives a total N2O source of 16 Tg N, 7 Tg of which are a result of human activities (IPCC, 1997). The largest contribution to the anthropogenic N2O sources is 3 Tg N from agricultural soils, mostly lost after applying fertilizer.
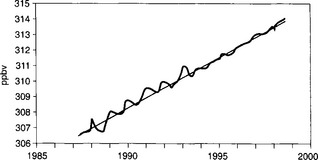
Fig. 12-9 Global N2O concentrations based on NOAA-CMDL observations at BRW, MLO, SMO, and SPO. Data are from the NOAA–CMDL and can be obtained from http://www.cmdl.noaa.gov.
With respect to nitrogen fertilizers, the subject of gaseous losses due to denitrification has been extensively studied. Rolston (1981) presents a good review of this topic, and gives data suggesting that anywhere from 10–75% of fertilizer nitrogen may be lost by this process (typically in the range of 20%). Various crop management practices have been developed to counter this problem. For example, having large amounts of NO3−, organic carbon and water will increase denitrification, whereas limiting one of these factors will decrease it.
Matson et al. (1998) describe an experiment on fertilizer usage and gaseous emissions on a wheat farm in Mexico. In this experiment, the authors used both a traditional/high fertilizer approach and a reduced fertilizer method, but where the fertilizer was applied in a manner that was more efficiently used by the growing plants. The results showed that when using a reduced fertilizer strategy crop yields per hectare were similar to the high fertilizer case, but gaseous N emissions (NO and N2O) were about 10% of the base case. Since this strategy used much less fertilizer, this protocol also gave the best results with respect to the farmer’s profits. This is important in that it shows that it is possible to reduce agricultural emissions of NO and N2O and improve the farmer’s bottom line.
Tropospheric ozone is also radiatively active and there is good evidence that it is now about twice its pre-industrial concentration, at least in the northern hemisphere. This increase is due to increasing emissions of NOx from fossil fuel combustion, followed by photochemical ozone production (Crutzen, 1988; Logan, 1985; Volz and Kley, 1988). This human caused change contributes significantly to radiative forcing of climate (Marenco et al., 1994; IPCC, 1995). Logan (1994) conducted a detailed evaluation of free tropospheric ozone sonde data. In general, this analysis shows ozone trends of about 1–2% per year over the last two decades over the US, Europe, and Japan, with the higher trends observed over Japan and Europe. For the US and Europe the O3 concentrations appear to have approximately leveled out, whereas the Japanese stations continue to show increases. This is consistent with the fact that NOx emissions in the US and Europe are not increasing, whereas they are increasing rapidly (5%/year) in East Asia (Kato and Akimoto, 1992).
The increases in both N2O and tropospheric O3 are leading to increased radiative forcing. Based on the concentration changes between pre-industrial times, 1850 to 1992, CO2, N2O, and tropospheric O3 contribute 1.56, 0.14, and 0.4 W/m2 to global average radiative forcing (IPCC, 1995). However, due to its shorter lifetime (2–4 weeks), tropospheric ozone is quite inhomogeneous in the troposphere and so the uncertainty in calculating its contribution to radiative forcing is significantly greater than for the more long-lived species. Based on projected future trends of energy consumption and agricultural emissions, all of these are expected to continue to increase through the 21st century.
12.7.3 Stratospheric Chemistry
As mentioned previously, N2O plays an important role in stratospheric chemistry by providing the dominant source of NOx in the stratosphere (seeSection 12.5). What is more difficult to predict is how stratospheric chemistry will change as a result of continued increases in the concentration of atmospheric N2O. Early research suggested that increased N2O would lead to significant reductions in stratospheric O3. However, more current reports suggest that stratospheric NOx plays a key role in “protecting” stratospheric O3 from more significant losses from CFC-produced Cl radicals (e.g., Solomon and Schoeberl, 1988; Toon and Turco, 1991). Exactly how future increases in N2O will impact stratospheric O3 is something of an open question at present.
An additional area of concern with respect to stratospheric ozone is possible direct emissions of NOx into the stratosphere by high-flying supersonic aircraft. This issue has come up repeatedly over the past 20 years, as air travel and pressure from commercial airlines has increased. However, despite substantial research effort to understand stratospheric chemistry, the question is complicated by the changing levels of stratospheric chlorine, first due to a rapid accumulation of tropospheric CFCs, followed by a rapid decline in CFC emissions due to the Montreal Protocol. To quote from the from the 1994 WMO/UN Scientific assessment of ozone depletion, executive summary (WMO 1995):
Atmospheric effects of supersonic aircraft depend on the number of aircraft, the altitude of operation, the exhaust emissions, and the background chlorine and aerosol loadings. Projected fleets of supersonic transports would lead to significant changes in trace-species concentrations, especially in the North-Atlantic flight corridor. Two-dimensional model calculations of the impact of a projected fleet (500 aircraft, each emitting 15 grams of NOx per kilogram of fuel burned at Mach 2.4) in a stratosphere with a chlorine loading of 3.7 ppb, imply additional (i.e., beyond those from halocarbon losses) annual-average ozone column decreases of 0.3–1.8% for the Northern hemisphere. There are, however, important uncertainties in these model results, especially in the stratosphere below 25 km. The same models fail to reproduce the observed ozone trends in the stratosphere below 25 km between 1980 and 1990. Thus, these models may not be properly including mechanisms that are important in this crucial altitude range.
12.7.4 Photochemical Smog
Unhealthy concentrations of ozone due to photochemical production from nitrogen oxides are a daily occurrence for millions of people who live in large urban centers. This is especially true for inhabitants of large cities in the warmer climates, such as Los Angeles, Mexico City, Athens, and Beijing. For example, in the 1970s Los Angeles exceeded the US EPA O3 standard around 175–200 days per year (Lents and Kelly, 1993), however Los Angeles is now making progress. In the early 1990s, Los Angeles exceeded the O3 health standard on “only” 100–150 days per year and the peak concentrations also declined considerably. This change is a result of tightened vehicle emission standards, improved engine reliability and increased controls on non-vehicular sources, despite having more people driving nearly twice as many vehicle miles as in 1970. Nonetheless, there are serious concerns about whether cities such as Los Angeles can ever meet the existing ozone standard.
In 1997, the US Environmental Protection Agency tightened the O3 standard, changing it from 120 ppbv as a 1 h average, to 80 ppbv as an 8 h standard. This was done due to substantial new evidence that O3 health effects occur at this lower level. Since Los Angeles can not meet the current standard, it seems highly unlikely they will be able to meet this new standard. While for a long time Los Angeles could reasonably be called “the ozone capital of the world,” it is now probably being exceeded by rapidly developing cities in other countries. For example, both Mexico City and Beijing have serious O3 smog problems that probably exceed the problems in Los Angeles.
Ozone also causes significant damage to vegetation. In some regions where intensive industry and agriculture coexist, there is the possibility for substantial impacts on food production due to ozone. This is because ozone damage to crops can occur at mixing ratios as low as 60 ppbv and also due to the fact that the application of nitrogen fertilizers will increase local NO emissions (as described above). Thus to some extent there is a “self-limiting” effect from adding additional fertilizer in that the increased NO emissions will result in decreased crop yields due to ozone damage. Based on the photochemical model of Chameides et al. (1994), crop yields in regions of China are already being impacted by a few percent. This impact will continue and worsen as China continues to industrialize.
While the subject of photochemical ozone production has been extensively studied, there are still some remaining uncertainties. The essential reactions have already been presented in Section 12.5, and will only be briefly discussed here. In all high-temperature combustion processes, particularly power plants and automobiles, NO is produced by the direct reaction of N2 + O2, and from nitrogen-containing fuels. This NO can then be oxidized by a variety of mechanisms to NO2. In the presence of NOx and sunlight, the oxidation of CO, CH4, and other hydrocarbons results in ozone production. In an urban environment, the diurnal cycle of these trace species will generally exhibit a characteristic pattern of concentration maxima first in NO, then NO2, followed by O3 around midday (National Academy of Sciences, 1977). Evidence indicates that natural hydrocarbons along with anthropogenically produced NOx are important precursors to urban and rural ozone (Liu et al., 1987, 1988).
As seen in Table 12-2, global NOx production is dominated by anthropogenic sources. In an urban environment, virtually all NOx is from fossil fuel combustion.
12.7.5 Acid Rain
Acid precipitation, or acid rain, can causes significant impacts on freshwater, coastal, and forested ecosystems (e.g., Likens et al., 1996). Both NO3−, from NOx emissions, and SO42− from SO2 emissions contribute significantly to acid rain. The relative ratio of SO42−/NO3− in precipitation will be substantially determined by the regional emissions of SO2/NO3. In developed countries, uncontrolled combustion of coal and high-sulfur fuel oil led to significant emissions of SO2, relative to NOx. Due to strict control of smokestack SO2 emissions in some regions and increasing NOx emissions from automobiles, the relative contribution of NO3− is expected to increase (Sirois, 1993; Mayewski et al., 1990).
In remote ice cores, SO42− and NO3− concentrations have increased due to anthropogenic emissions (Mayewski et al., 1986, 1990). This is due to the fact the precursor compounds (e.g., NOx) are exported from the source regions. For example, Honrath and Jaffe (1992) found elevated concentrations of nitrogen oxides at Barrow, Alaska during spring, as compared to summer. This is largely due to decreased removal processes during winter for some nitrogen oxides, such as peroxyacetyl nitrate.
12.7.6 Species Diversity
Every day the planet loses forever a large number of plant and animal species. This current rate of extinction exceeds anything in the past history of life on Earth. Most of this loss is due to loss in habitat, especially in the tropics. However, some species are lost due to changes in the nutrient balance and resulting changes in the ecosystem structure. Vitousek et al. (1997b,c) documents losses of plant diversity in several regions due to wet and dry deposition of anthropogenic NO3−. This occurs because in regions with relatively high nitrogen deposition, a smaller number of species will flourish. According to Vitousek et al. (1997b) this reduced diversity makes the ecosystem less stable, as for example, during times of drought.
12.7.7 N Fertilization and the Global Carbon Cycle
Due to the fact that nitrogen is a limiting nutrient in many ecosystems, additions of fixed nitrogen can significantly increase plant growth. This is termed “nitrogen fertilization.” In regions where anthropogenic nitrogen is deposited two results are possible: reduced vegetative growth due to acid precipitation (see above) or increased growth due to nitrogen fertilization. Typically, the initial nitrogen deposition will stimulate growth; however, later, a plant can become “nitrogen saturated” and no longer respond to additional nitrogen inputs (Mellilo et al., 1989; Vitousek, 1997b,c). To the extent that nitrogen fertilization causes increased plant growth, this will result in increased uptake of atmospheric CO2 and increased global biomass.
One of the problems with understanding perturbations to the global carbon cycle has been the problem of the “missing sinks.” This describes the fact that the relatively well-known anthropogenic sources of CO2 significantly exceeded the annual atmospheric increase of CO2. Some of the anthropogenic emissions are being taken up by the oceans, but based on a number of quantitative models, it is unlikely that the oceans are adsorbing all of the missing sink (IPCC, 1995).
Based on a variety of evidence, a number of researchers have now concluded that terrestrial biomass must be taking up a significant fraction of the annual anthropogenic carbon emissions. For example Tans et al. (1990) used CO2 observations and a global model to calculate regional sources and sinks and concluded that a large carbon sink must be operative in the northern hemisphere. Schindler and Bayley (1993) used a biogeochemical approach to conclude that northern forests are storing an additional 1.0–2.3 Tg C/yr due to deposition of anthropogenic nitrogen. Hudson et al. (1994), using a global three-dimensional ocean-atmosphere-biosphere carbon model, reached a similar conclusion. Thus, it would appear that increased carbon uptake due to anthropogenic nitrogen fertilization is responsible for sequestering a large fraction of the 6 Tg of carbon emitted each year by human activities.
On the surface it would seem that global nitrogen fertilization is beneficial in that it reduces the concentration of CO2 in the atmosphere and thus its radiative forcing. However, it raises the question of how long global biomass can continue to respond in this way. Should the northern forests switch over from nitrogen fertilization to nitrogen saturation, or if other nutrients become limiting in these ecosystems, then the rate of rise of atmospheric CO2 would increase (assuming emissions remained the same). Overall, this uncertainty is an important limitation on our ability to predict future concentrations of atmospheric CO2.
12.7.8 The Future
Global population, fertilizer use, and fossil fuel combustion are all expected to continue to grow. Galloway et al. (1995) provided estimated N fluxes due to fertilizer production and fossil fuel combustion, by regions, for the present and the year 2020 (see Table 12-3). Based on these estimates, global fertilizer production will increase by more than 70% and fossil fuel emissions of NOx, will increase by 115%! As can be seen from Table 12-3, most of this increase is predicted to occur in the developing world as their large populations attempt to reach the living standard and lifestyles of the developed world.
Table 12-3
Current and estimated (for 2020) impacts on the global N cycle

(after Galloway et al., 1995)
Questions
12-1. How would the nitrogen cycle change if life on Earth were suddenly absent? What would be the time scale for these changes?
12-2. If, as a result of anthropogenic activities, nitrogen is being removed from the atmospheric reservoir (as N2) to the oceanic reservoir (as NO3−), how long would it take to detect this change? Is this a thermodynamically favorable process?
12-3. How have agriculture and deforestation changed the global rates of nitrogen fixation and denitrification? How can increased agricultural productivity be sustained without using industrially produced fertilizers?
12-4. Discuss the importance of atmospheric N2O. Why is it important to know something about its natural and anthropogenic sinks? What role might atmospheric N2O play in the control of planetary climate? (See e.g., Lovelock, 1979.)
12-5. Describe the trends in the ozone concentrations in the troposphere and stratosphere, and the total ozone column. What roles do nitrogen oxides play in these changes?
12-6. What are the key reactions that result in the formation of photochemical smog? How do increases in NOx emissions lead to lower peak ozone concentrations in some areas? Would you advocate the lowering of NOx emission standards in some areas? What strategies would you suggest for cities in developing countries to avoid becoming like Los Angeles?
12-7. Knowing that the average precipitation on Earth is approximately 1 m per year, calculate the global mean concentration of NO3− in rainwater assuming that 50% of all NOx is removed in wet deposition as HNO3. Assuming this were the only source of acidity, what would the pH be for this rainwater? Now redo this calculation using the NOx emissions for 2020.
12-8. From the data in Fig. 12-4 and Table 12-3, calculate the lifetime for atmospheric N2O. Would you expect the atmospheric N2O growth rate (Fig. 12-9) to remain about the same, greater or slower in the year 2020 as compared to today? Explain.
12-9. Assuming the current emissions and sinks remain about the same, estimate the global atmospheric CO2 mixing ratio in the year 2050. Now repeat this calculation, but this time assume that the terrestrial biosphere no longer continues to sequester some of this anthropogenic carbon.
Bremner, J. M., Blackmer, A. M. Terrestrial nitrification as a source of atmospheric nitrous oxide. In: Delwiche C. C., ed. Denitrification, Nitrification, and Atmospheric Nitrous Oxide. Washington, DC: Wiley, 1981.
Burns, R. C., Hardy, R. W. F. Nitrogen Fixation in Bacteria and Higher Plants. New York: Springer-Verlag; 1975.
Chameides, W. L., Kasibhatla, P. S., Yienger, J., Levy, H., II. Growth of Continental-Scale Metro-Agro-Plexes, Regional Ozone Pollution, and World Food Production. Science. 1994; 264:74–77.
NATO ASI Series C. Crutzen, P. J., Tropospheric ozone: an overviewIsaksen, I. S. A., eds. Tropospheric Ozone-Regional and Global Scale Interactions, Vol. 227. New York: D. Reidel Publ. Co., 1988.
Crutzen, P. J., Gidel, L. T. A 2-dimensional photochemical model of the atmosphere 2. the tropospheric budgets of the anthropogenic chlorocarbons CO, CH4, CH3Cl and the effects of various NOx sources on tropospheric O3. J. Geophys. Res. 1983; 88:6641–6661.
Delwiche, C. C. The nitrogen cycle and nitrous oxide. In: Delwiche C. C., ed. Denitrification, Nitrification, and Atmospheric Nitrous Oxide. Boston, MA: Wiley, 1981.
Emmons, L. K., et al. Climatologies of NOx and NOy: A comparison of data and models. Atmos. Env. 1997; 31:1851–1904.
Farman, J. C., Gardiner, B. G., Shanklin, J. D. Large losses of total ozone in Antarctica reveal seasonal ClOx/NOx interaction. Nature. 1985; 315:207–210.
Finlayson-Pitts, B., Pitts, J. Atmospheric Chemistry—Fundamentals and Experimental Techniques. New York: Wiley; 1986.
Freney, J. R., Simpson, J. R., Denmead, O. T. Volatilization of ammonia. In: Freney J. R., Simpson J. R., eds. Gaseous Loss of Nitrogen from Plant-Soil Systems. New York: Martinus Nijhoff, Dr. W. Junk Publishers, 1983.
Galloway, J. N., et al. Nitrogen fixation: Anthropogenic enhancement — environmental response. Global Biogeochem. Cycles. 1995; 9:235–252.
Dahlem Konferenzen Garrels, R. M. Introduction: chemistry of the troposphere — some problems and their temporal frameworks. In: Goldberg E. D., ed. Atmospheric Chemistry. Boston: Springer-Verlag; 1982:3–16.
Granhall, U., Biological nitrogen fixation in relation to environmental factors and functioning of natural ecosystemsClark F. E., Rosswall T., eds. Terrestrial Nitrogen Cycle. Ecological Bulletin; 33. Swedish Natural Science Research Council, New York, 1981. 131–145.
Hoell, J. M., Harward, C. N., Williams, B. S. Remote infrared heterodyne radiometer measurements of atmospheric ammonia profiles. Geophys. Res. Lett. 1980; 7:325–328.
Holland, H. D. The Chemistry of the Atmosphere and Oceans. Stockholm: Wiley; 1978.
Honrath, R. E., Jaffe, D. A. The seasonal cycle of nitrogen oxides in the arctic troposphere at Barrow, Alaska. J. Geophys. Res. 1992; 97:20 615–20 630.
Hudson, R. J. M., et al. Modeling the global carbon cycle: Nitrogen fertilization of the terrestrial biosphere and the “missing” CO2 sink. Global Biogeochem. Cycles. 1994; 8:307–333.
Intergovernmental Panel on Climate Change (IPCC), Climate Change 1995: The Science of Climate Change. Houghton, J. T. Meira Filho, L. G. Callender, B. A. Harris, N. Kattenberg, A. Maskell, K. . Cambridge University Press, New York, 1996.
Chapter 4 Intergovernmental Panel on Climate Change (IPCC). IPCC Guidelines for National Greenhouse Gas Inventories. Cambridge: OECD; 1997.
Jaffe, D. A. The nitrogen cycle in global biogeochemical cycles. In: Butcher S. S., Charlson R. J., Orians G. H., Wolfe G. V., eds. Global Biogeochemical Cycles. Paris, France: Academic Press, 1992.
Jaffe, D. A., Berntsen, T., Isaksen, I. S. A. A global 3D chemical transport model; 2. Nitrogen oxides and non methane hydrocarbon results. J. Geophys. Res. 1997; 102:21 281–21 296.
Kato, N., Akimoto, H. Anthropogenic emissions of SO2 and NOx in Asia: Emission inventories. Atmos. Environ. 1992; 26A:2997–3017.
Kikby, E. A., Plant growth in relation to nitrogen supplyClark F. E., Rosswall T., eds. Terrestrial Nitrogen Cycles. Ecological Bulletin; 33. Swedish Natural Science Research Council, New York, 1981. 249–271.
Lawson, D. R. The nitrogen species methods comparison study: An overview. Atmos. Environ. 1988; 22:1517.
Oct. Lents, M., Kelly, W. J. Clearing the air in Los Angeles. Scient. Am. 1993; * 32–39.
Likens, G. E., Driscoll, C. T., Buso, D. C. Long-term effects of acid rain: response and recovery of a forest ecosystem. Science. 1996; 272:244–246.
Liu, S. C., Trainer, M., Fehsenfeld, F. C., Parrish, D. D., Williams, E. J., Fahey, D. W., Hubler, G., Murphy, P. C. Ozone production in the rural troposphere and the implications for regional and global ozone distributions. J. Geophys. Res. 1987; 92:4191–4207.
Liu, X., Trainer, M., Liu, S. C. On the non-linearity of the tropospheric ozone production. J. Geophys. Res. 1988; 93:15 879–15 888.
Logan, J. A. Trends in the vertical distribution of ozone: An analysis of ozonesonde data. J. Geophys. Res. 1994; 99:25 553–25 585.
Logan, J. A. Tropospheric ozone: seasonal behavior, trends, and anthropogenic influences. J. Geophys. Res. 1985; 90:10 463–10 482.
Logan, J., Prather, M. J., Wofsy, S. C., McElroy, M. B. Tropospheric chemistry: a global perspective. J. Geophys. Res. 1981; 86:7210–7254.
Lovelock, J. Gaia: a New Look at Life on Earth. Stockholm: Oxford University Press; 1979.
Marenco, A., Gouget, H., Nedelec, P., Pages, J. -P., Karcher, F. Evidence of a long-term trend in tropospheric ozone from Pic du Midi data series: consequences: positive radiative forcing. J. Geophys. Res. 1994; 99:16 617–16 632.
Matson, P. A., et al. Integration of environmental, agronomic and economic aspects of fertilizer management. Science. 1998; 280:112–114.
Mayewski, P. A., et al. An ice-core record of atmospheric response to anthropogenic sulfate and nitrate. Nature. 1990; 346:554–556.
Mayewski, P. A., Lyons, W. B., Spencer, M. J., Twickler, M., Dansgaard, W., Koci, B., Davidson, C. I., Honrath, R. E. Sulfate and nitrate concentrations from a South Greenland ice core. Science. 1986; 232:975–977.
McElroy, M. B., Elkins, J. W., Wolfsy, S. C., Yung, Y. L. Sources and sinks for atmospheric N2O. Rev. Geo. Space Phys. 1976; 14(2):143–150.
Mellilo, J. M., Steudler, P. A., Aber, J. D., Bowden, R. D. Atmospheric deposition and nutrient cycling. In: Andreae M. O., Schimel D. S., eds. Dahlem Workshop on Exchange of Trace Gases Between Terrestrial Ecosystems and the Atmosphere. New York: Wiley Interscience Publishers, 1989.
National Academy of Sciences. Nitrogen Oxides. New York: National Academy of Sciences; 1977.
No. 15 NOAA, US Dept. of Commerce. Geophysical Monitoring for Climatic Change. Boulder, CO. Summary Report 1986. 1987; * 85–90.
Postgate, J. R. Biological nitrogen fixation: fundamentals. In: Stewart W. D. P., Rosswall T., eds. The Nitrogen Cycle. Washington, DC: The Royal Society; 1982:73–83.
Quinn, P. K., Charlson, R. J., Bates, T. S. Simultaneous observations of ammonia in the atmosphere and ocean. Nature. 1988; 335:336–338.
Rolston, D. E. Nitrous oxide and nitrogen gas production in fertilizer loss. In: Delwiche C. C., ed. Denitrification, Nitrification, and Atmospheric Nitrous Oxide. London: Wiley; 1981:127–149.
Rosswall, T., The internal nitrogen cycle between microorganisms, vegetation, and soilSvensson B. H., Söderlund R., eds. Nitrogen, Phosphorus and Sulfur — Global Cycles. Ecol. Bull. No. 22. SCOPE. Swedish Natural Science Research Council, New York, 1976. 157–167.
Schindler, D. W., Bayley, S. E. The biosphere as an increasing sink for atmospheric carbon: Estimates from increased nitrogen deposition. Global Biogeochem. Cycles. 1993; 7:717–733.
Sirois, A. Temporal variations in sulphate and nitrate concentrations in precipitation in eastern North America: 1979–1990. Atmos. Env. 1993; 27A:945–963.
July Smil, V. Global Population and the Nitrogen Cycle. Scient. Am. 1997; * 76–81.
Söderlund, R., Svensson, B. H., The global nitrogen cycleSvensson B. H., Söderlund R., eds. Nitrogen, Phosphorus and Sulfur — Global Cycles. Ecol. Bull. No. 22. SCOPE. Swedish Natural Science Research Council, Stockholm, 1976. 23–73.
Solomon, S., Schoeberl, M. R. Overview of the polar ozone issue. Geophys. Res. Lett. 1988; 15:845–846.
Stedman, D. H., Shetter, R. E. The global budget of atmospheric nitrogen species. In: Schwartz S. E., ed. Trace Atmospheric Constituents. Stockholm: Wiley, 1983.
Tans, P. P., Fung, I. Y., Takahashi, T. Observational constraints on the global atmospheric CO2 budget. Science. 1990; 247:1431–1438.
Toon, O., Turco, R. Polar stratospheric clouds and ozone depletion. Scient. Am. 1991; 264:68.
Turner, R. E., Rabalais, N. N. Changes in Mississippi River water quality this century. BioScience. 1991; 41:140–147.
Vitousek, P. M., et al. Human domination of the earth’s ecosystems. Science. 1997; 277:494–499.
Vitousek, P. M., et al. Human alteration of the global nitrogen cycle: Sources and consequences. Ecol. Apps. 1997; 7:737–750.
Also available on the web at http://www. sdsc. edu/∼ESA/. Vitousek, P. M., et al, Human alteration of the global nitrogen cycle: Causes and consequences. Issues in Ecology; Vol. 1. Ecol. Soc. America, New York, 1997.
Volz, A., Kley, D. Evaluation of the Montsouris series of ozone measurements made in the nineteenth century. Nature. 1988; 332:240–242.
Weiss, R. F. The temporal and spatial distribution of tropospheric nitrous oxide. J. Geophys. Res. 1981; 86:7185–7195.
Wennberg, P. O., et al. Removal of stratospheric O3 by radicals: In-situ measurements of OH, HO2, NO, NO2, ClO and BrO. Science. 1994; 266:398–404.
World Meteorological Organization (WMO), Scientific Assessment of Ozone Depletion: 1994. Report No. 37. WMO Global Ozone Research and Monitoring Project, Washington, DC, 1995.
