We’ve already done some work with simple two-dimensional (2D) graphs. In this chapter, we’ll take a closer look at the two most common coordinate systems on which 2D graphs are plotted. They are the Cartesian plane (named after the French mathematician René Descartes who invented it in the 1600s) and the polar coordinate plane.
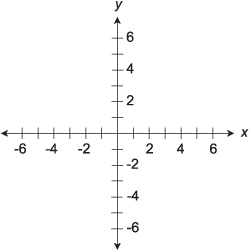
The Cartesian plane, also called the rectangular coordinate plane or rectangular coordinates, is defined by two number lines that intersect at a right angle. Figure 11-1 illustrates a basic set of rectangular coordinates. Both number lines have equal increments. This means that on either axis, points corresponding to consecutive integers are the same distance apart, no matter where on the axis we look. The two number lines intersect at their zero points. The horizontal (right-and-left) axis is the x axis; the vertical (up-and-down) axis is the y axis.
Fig. 11-1. The Cartesian plane is defined by two number lines that intersect at right angles.
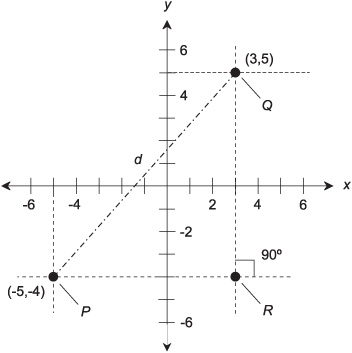
Fig. 11-2. Two points P and Q, plotted in rectangular coordinates, and a third point R, important in finding the distance d between P and Q.
Figure 11-2 shows two specific points P and Q on the Cartesian plane. Any given point on the plane can be denoted as an ordered pair in the form (x,y), determined by the numerical values at which perpendiculars from the point intersect the x and y axes. The coordinates of point P are (-5,-4), and the coordinates of point Q are (3,5). In Fig. 11-2, the perpendiculars are shown as horizontal and vertical dashed lines. When denoting an ordered pair, it is customary to place the two numbers or variables together right up against the comma; there is no space after the comma.
The word “ordered” means that the order in which the numbers are listed is important. The ordered pair (7,2) is not the same as the ordered pair (2,7), even though both pairs contain the same two numbers. In this respect, ordered pairs are different than mere sets of numbers. Think of a two-lane highway with a northbound lane and a southbound lane. If there is never any traffic on the highway, it doesn’t matter which lane (the one on the eastern side or the one on the western side) is called “northbound” and which is called “southbound.” But when there are vehicles on that road, it makes a big difference! The untraveled road is like a set; the traveled road is like an ordered pair.
In any graphing scheme, there is at least one independent variable and at least one dependent variable. You learned about these types of variables in Chapter 2. The independent-variable coordinate (usually x) of a point on the Cartesian plane is called the abscissa, and the dependent-variable coordinate (usually y ) is called the ordinate. The point where the two axes intersect, in this case (0,0), is called the origin. In the scenario shown by Fig. 11-2, point P has an abscissa of -5 and an ordinate of -4, and point Q has an abscissa of 3 and an ordinate of 5.
Suppose there are two different points P = (x0,y0) and Q = (x1,y1) on the Cartesian plane. The distance d between these two points can be found by determining the length of the hypotenuse, or longest side, of a right triangle PQR, where point R is the intersection of a “horizontal” line through P and a “vertical” line through Q. In this case, “horizontal” means “parallel to the x axis,” and “vertical” means “parallel to the y axis.” An example is shown in Fig. 11-2. Alternatively, we can use a “horizontal” line through Q and a “vertical” line through P to get the point R. The resulting right triangle in this case has the same hypotenuse, line segment PQ, as the triangle determined the other way.
The Pythagorean theorem from plane geometry states that the square of the length of the hypotenuse of a right triangle is equal to the sum of the squares of the other two sides. In the Cartesian plane, that means the following equation always holds true:
d2 = (x1 − x0)2 + (y1 − y0)2
and therefore:
d = [(x1 − x0)2 + (y1 − y0)2]½
where the 1/2 power is the square root. In the situation shown in Fig. 11-2, the distance d between points P = (x0,y0) = (-5,-4) and Q = (x1,y1) = (3,5), rounded to two decimal places is:
d = {[3-(-5)]2+[5-(-4)]2}½
= [(3+5)2+(5+4)2]½
= (82+ 92)½
= (64+81)½
= 145½
= 12.04
Plot the following points on the Cartesian plane: (-2,3), (3,-1), (0,5), and (-3,-3).
These points are shown in Fig. 11-3. The dashed lines are perpendiculars, dropped to the axes to show the x and y coordinates of each point. (The dashed lines are not part of the coordinates themselves.)
What is the distance between (0,5) and (-3,-3) in Fig. 11-3? Express the answer to three decimal places.
Use the distance formula. Let (x0,y0) = (0,5) and (x1,y1) = (-3,-3). Then:
d = [(x1 - x0)2 + (y1 - y0)2]1/2
= [(-3-0)2+(-3-5)2]½
= [(-3)2+(-8)2]½
= (9+64)½
= 73½
= 8.544
Fig. 11-3. Illustration for Problems 11-1 and 11-2.
In Chapter 6, we saw what the graphs of quadratic equations look like in the Cartesian plane; they appear as parabolas. Here, we’ll take a detailed look at how straight lines are plotted on the basis of linear equations in two variables. The standard form for this type of equation is as follows:
ax + by + c = 0
where a, b, and c are real-number constants, and the variables are x and y.
A linear equation in variables x and y can be manipulated so it is in a form that is easy to plot on the Cartesian plane. Here is how a two-variable linear equation in standard form can be converted to slope-intercept form:
ax+ by+ c = 0
ax + by = − c
by = −ax − c
y = (−a/b)x − c/b
y = (—a/b)x + (—c/b)
where a, b, and c are real-number constants (the coefficients of the equation), and b — 0. The quantity -a/b is called the slope of the line, an indicator of how steeply and in what sense the line slants. The quantity -c/b represents the y value of the point at which the line crosses the y axis; this is called the y-intercept.
Let dx represent an arbitrarily small change in the value of x on such a graph. Let dy represent the tiny change in the value of y that results from this tiny change in x. The limit of the ratio dy/dx, as both dx and dy approach 0, is the slope of the line.
Suppose m is the slope of a line in Cartesian coordinates, and k is the y-intercept. The linear equation of that line can be written in slope-intercept form as:
y = (−a/b)x + (−c/b)
and therefore:
y = mx + k
To plot a graph of a linear equation in Cartesian coordinates using the slope-intercept form, proceed as follows:
• Convert the equation to slope-intercept form.
• Plot the point x = 0, y = k.
• Move to the right by n units on the graph.
• If m is positive, move upward mn units.
• If m is negative, move downward |m|n units, where m is the absolute value of m.
• If m = 0, don’t move up or down at all.
• Plot the resulting point x = n, y = mn + k.
• Connect the two points with a straight line.
Figures 11-4A and B illustrate the following linear equations as graphed in slope-intercept form:
y = 5x − 3
y = x +2
A positive slope indicates that the line ramps upward as you move from left to right, and a negative slope indicates that the line ramps downward as you move from left to right. A slope of 0 indicates a horizontal line. The slope of a vertical line is undefined because, in the form shown here, it requires that m be defined as a quotient in which the denominator is equal to 0.
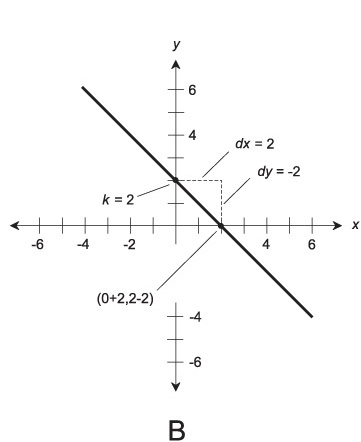
Fig. 11-4. (A) Graph of the linear equation y = 5x − 3. (B) Graph of the linear equation y = -x +2.
It is difficult to plot a graph of a line based on the y-intercept (the point at which the line intersects the y axis) when the part of the graph of interest is far from the y axis. In this sort of situation, the point-slope form of a linear equation can be used. This form is based on the slope m of the line and the coordinates of a known point (x0,, y0)):
y − y0= m(x−x0)
To plot a graph of a linear equation using the point-slope method, follow these steps in order:
• Convert the equation to point-slope form.
• Determine a point (x0, y0) by “plugging in” values.
• Plot (x0, y0) on the coordinate plane.
• Move to the right by n units on the graph, where n is some number that represents a reasonable distance on the graph.
• If m is positive, move upward mn units.
• If m is negative, move downward |m|n units, where |m is the absolute value of m.
• If m = 0, don’t move up or down at all.
• Plot the resulting point (x 1, y 1).
• Connect the points (x0, y0) and (x 1, y 1) with a straight line.
Figure 11-5A illustrates the following linear equation as graphed in point-slope form:
y − 104 = 3(x − 72)
Figure 11-5B is a graph of another linear equation in point-slope form:
y +55 = − 2(x + 85)
Suppose we are working in the Cartesian plane, and we know the exact coordinates of two points P and Q. These two points define a unique and distinct straight line. Call the line L. Let’s give the coordinates of the points these names:
P = (xp, yp)
Q = (xq, yq)
Fig. 11-5. (A) Graph of the linear equation y — 104 — 3(x — 72). (B) Graph of the linear equation y +55 = -2(x +85).
The slope m of line L can be found using either of the following formulas:
m = (yq − yp) / (xq − xp)
m = (yp − yq) / (xp − xq)
These formulas work provided xp is not equal to xq. (If xp — xq), the denominators are equal to 0.) The point-slope equation of the line L can be determined based on the known coordinates of P or Q. Therefore, either of the following formulas represent the line L:
y − yp = m(x − xp
y − yq = m(x − xq
Reduced to standard form, these equations become:
mx − y + (yp−mxp)=0
mx − y + (yq−mxq)=0
That is, the coefficients a, b, and c are:
a = m
b =-1
c = yp − mxp = yq − mxq
Suppose we are shown, on a graph, the coordinates of the point at which a straight line L crosses the y axis, and also the slope of that line. This information is sufficient to uniquely define the equation of L. Let’s say that the y-intercept is equal to y0 and the slope of the line is equal to m. Then the equation of the line is:
y − y0 = mx
Reduced to standard form, this becomes:
mx − y + y0 = 0
That is, the coefficients a, b, and c are:
a = m
b = -1
c = y0
Suppose you are shown Fig. 11-6. What is the equation of this line in standard form?
The slope of the line is equal to 2; we are told this in the graph. Therefore, m = 2. The y-intercept is 4, so y0 = 4. This means the equation of the line is:
2x − y +4 = 0
Fig. 11-6. Illustration for Problem 11-3.
Two versions of the polar coordinate plane are shown in Figs. 11-7 and 11-8. The independent variable is plotted as an angle θ (THAY-tuh) relative to a reference axis pointing to the right (or “east”), and the dependent variable is plotted as a distance (called the radius) r from the origin. (The origin is the center of the graph where r = 0.) A coordinate point is thus denoted in the form of an ordered pair (θ, r). In some texts, the independent and dependent variables are reversed, and the resulting ordered pairs are in the form (r, θ). But intuitively, it makes more sense to most people to plot the radius as a function of the angle, and not to plot the angle as a function of the radius. Here, we’ll use the form (θ, r).
In any polar plane, the radii are shown by concentric circles. The larger the circle, the greater the value of r. In Figs. 11-7 and 11-8, the circles are not labeled in units. You can do that for yourself. Imagine each concentric circle, working outward, as increasing by any number of units you want. For example, each radial division might represent one unit, or five units, or 10, or 100.
In polar coordinates, the direction can be expressed in angular degrees (symbolized °, where a full circle represents 360°) or in units called radians.
Fig. 11-7. The polar coordinate plane. The angle θ is in degrees, and the radius r is in uniform increments.
What is a radian, you ask? Imagine two rays emanating outward from the center point of a circle. The rays each intersect the circle at a point. Call these points P and Q. Suppose the distance between P and Q, as measured along the arc of the circle, is equal to the radius of the circle. Then the measure of the angle between the rays is one radian (1 rad). There are 2π rad in a full circle, where π (the lowercase, non-italic Greek letter pi, pronounced “PIE”) stands for the ratio of a circle’s circumference to its diameter. This is a constant, and it happens to be an irrational number. The value of π is approximately 3.14159265359, often rounded off to 3.14159 or 3.14.
The direction in a polar coordinate system is usually defined counterclockwise from a reference axis pointing to the right or “east.” In Fig. 11-7, the direction θ is in degrees. Figure 11-8 shows the same polar plane, using radians to express the direction. (The “rad” abbreviation is not used, because it is obvious from the fact that the angles are multiples of π.) Regardless of whether degrees or radians are used, the angle on the graph is directly proportional to the value of θ.
In polar coordinates, it is all right to have a negative radius. If some point is specified with r<0, we multiply r by -1 so it becomes positive, and then add or subtract 180° (π rad) to or from the direction. That’s like saying, “Go 3 kilometers (km) southeast” instead of “Go -3 km northwest.” Negative
Fig. 11-8. Another form of the polar coordinate plane. The angle θ is in radians, and the radius r is in uniform increments.
radii must be allowed in order to graph figures that represent functions whose ranges can attain negative values.
It’s okay to have nonstandard direction angles in polar coordinates. If the value of θ is 360° (2π rad) or more, it represents more than one complete counterclockwise revolution from the 0° (0 rad) reference axis. If the direction angle is less than 0° (0 rad), it represents clockwise revolution instead of counterclockwise revolution. Nonstandard direction angles must be allowed in order to graph figures that represent functions whose domains go outside the standard angle range.
Provide an example of a graphical object that can be represented as a function in polar coordinates, but not in Cartesian coordinates.
Recall the definitions of the terms relation and function. When we talk about a function f, we can say that r = f(θ). A simple function of θ in polar coordinates is a constant function such as this:
f(θ) = 3
Because f(θ) is just another way of denoting r, the radius, this function tells us that r = 3. This is a circle with a radius of 3 units.
In Cartesian coordinates, the equation of the circle with radius of 3 units is more complicated. It looks like this:
x2 + y2 = 9
(Note that 9 = 32, the square of the radius.) If we let y be the dependent variable and x be the independent variable, we can rearrange the equation of the circle to get:
y = ±(9 - x2)½
If we say that y — g(x) where g is a function of x in this case, we are mistaken. There are values of x (the independent variable) that produce two values of y (the dependent variable). For example, when x— 0, y— ± 3. If we want to say that g is a relation, that’s fine, but we cannot call it a function.
In order to get a good idea of how the polar coordinate system works, let’s look at the graphs of some familiar objects. Circles, ellipses, spirals, and other figures whose equations are complicated in Cartesian coordinates can often be expressed simply in polar coordinates. In general, the polar direction θ is expressed in radians. In the examples that follow, the “rad” abbreviation is eliminated, because it is understood that all angles are in radians.
The equation of a circle centered at the origin in the polar plane is given by the following formula:
r = a
where a is a real-number constant greater than 0. This is illustrated in Fig. 11-9.
The general form for the equation of a circle passing through the origin and centered at the point (θ0, r0 ) in the polar plane (Fig. 11-10) is as follows:
r = 2r0 cos (θ − θ0)
Fig. 11-9. Polar graph of a circle centered at the origin
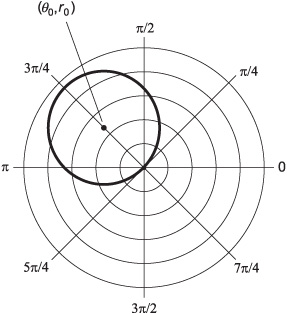
Fig. 11-10. Polar graph of a circle passing through the origin.
The equation of an ellipse centered at the origin in the polar plane is given by the following formula:
r = ab/(a2 sin2 θ + b2 cos2 θ)½
where a and b are real-number constants greater than 0.
Fig. 11-11. Polar graph of an ellipse centered at the origin.
Here, “sin” represents the sine function and “cos” represents the cosine function, both of which are available on any good scientific calculator. The exponent 2 attached to these functions indicates that after the sine or cosine has been found, the result should be squared.
In the ellipse, a represents the distance from the origin to the curve as measured along the “horizontal” ray θ = 0, and b represents the distance from the origin to the curve as measured along the “vertical” ray θ — π/2. This is illustrated in Fig. 11-11. The values a and b represent the lengths of the semi-axes of the ellipse; the greater value is the length of the major semi-axis, and the lesser value is the length of the minor semi-axis.
The general form of the equation of a hyperbola centered at the origin in the polar plane is given by the following formula:
r = ab/(b2cos2 θ - a2 sin2 θ)½
where a and b are real-number constants greater than 0.
Note how similar this is to the equation of the ellipse. But when we look at Fig. 11-12, which shows a hyperbola, it becomes apparent that the substitution of the minus sign for the plus sign in this equation makes a big difference!
Let D represent a rectangle whose center is at the origin, whose vertical edges are tangent to the hyperbola, and whose vertices (corners) lie on the
Fig. 11-12. Polar graph of a hyperbola centered at the origin.
asymptotes of the hyperbola (the long, straight, dashed lines in Fig. 11-12). Let a represent the distance from the origin to D as measured along the “horizontal” ray θ — 0, and let b represent the distance from the origin to D as measured along the “vertical” ray θ — π/2. The values a and b represent the lengths of the semi-axes of the hyperbola; the greater value is the length of the major semi-axis, and the lesser value is the length of the minor semi-axis.
The general form of the equation of a lemniscate centered at the origin in the polar plane is given by the following formula:
r = a(cos 2θ)½
where a is a real-number constant greater than 0. This is illustrated in Fig. 11-13.
The general form of the equation of a three-leafed rose centered at the origin in the polar plane is given by either of the following two formulas:
r = a cos 3θ
r = a sin 3θ
Fig. 11-13. Polar graph of a lemniscate centered at the origin.
where a is a real-number constant greater than 0. The cosine version of the curve is illustrated in Fig. 11-14A. The sine version is illustrated in Fig. 11-14B.
The general form of the equation of a four-leafed rose centered at the origin in the polar plane is given by either of the following two formulas:
r = a cos 2θ
r = a sin 2θ
where a is a real-number constant greater than 0. The cosine version is illustrated in Fig. 11-15A. The sine version is illustrated in Fig. 11-15B.
The general form of the equation of a spiral centered at the origin in the polar plane is given by the following formula:
r = aθ
where a is a real-number constant greater than 0. An example of this type of spiral, called the spiral of Archimedes because of the uniform manner in which its radius increases as the angle increases, is illustrated in Fig. 11-16.
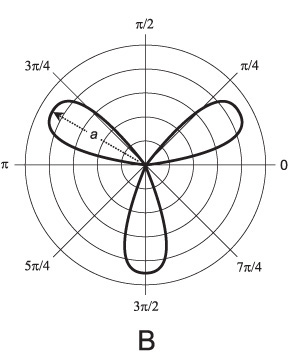
Fig. 11-14. (A) Polar graph of a three-leafed rose with equation r = a cos 3θ. (B) Polar graph of a three-leafed rose with equation r = a sin 3θ.
The general form of the equation of a cardioid centered at the origin in the polar plane is given by the following formula:
r = 2a(1 + cos θ)
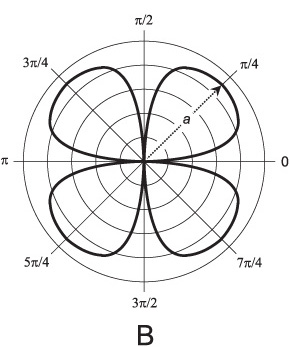
Fig. 11-15. (A) Polar graph of a four-leafed rose with equation r = a cos 2θ. (B) Polar graph of a four-leafed rose with equation r = a sin 2θ.
where a is a real-number constant greater than 0. An example of this type of curve is illustrated in Fig. 11-17.
What is the value of the constant, a, in the spiral shown in Fig. 11-16? What is the equation of this spiral? Assume that each radial division represents 1 unit.
Fig. 11-16. Polar graph of a spiral; illustration for Problem 11-5.
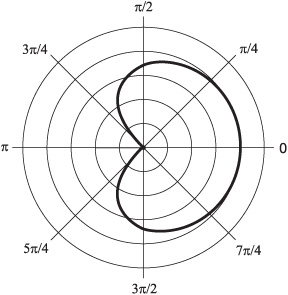
Fig. 11-17. Polar graph of a cardioid; illustration for Problem 11-6.
Note that if θ = π, then r = 2. Therefore, we can solve for a by substituting this number pair in the general equation for the spiral. We know that (θ, r) = (π, 2). Thus 2 = aπ. Solving for the constant, a, gives us a = 2/π. The equation of the spiral is:
r = (2/π)θ
or, rearranged to get rid of the need for parentheses:
r = 2θ/π
What is the value of the constant, a, in the cardioid shown in Fig. 11-17? What is the equation of this cardioid? Assume that each radial division represents 1 unit.
Note that if θ = 0, then r = 4. We can solve for a by substituting this number pair in the general equation for the cardioid. We know that (θ, r) = (0, 4). Proceed like this:
r = 2a(1+cosθ)
4 = 2a(1+cos0)
4 = 2a(1+1)
4 = 4a
a = 1
This means that the equation of the cardioid is:
r = 2(1 + cos θ)
or, rearranged to get rid of the need for parentheses:
r = 2 + 2 cos θ
Refer to the text in this chapter if necessary. A good score is eight correct. Answers are in the back of the book.
1. What is the distance between the points (3,4) and (-3,4) in Cartesian coordinates?
(a) 10
(b) 8
(c) 6
(d) 5
2. Suppose a straight line in Cartesian coordinates is represented by the following equation:
3x - 6y+ 2 = 0
What is the slope of this line?
(a) 2
(b) 3/2
(c) 2/3
(d) 1/2
3. What is the distance between the origin and the point (8, 8) in Cartesian coordinates?
(a) 16
(b) 8
(c) 128½
(d) 8½
4. Suppose the equation of a line in Cartesian coordinates is specified as:
y − 3 = 7(x+2)
From this equation, we know that the line passes through the point
(a) (2,0)
(b) (0, -3)
(c) (2, 3)
(d) none of the above
5. What does the graph of θ = 0 look like in polar coordinates?
(a) A point.
(b) A straight line.
(c) A spiral.
(d) A circle.
6. The term ordinate in Cartesian coordinates refers to
(a) the direction
(b) the value of the dependent variable
(c) the value of the independent variable
(d) the angle
7. A radian is equivalent to approximately
(a) 114.6°
(b) 90°
(c) 57.3°
(d) 28.7°
8. The direction of a point, relative to the origin, in conventional polar coordinates is expressed as an angle going
(a) counterclockwise from the axis running from the origin upwards
(b) counterclockwise from the axis running from the origin towards the left
(c) counterclockwise from the axis running from the origin downwards
(d) counterclockwise from the axis running from the origin towards the right
9. What is the distance between the origin and (r,θ) = (4, 135°) in polar coordinates?
(a) 0
(b) 4
(c) 3π/4
(d) It is impossible to determine this without more information.
10. A straight line has a slope of -3 in Cartesian coordinates, and runs through the point (0,2). The equation of this line is
(a) y = -3x + 2
(b) y = 2x - 3
(c) y — 3 = x + 2
(d) impossible to determine without more information