The preceding section leverages Driver Verifier to create crashes that the debugger’s automated analysis engine can resolve. You might still encounter cases where you cannot get a system to produce easily analyzable crashes, and, if so, you will need to execute manual analysis to try to determine what the problem is. Here are some examples of basic commands that can provide clues during crash analysis. The Debugging Tools for Windows help file provides complete documentation on these and other commands as well as examples of how to use them during crash analysis:
Use the !cpuinfo command to display a list of processors the system is configured to use.
Use the processor ID with the k command to display the stack trace of each processor in the system—for example, 1k . Be sure you recognize each of the modules listed in the stack trace and that you have the most recent versions.
Use the !thread command to display information about the current thread on each processor. The ~s command can be used with the processor ID to change the current processor (such as ~1s ). Look for any pending I/O request packets (explained in the next section).
Use the .time command to display information about the system time, including when the system crashed and for how long it had been running. A short uptime value can indicate frequent problems.
Use the lm command with the k t option (the t flag specifies to display time stamp information—that is, when the file was compiled, not what appears on the file system, which might differ) to list the loaded kernel-mode drivers. Be sure you understand the purpose of any third-party drivers and that you have the most recent versions.
Use the !vm command to see whether the system has exhausted virtual memory, paged pool, or nonpaged pool. If virtual memory is exhausted, the committed pages will be close to the commit limit, so try to identify a potential memory leak by examining the list of processes to see which one reports high commit usage. If nonpaged pool or paged pool is exhausted (that is, the usage is close to the maximum), see the EXPERIMENT: Troubleshooting a Pool Leak experiment in Chapter 10.
Use the !process 0 0 debugger command to look at the processes running, and be sure that you understand the purpose of each one. Try disabling or uninstalling unnecessary applications and services.
There are other debugging commands that can prove useful, but more advanced knowledge is required to apply them. The !irp command is one of them. The next section shows the use of this command to identify a suspect driver.
Stack overruns or stack trashing typically results from a buffer overrun or underrun or when a driver passes a buffer address located on the stack to a lower driver on the device stack, which then performs the work asynchronously.
In the case of a stack overrun or underrun, instead of residing in pool, as you saw with Notmyfault’s buffer overrun bug, the target buffer is on the stack of the thread that executes the bug. This type of bug is another one that’s difficult to debug because the stack is the foundation for any crash dump analysis.
In the case of passing buffers on the stack to lower drivers, if the lower driver returns to the caller immediately because it used a completion routine to perform the work, instead of returning synchronously, when the completion routine is called, it will use the stack address that was passed previously, which could now correspond to a different state on the caller’s stack and result in corruption.
When you run Notmyfault and select Stack Trash, the Myfault driver overruns a buffer it allocates on the kernel stack of the thread that executes it. When Myfault tries to return control to the Ntoskrnl function that was invoked, it reads the return address, which is the address at which it should continue executing, from the stack. The address was corrupted by the stack-buffer overrun, so the thread continues execution at some different address in memory—an address that might not even contain code. An illegal exception and crash occur when the thread executes an illegal CPU instruction or it references invalid memory.
The driver that the crash dump analysis of a stack overrun points the blame at will vary from crash to crash, but the stop code will almost always be KERNEL_MODE_EXCEPTION_NOT_HANDLED (0x8E) on a 32-bit system and KMODE_EXCEPTION_NOT_HANDLED (0x1E) on a 64-bit one. If you execute a verbose analysis, the stack trace looks like this:
STACK_TEXT:
9569b6b4 828c108c 0000008e c0000005 00000000 nt!KeBugCheckEx+0x1e
9569badc 8284add6 9569baf8 00000000 9569bb4c nt!KiDispatchException+0x1ac
9569bb44 8284ad8a 00000000 00000000 badb0d00 nt!CommonDispatchException+0x4a
9569bbfc 82843593 853422b0 86b99278 86b99278 nt!Kei386EoiHelper+0x192
00000000 00000000 00000000 00000000 00000000 nt!IofCallDriver+0x63
Notice how the call to IofCallDriver leads immediately to Kei386EoiHelper and into an exception, instead of a driver’s IRP dispatch routine. This is consistent with the stack having been corrupted and the IRP dispatch routine causing an exception when attempting to return to its caller by referencing a corrupted return address. Unfortunately, mechanisms like special pool and system code write protection can’t catch this type of bug. Instead, you must take some manual analysis steps to determine indirectly which driver was operating at the time of the corruption. One way is to examine the IRPs that are in progress for the thread that was executing at the time of the stack trash. When a thread issues an I/O request, the I/O manager stores a pointer to the outstanding IRP on the IRP list of the ETHREAD structure for the thread. The !thread debugger command dumps the IRP list of the target thread. (If you don’t specify a thread object address, !thread dumps the processor’s current thread.) Then you can look at the IRP with the !irp command:
0: kd> !thread THREAD 8527fa58 Cid 0d0c.0d10 Teb: 7ffdf000 Win32Thread: fe4ec4f8 RUNNING on processor 0 IRP List:86b99278: (0006,0094) Flags: 00060000 Mdl: 00000000 Not impersonating ... 0: kd> !irp86b99278Irp is active with 1 stacks 1 is current (= 0x86b992e8) No Mdl: No System Buffer: Thread 8527fa58: Irp stack trace. cmd flg cl Device File Completion-Context >[ e, 0] 5 0 853422b0 85e3aed8 00000000-00000000\Driver\MYFAULTArgs: 00000000 00000000 83360010 00000000
The output shows that the IRP’s current and only stack location (designated with the “>” prefix) is owned by the Myfault driver. If this were a real crash, the next steps would be to ensure that the driver version installed is the most recent available, install the new version if it isn’t, and if it is, to enable Driver Verifier on the driver (with all settings except low memory simulation).
Note
Most newer drivers built using the WDK are compiled by default to use the /GS (Buffer Security Check) compiler flag. When the Buffer Security Check option is enabled, the compiler reserves space before the return address on the stack, which, when the function executes, is filled with a security cookie . On function exit, the security cookie is verified. A mismatch indicates that a stack overwrite may have occurred, in which case, the compiler-generated code will call KeBugCheckEx, passing the DRIVER_OVERRAN_STACK_BUFFER (0xF7) stop code.
Manually analyzing the stack is often the most powerful technique when dealing with crashes such as these. Typically, this involves dumping the current stack pointer register (for example, esp and rsp on x86 and x64 processors, respectively). However, because the code responsible for crashing the system itself might modify the stack in ways that make analysis difficult, the processor responsible for crashing the system provides a backing store for the current data in the stack, called KiPreBugcheckStackSaveArea, which contains a copy of the stack before any code in KeBugCheckEx executes. By using the dps (dump pointer with symbols) command in the debugger, you can dump this area (instead of the CPU’s stack pointer register) and resolve symbols in an attempt to discover any potential stack traces. In this crash, here’s what dumping the stack area eventually revealed on a 32-bit system:
0: kd> dps KiPreBugcheckStackSaveArea KiPreBugcheckStackSaveArea+3000
81d7dd20  881fcc44
81d7dd24  98fcf406 myfault+0x406
81d7dd28  badb0d00
Although this data was located among many other different functions, it is of special interest because it mentions a function in the Myfault driver, which as we’ve seen was currently executing an IRP, that doesn’t show on the stack. For more information on manual stack analysis, see the Debugging Tools for Windows help file and the additional resources referenced later in this chapter.
If a system becomes unresponsive (that is, you are receiving no response to keyboard or mouse input), the mouse freezes, or you can move the mouse but the system doesn’t respond to clicks, the system is said to have hung . A number of things can cause the system to hang:
A device driver does not return from its interrupt service (ISR) routine or deferred procedure call (DPC) routine
A high priority real-time thread preempts the windowing system driver’s input threads
A deadlock (when two threads or processors hold resources each other wants and neither will yield what they have) occurs in kernel mode
You can check for deadlocks by using the Driver Verifier option called deadlock detection . Deadlock detection monitors the use of spinlocks, mutexes, and fast mutexes, looking for patterns that could result in a deadlock. (For more information on these and other synchronization primitives, see Chapter 3 in Part 1.) If one is found, Driver Verifier crashes the system with an indication of which driver causes the deadlock. The simplest form of deadlock occurs when two threads hold resources each other thread wants and neither will yield what they have or give up waiting for the one they want. The first step to troubleshooting hung systems is therefore to enable deadlock detection on suspect drivers, then unsigned drivers, and then all drivers, until you get a crash that pinpoints the driver causing the deadlock.
There are two ways to approach a hanging system so that you can apply the manual crash troubleshooting techniques described in this chapter to determine what driver or component is causing the hang: the first is to crash the hung system and hope that you get a dump that you can analyze, and the second is to break into the system with a kernel debugger and analyze the system’s activity. Both approaches require prior setup and a reboot. You use the same exploration of system state with both approaches to try to determine the cause of the hang.
To manually crash a hung system, you must first add the DWORD registry value HKLM\SYSTEM\CurrentControlSet\Services\i8042prt\Parameters\CrashOnCtrlScroll and set it to 1. After rebooting, the i8042 port driver, which is the port driver for PS/2 keyboard input, monitors keystrokes in its ISR (discussed further in Chapter 3 in Part 1) looking for two presses of the Scroll Lock key while the right Control key is depressed. When the driver sees that sequence, it calls KeBugCheckEx with the MANUALLY_INITIATED_CRASH (0xE2) stop code that indicates a manually initiated crash. When the system reboots, open the crash dump file and apply the techniques mentioned earlier to try to determine why the system was hung (for example, determining what thread was running when the system hung, what the kernel stack indicates was happening, and so on). Note that this works for most hung system scenarios, but it won’t work if the i8042 port driver’s ISR doesn’t execute. (The i8042 port driver’s ISR won’t execute if all processors are hung as a result of their IRQL being higher than the ISR’s IRQL, or if corruption of system data structures extends to interrupt-related code or data.)
Note
Manually crashing a hung system by using the support provided in the i8042 port driver does not work with USB keyboards. It works with PS/2 keyboards only. See http://msdn.microsoft.com/en-us/library/windows/hardware/ff545499.aspx for information about enabling USB keyboard support.
You can also trigger a crash if your hardware has a built-in “crash” button. (Some high-end servers have these embedded on their motherboards or exposed via remote management interfaces.) In this case, the crash is initiated by signaling the nonmaskable interrupt (NMI) pin of the system’s motherboard. To enable this, set the registry DWORD value HKLM\SYSTEM\CurrentControlSet\Control\CrashControl\NMICrashDump to 1. Then, when you press the dump switch, an NMI is delivered to the system and the kernel’s NMI interrupt handler calls KeBugCheckEx . This works in more cases than the i8042 port driver mechanism because the NMI IRQL is always higher than that of the i8042 port driver interrupt. See http://support.microsoft.com/kb/927069 for more information.
If you are unable to manually generate a crash dump, you can attempt to break into the hung system by first making the system boot into debugging mode. You do this in one of two ways. You can press the F8 key during the boot and select Debugging Mode, or you can create a debugging-mode boot option in the BCD by copying an existing boot entry and adding the debug option. When using the F8 approach, the system will use the default connection (serial port COM1 and 115200 baud), but you can use the F10 key to display the Edit Boot Options screen to edit debug-related boot options. With the debug option enabled, you must also configure the connection mechanism to be used between the host system running the kernel debugger and the target system booting in debugging mode and then configure the transport parameters appropriately for the connection type. The three connection types are a null modem cable using a serial port, an IEEE 1394 (FireWire) cable using 1394 ports on each system, or a USB 2.0 host-to-host dongle using USB ports on each system. For details on configuring the host and target system for kernel debugging, see the Debugging Tools for Windows help file and the EXPERIMENT: Attaching a Kernel Debugger experiment later in the chapter.
When booting in debugging mode, the system loads the kernel debugger at boot time and makes it ready for a connection from a kernel debugger running on a different computer connected through a serial cable, IEEE 1394 cable, or USB 2.0 host-to-host dongle. Note that the kernel debugger’s presence does not affect performance. When the system hangs, run the WinDbg or Kd debugger on the connected system, establish a kernel debugging connection, and break into the hung system. This approach will not work if interrupts are disabled or the kernel debugger has become corrupted.
Note
Booting a system in debugging mode does not affect performance if it’s not connected to another system. Also, if a system booted in debugging mode is configured to automatically reboot after a crash, it will not wait for a connection from another system if a debugger isn’t already connected.
Instead of leaving the system in its halted state while you perform analysis, you can also use the debugger .dump command to create a crash dump file on the host debugger machine. Then you can reboot the hung system and analyze the crash dump offline (or submit it to Microsoft). Note that this can take a long time if you are connected using a serial null modem cable or USB 2.0 connection (versus a higher speed 1394 connection), so you might want to just capture a minidump using the .dump /m command. Alternatively, if the target machine is capable of writing a crash dump, you can force it to do so by issuing the .crash command from the debugger. This will cause the target machine to create a dump on its local hard drive that you can examine after the system reboots.
EXPERIMENT: Dumping Hyper-V Guests Using LiveKd
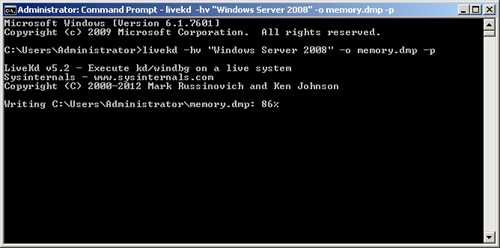
The LiveKd tool, in addition to allowing the use of the .dump command on a live system, also permits a crash dump of a running Hyper-V guest to be created. To query the list of running guests on a Hyper-V host, the –hvl option can be specified. LiveKd will display both the name of the guest virtual machine and its partition GUID:
C:\Users\Administrator>livekd -hvl

LiveKd v5.2 - Execute kd/windbg on a live system
Sysinternals - www.sysinternals.com
Copyright (C) 2000-2012 Mark Russinovich and Ken Johnson

Partition GUID                         Name
7EB669F2-EB6E-405D-94EA-21CB2ABD0A52   Windows Server 2008
D57D7601-D154-473B-847D-C3C77413AD0B   Windows Server 2003
Once the name or the partition GUID of the target Hyper-V guest has been obtained, it can be passed to LiveKd using the –hv option, along with the –o switch, specifying where to write the crash dump file. LiveKd will write a complete dump, which requires enough free disk space on the destination volume equal to the amount of memory assigned to the virtual machine. Because the Hyper-V guest is still running, LiveKd might run into situations in which data structures are in the middle of being changed by the system and are inconsistent. To prevent such an event from occurring, LiveKd is able to pause the Hyper-V guest before writing the crash dump by specifying the –p option.
LiveKd takes the additional step of writing a comment to the header of the crash dump file, specifying that a live system view was taken—notifying the user performing analysis of any possible inconsistencies. After LiveKd finishes writing the crash dump file, the file can then be analyzed using any of the kernel debuggers and techniques described earlier in the chapter. If the Hyper-V guest was previously in the running state, LiveKd will automatically resume the target system.
You can cause a hang by running Notmyfault and selecting the Hang With DPC option. This causes the Myfault driver to queue a DPC on each processor of the system that executes an infinite loop. Because the IRQL of the processor while executing DPC functions is DPC/dispatch level, the keyboard ISR will respond to the special keyboard crashing sequence.
Once you’ve broken into a hung system or loaded a manually generated dump from a hung system into a debugger, you should execute the !analyze command with the –hang option. This causes the debugger to examine the locks on the system and try to determine whether there’s a deadlock and, if so, what driver or drivers are involved. However, for a hang like the one that Notmyfault’s Hang With DPC option generates, the !analyze analysis command will report nothing useful.
If the !analyze command doesn’t pinpoint the problem, execute !thread and !process in each of the dump’s CPU contexts to see what each processor is doing. (Switch CPU contexts with the ~s command—for example, use ~1s to switch to processor 1’s context.) If a thread has hung the system by executing in an infinite loop at an IRQL of DPC/dispatch level or higher, you’ll see the driver module in which it has become stuck in the stack trace of the !thread command. The stack trace of the crash dump you get when you crash a system experiencing the Notmyfault hang bug looks like this:
STACK_TEXT:
8078ae30 8cb49160 000000e2 00000000 00000000 nt!KeBugCheckEx+0x1e
8078ae60 8cb49768 00527658 010001c6 00000000 i8042prt!I8xProcessCrashDump+0x251
8078aeac 8287c7ad 851c8780 855275a0 8078aed8 i8042prt!I8042KeyboardInterruptService+0x2ce
8078aeac 91d924ca 851c8780 855275a0 8078aed8 nt!KiInterruptDispatch+0x6d
WARNING: Stack unwind information not available. Following frames may be wrong.
8078afa4 828a5218 82966d20 86659780 00000000 myfault+0x4ca
...
The top few lines of the stack trace reference the routines that execute when you type the i8042 port driver’s crash key sequence. The presence of the Myfault driver indicates that it might be responsible for the hang. Another command that might be revealing is !locks , which dumps the status of all executive resource locks. By default, the command lists only resources that are under contention , which means that they are both owned and have at least one thread waiting to acquire them. Examine the thread stacks of the owners with the !thread command to see what driver they might be executing in. Sometimes you will find that the owner of one of the locks is waiting for an IRP to complete (a list of IRPs related to a thread is displayed in the !thread output). In these cases it is very hard to tell why an IRP is not making forward progress. (IRPs are usually queued to privately managed driver queues before they are completed). One thing you can do is examine the IRP with the !irp command and find the driver that pended the IRP (it will have the word “pending” displayed in its stack location from the !irp output). Once you have the driver name, you can use the !stacks command to look for other threads that the driver might be running on, which often provides clues about what the lock-owning driver is doing. Much of the time you will find the driver is deadlocked or waiting on some other resource that is blocked waiting for the driver.
In this section, we’ll address how to troubleshoot systems that for some reason are not recording a crash dump. One reason why a crash dump might not be recorded is if no paging file is configured to hold the dump. This can easily be remedied by creating a paging file of the required size. A second reason why there might not be a crash dump recorded is because the kernel code and data structures needed to write the crash dump have been corrupted at the time of the crash. As described earlier, this data is captured when the system boots, and if the integrity verification check made at the time of the crash does not match, the system does not even attempt to save the crash dump (so as not to risk corrupting data on the disk). So in this case, you need to catch the system as it crashes and then try to determine the reason for the crash.
Another reason occurs when the disk subsystem for the system disk is not able to process disk write requests (a condition that might have triggered the system failure itself). One such condition would be a hardware failure in the disk controller or maybe a cabling issue near the hard disk.
Yet another possibility occurs when the system has drivers that have registered callbacks that are invoked before the crash dump is written. When the driver callbacks are called, they might incorrectly access data structures located in paged memory (for example), which will lead to a second crash. In the case of a crash inside of a secondary dump callback, the system should still have a valid crash dump file but any secondary crash dump data may be missing or incomplete.
One simple option is to turn off the Automatically Restart option in the Startup And Recovery settings so that if the system crashes, you can examine the blue screen on the console. However, only the most straightforward crashes can be solved from just the blue-screen text.
To perform more in-depth analysis, you need to use the kernel debugger to look at the system at the time of the crash. This can be done by booting the system in debugging mode, which is described in the previous section. When a system is booted in debugging mode (with a debugger attached) and crashes, instead of painting the blue screen and attempting to record the dump, it will break into the host kernel debugger. In this way, you can see the reason for the crash and perhaps perform some basic analysis using the kernel debugger commands described earlier. As mentioned in the previous section, you can use the .dump command in the debugger to save a copy of the crashed system’s memory space for later debugging, thus allowing you to reboot the crashed system and debug the problem offline.
EXPERIMENT: Attaching a Kernel Debugger
Connecting a kernel debugger to a live, running system requires two computers—a target and a host. The target, the system being debugged, must be booted in debugging mode by pressing F8 during the boot process and selecting Debugging Mode or by modifying the boot configuration database from within an elevated command prompt using the BCDEdit tool:
bcdedit /debug on
The system will use the default settings of serial port COM1 and baud rate 115200 if no other settings are specified. On the host system—the computer running the debugger—the symbol path option needs to be set so that the debugger can locate the required symbol files. One option for configuring the symbol path is to use the systemwide environment variable _NT_SYMBOL_PATH. Setting the systemwide variable allows for other applications, such as Process Explorer and Process Monitor, to take advantage of the symbol path without requiring additional configuration. The symbol path can be set via an elevated command prompt by using the following command:
setx _NT_SYMBOL_PATH srv*c:\symbols*http://msdl.microsoft.com/download/symbols /m
The /m switch specifies that the variable should be set system wide. Without it, the default option is to set it only for the current user. One final step that’s required is to configure the transport layer. If two physical computers are being used, this is done by connecting the serial ports of the computers to each other by using a null modem cable.
In the following example, a Hyper-V guest has been selected as the target. Hyper-V (as is the case with other virtual-machine technologies) supports the option of configuring a virtual serial port to communicate with a physical computer through a named pipe. If you are using multiple named pipes, each pipe name should be unique to avoid a conflict.
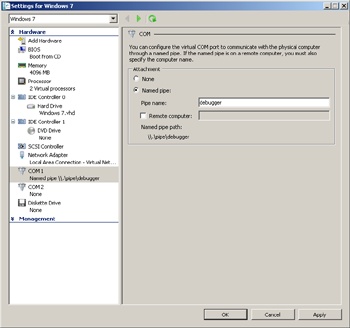
Before restarting the target system, the debugger on the host needs to be configured to specify the named pipe that should be used as a transport. Both the resets=0 and reconnect options specified in the following command are required when connecting to Hyper-V guests. (For other virtual-machine technologies, refer to the Debugging Tools for Windows help file.) The command shown here will start a debugging session on a virtual machine, which is running on the same physical computer as the debugger:
windbg -k com:pipe,port=\\.\pipe\debugger,resets=0,reconnect
The WinDbg command window should appear with a prompt that the debugger is waiting to connect:
Microsoft (R) Windows Debugger Version 6.12.0002.633 AMD64
Copyright (c) Microsoft Corporation. All rights reserved.

Waiting for pipe \\.\pipe\debugger
Waiting to reconnect...
At this point, the target system should be restarted. After a brief period, the two systems should connect via the named pipe. The following output confirms that the host is now connected to the target system through the kernel debugger:
Connected to Windows 7 7601 x86 compatible target at
     (Mon Mar 12 19:34:01.295 2012 (UTC - 7:00)), ptr64 FALSE
Kernel Debugger connection established.
Symbol search path is: srv*c:\symbols*http://msdl.microsoft.com/download/symbols
Executable search path is:
Windows 7 Kernel Version 7601 (Service Pack 1) MP (1 procs) Free x86 compatible
Built by: 7601.17514.x86fre.win7sp1_rtm.101119-1850
Machine Name:
Kernel base = 0x82813000 PsLoadedModuleList = 0x8295d850
System Uptime: not available
To verify that the system will break into the debugger when a crash occurs, the /bugcheck option of Notmyfault can be used to crash the system. As is the case with other Notmyfault functions, a control code is sent to the Myfault.sys driver. The control code specifies that the KeBugCheckEx routine should be called, passing it a reference to the stop code. Here is an example of using a user-defined stop code:
notmyfault /bugcheck 0xdeaddead
When a debugger is connected to the system and a crash occurs, control is given to the debugger before painting the blue screen and any bugcheck callbacks have been called. This allows for further analysis to be performed or for breakpoints to be set:
*** Fatal System Error: 0xdeaddead
                       (0x00000000,0x00000000,0x00000000,0x00000000)

Break instruction exception - code 80000003 (first chance)

A fatal system error has occurred.
Debugger entered on first try; Bugcheck callbacks have not been invoked.

A fatal system error has occurred.
...
The operating system code and data structures that handle processor exceptions can become corrupted such that a series of recursive faults occur. One example of this would be if the operating system trap handler got corrupted and caused a page fault. This would invoke the page fault handler, which would fault again, and so on. If such a situation occurred, the system would be hopelessly stuck. To prevent such a situation from occurring, CPUs have a built-in recursive fault protection mechanism, which sets a hard limit on the depth of a recursive fault. On most x86 processors, a fault can nest to two levels deep. When the third recursive fault occurs, the processor resets itself and the machine reboots. This is called a triple fault . This can happen when there’s a faulty hardware component as well. Even a kernel debugger won’t be invoked in a triple fault situation. However, sometimes the mere fact that the kernel debugger doesn’t activate can confirm that there’s a problem with newly added hardware or drivers.