The following sections provide a walkthrough of common stop codes reported to Microsoft’s Online Crash Analysis service. For each stop code presented, the analysis begins with the verbose output of the analysis engine’s !analyze –v command.
The reasons for each type of crash may vary, as will the commands and techniques used to analyze them. For more information on analyzing common stop codes, see the Debugging Tools for Windows help file and the additional resources referenced later in this chapter.
The DRIVER_IRQL_NOT_LESS_OR_EQUAL (0xD1) stop code is the result of a device driver attempting to access a pageable or invalid address at an interrupt request level that is too high. This stop code is usually the result of device drivers using improper addresses.
DRIVER_IRQL_NOT_LESS_OR_EQUAL (d1)
An attempt was made to access a pageable (or completely invalid) address at an
interrupt request level (IRQL) that is too high.  This is usually
caused by drivers using improper addresses.
If kernel debugger is available get stack backtrace.
Arguments:
Arg1: a0a91660, memory referenced
Arg2: 00000002, IRQL
Arg3: 00000000, value 0 = read operation, 1 = write operation
Arg4: 85701579, address which referenced memory
In analyzing a stop DRIVER_IRQL_NOT_LESS_OR_EQUAL (0xD1), viewing the stack trace of the thread that was executing at the time of the crash will reveal the device driver that was referencing pageable or invalid memory:
STACK_TEXT:
8b94bb3c 85701579 badb0d00 84f40600 a0a4f660 nt!KiTrap0E+0x2cf
WARNING: Stack unwind information not available. Following frames may be wrong.
8b94bbb8 85701849 86ffe5d8 8b94bbfc 857018ac myfault+0x579
8b94bbc4 857018ac 850d6890 00000001 00000000 myfault+0x849
8b94bbfc 8283e593 86efaa98 86ffe5d8 86ffe5d8 myfault+0x8ac
8b94bc14 82a3299f 850d6890 86ffe5d8 86ffe648 nt!IofCallDriver+0x63
8b94bc34 82a35b71 86efaa98 850d6890 00000000 nt!IopSynchronousServiceTail+0x1f8
8b94bcd0 82a7c3f4 86efaa98 86ffe5d8 00000000 nt!IopXxxControlFile+0x6aa
8b94bd04 828451ea 000000b8 00000000 00000000 nt!NtDeviceIoControlFile+0x2a
8b94bd04 776f70b4 000000b8 00000000 00000000 nt!KiFastCallEntry+0x12a
0012f994 00000000 00000000 00000000 00000000 0x776f70b4
The debugger’s analysis engine is able to locate and display the trap frame that was created when the exception that caused the crash occurred. The trap frame contains the kernel thread’s machine state, which includes the register values of the CPU that the thread was executing on. The instruction pointer register (eip on an x86 processor and rip on an x64) contains the address of the instruction that, when executed, generated the trap. The lower line of the output from the .trap command in the debugger lists the address of the instruction that caused the crash, its binary code, assembly language mnemonic, and assembly language details:
TRAP_FRAME:  8b94bb3c -- (.trap 0xffffffff8b94bb3c)
ErrCode = 00000000
eax=a0a91660 ebx=86ffe5f0 ecx=00200073 edx=84f40600 esi=a0a4f660 edi=00000000
eip=85701579 esp=8b94bbb0 ebp=8b94bbb8 iopl=0         nv up ei ng nz na pe nc
cs=0008  ss=0010  ds=0023  es=0023  fs=0030  gs=0000             efl=00010286
myfault+0x579:
85701579 8b08            mov     ecx,dword ptr [eax]  ds:0023:a0a91660 =????????
The first bugcheck parameter of a stop DRIVER_IRQL_NOT_LESS_OR_EQUAL (0xD1) points to the memory address that was being referenced by the device driver. If the debugger is unable to display an address (because it is invalid or not present in the dump file), a series of question marks is displayed. In the trap frame just shown, the debugger has been unable to resolve the address of the memory referenced by the device driver.
Viewing the output of the !pte command for the address that was referenced confirms that the valid bit for the page table entry is not set, which indicates that the address does not map to a page in physical memory:
0: kd> !pte a0a91660
                    VA a0a91660
PDE at C0602828            PTE at C0505488
contains 0000000010BE6863  contains 00007A1800000000
pfn 10be6     ---DA--KWEV   not valid
                            PageFile:  0
                            Offset: 7a18
Protect: 0The KERNEL_MODE_EXCEPTION_NOT_HANDLED (0x8E) stop message is caused by a kernel-mode thread generating an exception that was not handled. The first bugcheck parameter identifies the exception code for which a handler was not found. Common exception codes are STATUS_BREAKPOINT (0x80000003) and STATUS_ACCESS_VIOLATION (0xC0000005).
KERNEL_MODE_EXCEPTION_NOT_HANDLED (8e)
This is a very common bugcheck.  Usually the exception address pinpoints
the driver/function that caused the problem.  Always note this address
as well as the link date of the driver/image that contains this address.
Some common problems are exception code 0x80000003.  This means a hard
coded breakpoint or assertion was hit, but this system was booted
/NODEBUG.  This is not supposed to happen as developers should never have
hardcoded breakpoints in retail code, but ...
If this happens, make sure a debugger gets connected, and the
system is booted /DEBUG.  This will let us see why this breakpoint is
happening.Arguments:
Arg1: 80000003, The exception code that was not handled
Arg2: 92c70a78, The address that the exception occurred at
Arg3: 9444fb4c, Trap Frame
Arg4: 00000000
Viewing the stack trace of the crashed thread can give an indication of the driver or function that caused the problem. If there’s nothing that looks suspicious, viewing the address where the exception occurred should provide more details. The stack trace from a crashed system looks like this:
STACK_TEXT:
9444f6b4 828ba08c 0000008e 80000003 92c70a78 nt!KeBugCheckEx+0x1e
9444fadc 82843dd6 9444faf8 00000000 9444fb4c nt!KiDispatchException+0x1ac
9444fb44 82844678 9444fbc4 92c70a79 badb0d00 nt!CommonDispatchException+0x4a
9444fb44 92c70a79 9444fbc4 92c70a79 badb0d00 nt!KiTrap03+0xb8
WARNING: Stack unwind information not available. Following frames may be wrong.
9444fbc4 92c70b1c 8730f980 00000001 00000000 myfault+0xa79
9444fbfc 8283c593 87314a08 87279950 87279950 myfault+0xb1c
9444fc14 82a3099f 8730f980 87279950 872799c0 nt!IofCallDriver+0x63
9444fc34 82a33b71 87314a08 8730f980 00000000 nt!IopSynchronousServiceTail+0x1f8
9444fcd0 82a7a3f4 87314a08 87279950 00000000 nt!IopXxxControlFile+0x6aa
9444fd04 828431ea 000000c4 00000000 00000000 nt!NtDeviceIoControlFile+0x2a
9444fd04 772c70b4 000000c4 00000000 00000000 nt!KiFastCallEntry+0x12a
0012f2ac 00000000 00000000 00000000 00000000 0x772c70b4
The second bugcheck parameter contains the location in memory that the exception occurred at. In the case of a STATUS_BREAKPOINT exception, unassembling the address will confirm the presence of a breakpoint instruction. The processor instruction INT 3 is called the trap to debugger instruction. An INT 3 instruction, when executed, causes the system to call the kernel’s debugger exception handler. If a debugger is attached to the computer, the system will break in.
0: kd> u 92c70a78
myfault+0xa78:
92c70a78 cc              int     3
...
Breakpoints shouldn’t usually appear in retail versions of device drivers. Using the lm command, it’s sometimes possible to determine which environment a device driver was targeted for. When compiling a driver for release (and unless overridden by the developer), a flag is set indicating the release type. When viewing the File flags property, the presence of the word Debug indicates that the driver was built using a checked (or debug) environment:
0: kd> lm kv m myfault
start    end        module name
92c70000 92c71880   myfault    (no symbols)
    Loaded symbol image file: myfault.sys
    Image path: \??\C:\Windows\system32\drivers\myfault.sys
    Image name: myfault.sys
    Timestamp:        Sat Apr 07 09:34:40 2012 (4F806CA0)
    CheckSum:         00004227
    ImageSize:        00001880
    File version:     4.0.0.0
    Product version:  4.0.0.0
    File flags:       1 (Mask 3F)  Debug
    File OS:          40004 NT Win32
...
A breakpoint in a debug version of a driver could also indicate the failure of an ASSERT macro. If a kernel debugger is attached to the system, a message would be displayed followed by a prompt asking the user what to do about the assertion failure.
An UNEXPECTED_KERNEL_MODE_TRAP (0x7F) stop code indicates that the CPU generated a trap that the Windows kernel failed to handle. The trap could be the result of a bound trap (which the kernel is not permitted to catch) or a double fault (a fault that occurs while the kernel is processing an earlier fault). The first bugcheck parameter defines the type of trap.
UNEXPECTED_KERNEL_MODE_TRAP (7f)
This means a trap occurred in kernel mode, and it's a trap of a kind
that the kernel isn't allowed to have/catch (bound trap) or that
is always instant death (double fault).  The first number in the
bugcheck params is the number of the trap (8 = double fault, etc)
Consult an Intel x86 family manual to learn more about what these
traps are. Here is a *portion* of those codes:
If kv shows a taskGate
        use .tss on the part before the colon, then kv.
Else if kv shows a trapframe
        use .trap on that value
Else
        .trap on the appropriate frame will show where the trap was taken
        (on x86, this will be the ebp that goes with the procedure KiTrap)
Endif
kb will then show the corrected stack.
Arguments:
Arg1: 00000008, EXCEPTION_DOUBLE_FAULT
Arg2: 801db000
Arg3: 00000000
Arg4: 00000000
Most traps in this category are the result of faulty or failed hardware. If you recently added new hardware to the computer, try removing it to see whether the problem no longer occurs. Remove any existing hardware that may have failed and have it replaced. It’s also recommended to run any manufacturer-supplied hardware-diagnostic tools to determine which components may have failed.
There are, however, certain traps that are the result of software errors. Viewing the trap frame that was generated or the task gate (depending on the type of trap) displays the instruction that generated the trap:
TSS:  00000028 -- (.tss 0x28)
eax=8336001c ebx=86d57388 ecx=83360044 edx=00000000 esi=86d57388 edi=00000000
eip=96890918 esp=92985000 ebp=92987bc4 iopl=0         nv up ei pl zr na pe nc
cs=0008  ss=0010  ds=0023  es=0023  fs=0030  gs=0000             efl=00010246
myfault+0x918:
96890918 e8f9ffffff      call    myfault+0x916 (96890916)
The type of trap described earlier, an EXCEPTION_DOUBLE_FAULT, is usually the result of one of two common causes—a kernel stack overflow or faulty hardware. A kernel stack overflow occurs when a kernel thread’s guard page is hit, as a result of having exhausted all of the current thread’s stack allocation. The kernel attempts to push a trap frame onto the stack—for which no more space exists—causing a double fault.
Using the !thread command to verify the stack limits of the thread that was executing confirms whether the double fault was caused by a kernel stack overflow:
0: kd> !thread
THREAD 850e3918  Cid 0fb8.0fbc  Teb: 7ffde000 Win32Thread: fe4f0dd8 RUNNING on processor 0
IRP List:
    86d57370: (0006,0094) Flags: 00060000  Mdl: 00000000
Not impersonating
DeviceMap                 8fa3b8e8
Owning Process            85100670       Image:         NotMyfault.exe
Attached Process          N/A            Image:         N/A
Wait Start TickCount      21664          Ticks: 0
Context Switch Count      461
UserTime                  00:00:00.000
KernelTime                00:00:00.046
Win32 Start Address 0x00fe27ff
Stack Init 92987fd0 Current 92987af8 Base 92988000 Limit 92985000 Call 0
Priority 12 BasePriority 8 UnusualBoost 0 ForegroundBoost 2 IoPriority 2 PagePriority 5
ChildEBP RetAddr  Args to Child
00000000 96890918 00000000 00000000 00000000 nt!KiTrap08+0x75 (FPO: TSS 28:0)
WARNING: Stack unwind information not available. Following frames may be wrong.
92987bc4 96890b1c 87015038 00000001 00000000 myfault+0x918
92987bfc 82845593 85154158 86d57370 86d57370 myfault+0xb1c
92987c14 82a3999f 87015038 86d57370 86d573e0 nt!IofCallDriver+0x63
92987c34 82a3cb71 85154158 87015038 00000000 nt!IopSynchronousServiceTail+0x1f8
92987cd0 82a833f4 85154158 86d57370 00000000 nt!IopXxxControlFile+0x6aa
92987d04 8284c1ea 000000c4 00000000 00000000 nt!NtDeviceIoControlFile+0x2a
92987d04 779a70b4 000000c4 00000000 00000000 nt!KiFastCallEntry+0x12a (FPO: [0,3]
    TrapFrame @ 92987d34)
0012f424 00000000 00000000 00000000 00000000 0x779a70b4
The two values of interest are the stack base and the stack limit. Comparing the value of the stack limit with the value stored in the stack pointer register (esp in this case) of the task state segment shown earlier confirms that the lower limit of the stack has been reached. (Both locations contain the same value.)
To understand what component has used all of the kernel thread’s stack allocation requires the two values obtained earlier—the stack base and the stack limit. Using the dps command with both values displays the thread’s stack, using symbols to resolve any function names:
0: kd> dps 92985000  92988000
92985000  9689091d myfault+0x91d
92985004  9689091d myfault+0x91d
92985008  9689091d myfault+0x91d
...
In this output, a repeating address is shown for the Myfault.sys driver. This is consistent with a device driver that is recursively calling into itself. Each call to a function pushes the return address onto the stack—growing the stack and contributing to the thread’s overall stack limit. The return address is popped off the stack only when the function returns. In the case of a driver or function recursively calling itself, each function called never returns.
Diagnosing the cause of pool corruption can be difficult, if not virtually impossible, without the use of additional tools. The recommended course of action for troubleshooting any type of pool corruption issue is to enable the special pool option of Driver Verifier against any new or suspect drivers. Before you enable Driver Verifier, spending a few extra minutes analyzing the crash may yield some interesting results.
The cause of a DRIVER_CORRUPTED_EXPOOL (0xC5) stop code is the result of an attempt to access a pageable or invalid address at an IRQL that is too high. The stop code originates from the kernel as a stop IRQL_NOT_LESS_OR_EQUAL (0xA). Inside the kernel’s KeBugCheck2 function (for which KeBugCheckEx is just a stub), the system checks the value of the stop code. If the stop code’s value is equal to IRQL_NOT_LESS_OR_EQUAL (0xA), the system queries the fourth bugcheck parameter, which is the address that referenced the memory that led to the crash. If the address lies between the regions of memory that contain the Windows executive’s pool functions, the system changes the stop code to DRIVER_CORRUPTED_EXPOOL (0xC5). The reason for modifying the stop code is to highlight that it’s not the fault of the pool routines, but rather that one of the pool structures they manage has been corrupted.
DRIVER_CORRUPTED_EXPOOL (c5)
An attempt was made to access a pageable (or completely invalid) address at an
interrupt request level (IRQL) that is too high.  This is
caused by drivers that have corrupted the system pool.  Run the driver
verifier against any new (or suspect) drivers, and if that doesn't turn up
the culprit, then use gflags to enable special pool.
Arguments:
Arg1: 4f4f4f53, memory referenced
Arg2: 00000002, IRQL
Arg3: 00000000, value 0 = read operation, 1 = write operation
Arg4: 829234a7, address which referenced memory
In the case of pool corruption, a stack trace almost always points to Ntoskrnl or another device driver as being the likely cause of the crash. In the following example, the stack trace of the thread that was executing when the system crashed lists only Windows operating system functions:
STACK_TEXT:
8b8e3554 829234a7 badb0d00 00000000 91470d90 nt!KiTrap0E+0x2cf
8b8e3610 8288d2c6 00000000 00000280 76615358 nt!ExAllocatePoolWithTag+0x49d
8b8e3620 8288d19d 00000001 00000053 8b8e38a8 nt!KeAllocateXStateContext+0x25
8b8e3644 8288d6b5 00000003 00000000 8b8e37b4 nt!KeSaveExtendedProcessorState+0x104
8b8e3658 9139b443 8b8e37b4 fe7b8010 8288d038 nt!KeSaveFloatingPointState+0x14
8b8e3864 9139bfdb fe8af408 ffbbd540 00000000 win32k!EngAlphaBlend+0x230
8b8e38d0 9139c394 fe7b8010 fe989010 fe1c0010 win32k!SURFREFDC::vUnlock+0x1e5
8b8e3974 913a4a2f fe7b8010 fe989010 00000000 win32k!SURFREFDC::vUnlock+0x59e
8b8e39d4 913a4981 fe7b8010 fe989010 00000000 win32k!EngNineGrid+0x6e
8b8e3a34 913a4847 fe7b8010 fe989010 00000000 win32k!EngDrawStream+0x109
8b8e3aa8 913a13a3 8b8e3ba4 00000000 fe989000 win32k!NtGdiDrawStreamInternal+0x232
8b8e3bd4 913a0e09 3a010231 00000000 fe9ef140 win32k!GreDrawStream+0x557
8b8e3d20 828401ea 3a010231 00000060 0012f628 win32k!NtGdiDrawStream+0x8c
8b8e3d20 774570b4 3a010231 00000060 0012f628 nt!KiFastCallEntry+0x12a
0012f49c 75c973a5 75c9738f 3a010231 00000060 ntdll!KiFastSystemCallRet
0012f4a0 75c9738f 3a010231 00000060 0012f628 GDI32!NtGdiDrawStream+0xc
0012f5a4 74243efa 3a010231 00000060 0012f628 GDI32!GdiDrawStream+0x432
The trap frame that was generated when the attempt to access pageable or invalid memory was made displays the processor instruction that was executed and the register values of the CPU the thread was executing on. The debugger, with the assistance of the symbol file for the kernel image, is able to display the name of the function that crashed, using the instruction pointer as a reference:
TRAP_FRAME:  8b8e3554 -- (.trap 0xffffffff8b8e3554)
eax=8b8e35f8 ebx=82939940 ecx=4f4f4f4f edx=00000000 esi =82939da8 edi=82939944
eip=829234a7 esp=8b8e35c8 ebp=8b8e3610 iopl=0         ov up ei ng nz na po cy
cs=0008  ss=0010  ds=0023  es=0023  fs=0030  gs=0000             efl=00010a83
nt!ExAllocatePoolWithTag+0x49d:
829234a7 8b4104          mov     eax,dword ptr [ecx+4] ds:0023:4f4f4f53=????????
As with previous examples, the series of question marks is used to represent invalid addresses that were unable to be displayed by the debugger. In the case of the preceding instruction, the processor read the address stored in the ecx register, added a value of four to it, and then attempted to reference the memory pointed to by that address (for storage into the eax register). The resulting address to be fetched was invalid, causing an exception to be raised by the processor.
To understand why the invalid value was stored in the ecx register, analyzing the set of instructions that executed prior to the crash may give an indication. The following output shows the results of unassembling the instruction stream of the crashed thread, backward from the current instruction pointer:
0: kd> ub 829234a7
nt!ExAllocatePoolWithTag+0x479:
...
829234a5 8b0e            mov     ecx,dword ptr [esi]
Analysis reveals that the address in the ecx register was written to by an instruction that read the value pointed to by the esi register. Using the dc command with the address stored in the esi register of the trap frame shows from where the value 4f4f4f4f originated. What is of interest in the output of the command is that each of the addresses listed appears as a pair and that the first value—the one that contains the invalid address—doesn’t match the value adjacent to it:
0: kd> dc 82939da8
82939da8  4f4f4f4f 85045810 82939db0 82939db0  OOOO.X..........
82939db8  82939db8 82939db8 86f749f8 86f749f8  .........I...I..
82939dc8  82939dc8 82939dc8 82939dd0 82939dd0  ................
82939dd8  82939dd8 82939dd8 82939de0 82939de0  ................
82939de8  82939de8 82939de8 82939df0 82939df0  ................
...
Following the suspicion that these values are address pairs and that the first value is invalid, displaying the address next to the corrupted value leads toward determining the cause of the corruption. The value 4f4f4f4f is OOOO in ASCII, which is apparent in the output shown here:
0: kd> dc 85045810
85045810  4f4f4f4f 4f4f4f4f 4f4f4f4f 4f4f4f4f  OOOOOOOOOOOOOOOO
85045820  4f4f4f4f 4f4f4f4f 4f4f4f4f 4f4f4f4f  OOOOOOOOOOOOOOOO
85045830  46524556 00574f4c 00000000 00000000  VERFLOW.........
85045840  00000000 00000000 00000000 00000000  ................
85045850  00000000 00000000 00000000 00000000  ................
...
Checking the pool allocation with the !pool command confirms that the allocation, along with its pool headers, have been corrupted:
0: kd> !pool 85045810
Pool page 85045810 region is Nonpaged pool
 85045000 size:  808 previous size:    0  (Allocated)  None
85045808 is not a valid large pool allocation, checking large session pool...
85045808 is freed (or corrupt) pool
Bad previous allocation size @85045808, last size was 101
It’s important to note that although corruption has been identified, it may or may not have directly caused the crash currently being analyzed. Any pool corruption that has been discovered requires further investigation. Pool corruption left undiagnosed risks further crashes to the system or corruption of data stored on disk.
Of further interest in the output of the corrupted pool allocation is a reference to the string OVERFLOW . Using the !for_each_module command, it’s possible to search each loaded module for any occurrences of the suspect string. The following debugger command displays the name of any loaded drivers that contain a match for the search phrase:
0: kd> !for_each_module .foreach (address {s -[1]a @#Base @#End "OVERFLOW"}) {lm 1m a a
ddress}
BTHUSB
CLASSPNP
CLASSPNP
rfcomm
rfcomm
rfcomm
...
myfault
Further analysis of a crash dump that appears at first to be virtually impossible to diagnose has narrowed down the list of suspect drivers. The next step would be to enable the special pool option of Driver Verifier with the device drivers listed.
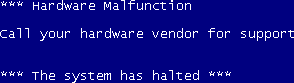
Another type of stop message is the hardware malfunction screen. This type of screen is displayed when the processor detects a hardware condition. Figure 14-10 shows a sample hardware malfunction screen. Depending on the type of condition that generated the hardware malfunction, the system might display additional information indicating the cause of the error. When displaying the hardware malfunction screen, the system ignores the AutoReboot value of the HKLM\SYSTEM\CurrentControlSet\Control\CrashControl registry key and will display the screen indefinitely.
As you should with any stop messages that are suspected to be caused by hardware failures, run any manufacturer-supplied hardware-diagnostic tools to determine which components, if any, may have failed. If you recently added new hardware to the computer, try removing it to see whether the problem no longer occurs. Remove any existing hardware that may have failed, and have it replaced.
Signaling the nonmaskable interrupt (NMI) pin of the system’s motherboard when the HKLM\SYSTEM\CurrentControlSet\Control\CrashControl\NMICrashDump registry value isn’t set will also generate a hardware malfunction screen. If the intention was to generate a manual crash dump using an NMI button for offline analysis, verify that the NMICrashDump value is configured correctly.