As you no doubt know, an Excel chart can contain more than one data series. We have remarked that each series (that is, the Series object) has a ChartType property that can be used to set the chart type of the series. Thus, a single chart may have one or more series with a column-type format and one or more series with a line-type format.
A ChartGroup object represents one or more series that are plotted on a chart with the same chart type. Note that a ChartGroup object is not a collection. To access the individual Series objects represented by a ChartGroup, we must use the SeriesCollection property (discussed later in this chapter).
The ChartGroup objects for a single chart are stored in the ChartGroups collection for the Chart object. This collection is accessed using the ChartGroups property.
The Excel object model provides a way to get "subcollections" of the ChartGroups collection that correspond to the major chart types (line, column, bar, etc.). To illustrate, the ColumnGroups method applies to a 2-D chart and returns the collection of all ChartGroup objects that correspond to the various column-type formats. The syntax is:
ChartObject.ColumnGroupsWe can also access a single ChartGroup in this collection using the syntax:
ChartObject.ColumnGroups(Index)
Note, however, that there is no ColumnChartGroups collection per se. The ColumnGroups method actually returns a ChartGroups collection, but not the full collection that would be returned by:
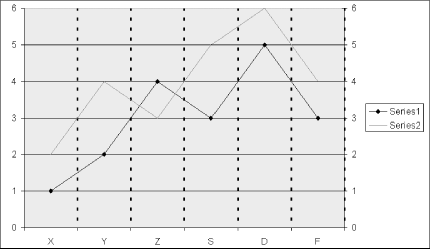
ChartObject.ChartGroupsTo illustrate, the chart in Figure 21-15 has two series. While each series has a line type, the subtypes are different. One series has been formatted with a line type with no data point markers, whereas the other has data markers. Accordingly, the code:
ActiveChart.LineGroups.Count
returns the value 2, since there are two distinct
ChartGroup objects that fit in the LineGroups collection.
The Chart object has the following methods that return corresponding collections of ChartGroup objects:
AreaGroups
BarGroups
ColumnGroups
DoughnutGroups
LineGroups
PieGroups
RadarGroups
XYGroups
There are also some members of the Chart object that return chart groups for 3-D charts. They are: Area3DGroup, Bar3DGroup, Column3DGroup, Line3DGroup, Pie3DGroup, and SurfaceGroup. These members are singular because they return a single ChartGroup object.
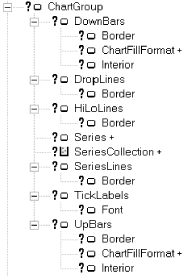
The portion of the Excel object model that relates to ChartGroup objects is shown in Figure 21-16.
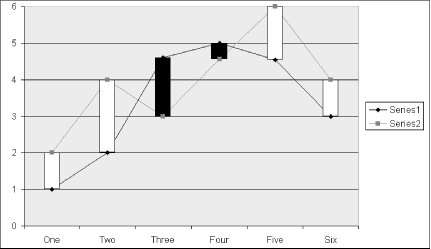
UpBars and DownBars are shown in Figure 21-17. These bars give a quick indication of the difference between data values in two different data series of line type. The UpBars are in white and DownBars are in black. The code to generate these bars is:
With ActiveChart.LineGroups(1)
    .HasUpDownBars = True
    .UpBars.Interior.Color = RGB(255, 255, 255)
    .DownBars.Interior.Color = RGB(0, 0, 0)
End With
Note that UpBars and DownBars apply only to 2-D line-type charts.
DropLines are
vertical lines that extend from the data markers on a line chart to
the category axis. The HasDropLines property of the ChartGroup
object can be set to True to display DropLines.
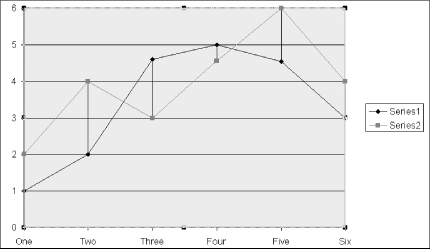
HiLoLines are shown in Figure 21-18. The
HasHiLoLines property of the ChartGroup
object can be set to True to display HiLoLines.
HiLoLines apply only to two-dimensional charts.
The SeriesCollection property of a ChartGroup object returns the SeriesCollection collection of all Series objects that lie in that chart group. We will discuss Series objects later in the chapter.
SeriesLines are shown in Figure 21-19. They apply
only to stacked column or stacked bar chart groups. The
HasSeriesLines property can be set to True to
display series lines for a chart group.
