Introduction
In the next two chapters, we describe how to build agile and adaptive Balanced Scorecard systems. Within this chapter, we explore Strategy Maps (the most important component of the system), while in the next, we consider the supporting scorecard of Key Performance Indicators (KPIs), targets, and initiatives.
As we stressed in earlier chapters, we need to be careful in applying agile thinking to all aspects of the strategy management process. However, it is more readily applied during execution (where work gets done) but oftentimes, adaptiveness is more appropriate.
Starting with the Strategy Map
Building a Balanced Scorecard System should always start with the Strategy Map, as this is the most important component. Moreover, if the earlier steps (quantified vision, senior management interviews, and Strategic Change Agenda) have been done well—see previous chapter—then the Strategy Map should be a very quick process.
A Non-Agile Process
Something we have noted is that oftentimes it takes an organization a long time (perhaps several months) to build the corporate map and scorecard and then even longer to build the aligned scorecard systems (see Chap. 6: Driving Rapid Enterprise Alignment). Of course, this is not helped by the need of many consultancies to maximize billable hours. An interesting spin on Albert Einstein’s quote that, “The definition of genius is to make the complex simple.”
In the digital age, it is simply ludicrous to spend an inordinate amount of time building and rolling out a Balanced Scorecard System. By the time the project is only half way complete, elements of the strategy might well be out-of-date or more likely some of the underpinning assumptions would be found to be wrong.
The scorecard becomes a barrier against agility and adaptiveness, which is not a good place to be. A corollary would be the annual budgeting process, which most managers believe to be out-of-date (and sometimes totally irrelevant) on the very day it is published (for more on this, see Chap. 7: Aligning the Financial and Operational Drivers of Strategic Success).
Actually, completing the senior management interviews, the Strategic Change Agenda, and the corporate-level Balanced Scorecard system is a very quick process. We’re talking weeks, not months.
There are very good reasons why this should be the case. Firstly, prolonging the effort to build the system is often time and energy consuming. Once complete, there is little appetite to revisit (and especially if there’s a sequence straight to a suite of aligned scorecard) until the following year. Hardly agile.
Secondly, as Hubert Saint-Onge commended in Chap. 1, a strategy is a set of assumptions that must be verified in execution—a set of assumptions! Much better to get to a scorecard that “feels” about right and then continually test and adapt it rather than try to configure the “perfect” system (which would almost certainly be incorrect, anyway).
Testing on a continual basis is something we explore in detail within Chap. 9: Unleashing the Power of Analytics for Strategic Learning and Adapting and discussed below.
Writing Objectives
Through our field experiences and research efforts, it has been obvious that many organizations make fundamental errors when wording the objectives. Let’s go back to scorecard basics and the original questions posed by Kaplan and Norton.
What Does Success Look Like in the Eyes of Shareholders (or Funders)?
There are sometimes mistakes with the financial (shareholder) perspective. Although seemingly a simple collection of financial objectives, it might be sensible to ask shareholders what they want from the organization. It is, after all, what success looks like in the eyes of shareholders. In some cases, they will want more than short-term gains and be concerned with governance or sustainability, for example. Similarly, if creating a top-level stakeholder perspective in a government or not-for-profit (the funders) then ask them what they want to see as outcomes for the organization.
What Does Success Look Like in the Eyes of Customers?
When designing strategic objectives for the customer perspective, a common mistake is to create objectives that describe what the organization wants from the customer relationship: objectives such as increased customer loyalty or increased share of wallet abound.
The customer perspective represents outcomes that are of value in the eyes of the customer. Customers rarely procure a product or service because they want to be loyal, and how many ask how they can give their supplier more money?
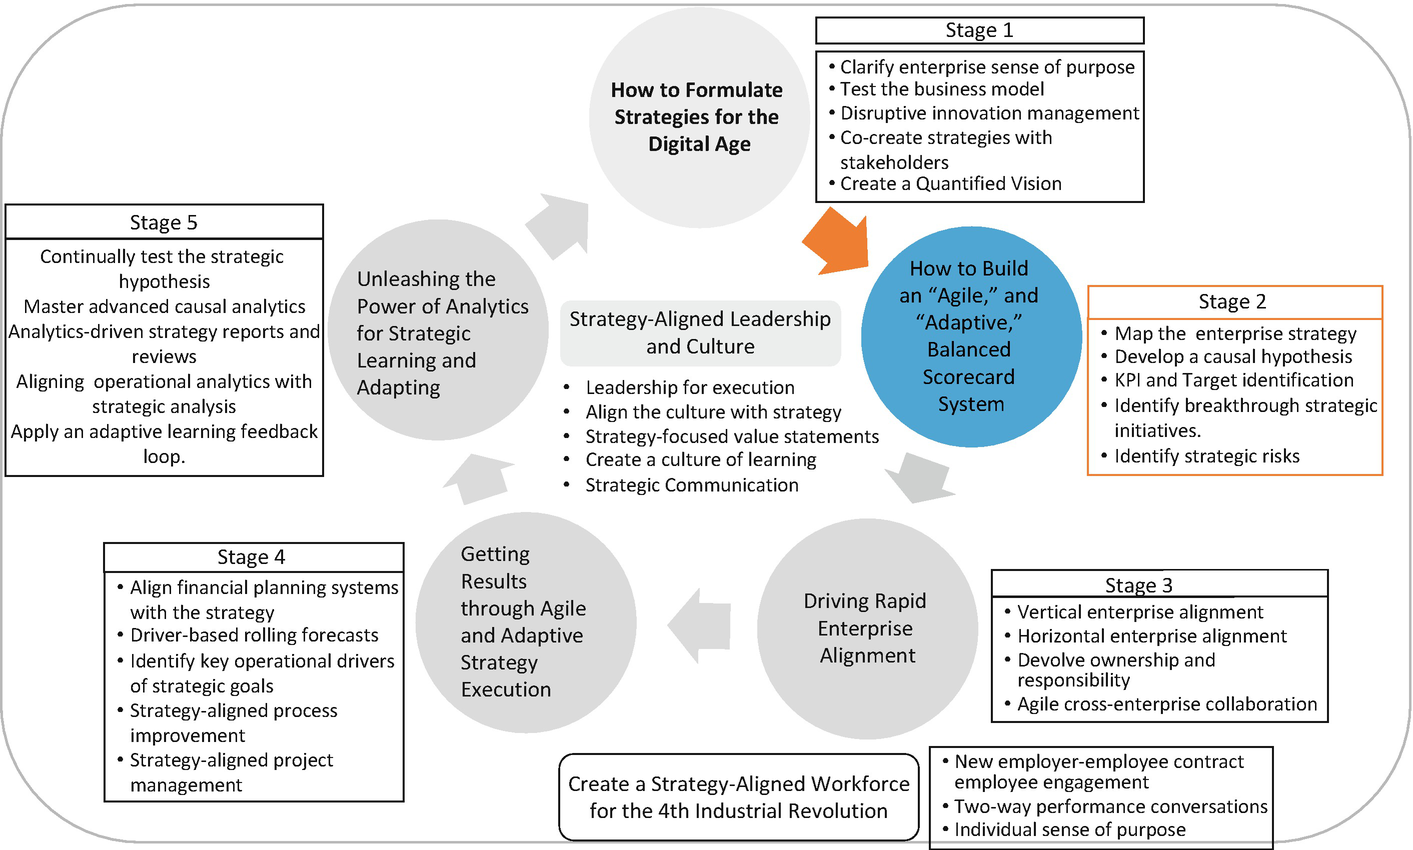
Stage 2: How to build an “agile,” and “adaptive,” Balanced Scorecard System
A trap to avoid is automatically assuming, when writing the objective, that the customer is referring to your organization. When they say, for instance, “Be my preferred partner,” it’s important to realize that they are saying that they would like a preferred partner, but that does not necessarily mean it has to be your organization. In such an example, it’s important to think through what they mean by preferred partner and to ensure that through the work done in the supporting enabling objectives they choose your organization over other candidates.
“To Satisfy Our Customers, and Stakeholders, in Which Internal Business Processes Must We Excel?”
This is the perspective where the wording is generally fine (unsurprisingly, as it is takes us into the world of operations, which most leaders are more comfortable with than strategy).
To Achieve Our Goals, How Must Our Organization Learn and Develop?
Typically, the learning and growth perspective is the least well thought-out. The people objectives are usually generic and vague, such as “create a high-performance culture”, “satisfy employees,” “live the values,” and so on. This holds true for the information objectives; “Support the organization with good information systems” being one common example. Again, organizations miss out on a golden opportunity to think through the people and technology capabilities required to deliver the internal processes to the expected level of excellence.
An organization that one of the authors worked with in 2017 had a set of learning and growth objectives that were very generic and, as they explained, not really of much value. Doing the change agenda led to a switch from an objective of “Recruit, develop and retain talent” to “Recruit talent to be [regionally]-focused,” which is from where the significant market growth was to come.
Furthermore, keep in mind that the learning and growth perspective is not an HR perspective or an IT perspective; it is an enterprise-wide perspective. It is too easy to hand this section over to these functions “to sort.”
Keeping Strategy Maps Focused
This brings us to another general mistake in Strategy Map development. There is a common belief that the map should reflect all areas of the business critical for making strategy: “everyone’s everyday job.” This often leads to maps that, and with little more than minor tweaks, are applied to any organization (a common gripe from managers that have to apply scorecards). Moreover, it oftentimes leads to “big” Strategy Maps of, say, 25+ objectives. Ideally, Strategy Maps should be limited to around 15 objectives and perhaps less.
Although appropriate for a Strategy Map that supports incremental growth in a relatively stable marketplace, capturing the whole of the organization is not useful if the firm is driving transformation change, with a dramatic shift in market or product focus.
This was the case with the example above of the organization looking to become regionally focused within one rapidly growing sector—and to support an extraordinarily rise in revenues over the timeline of the strategy.
Previously, this organization focused on a different region and on serving several sectors (albeit with similar technologies). The map they had originally developed tried to capture all parts of the business and, so, was very generic, which came out very strongly during the executive interviews held as part of creating the new map. Getting the leadership team to understand that this was not required led to the shaping of a map that focused on growth within the new region and in one sector. The CEO said, “We now have a map that we can truly call our own.”
This is not to say the other work going on in the organization was not important, just not the current strategic focus. In such instances it might be useful to relabel the map as, in this case, a Growth in [region] Map. Good internal communications is required to ensure people understand that their work is still very important and indeed might be the next focus area. In addition, these parts of the enterprise must still align to the strategy and how to do this is something we consider in Chap. 6.
Objective Statements
Objective statements provide a fuller description of the objectives on the map (which due to the constraints of space are limited to a few words). At the outcome levels, the description details (typically in a single paragraph) what the objective will look like if achieved. At the enabler levels, it explains why the objective is strategically important (how it delivers outcomes) and achieved (what needs to be done) and two paragraphs will suffice.
Case Illustration: Hospital Complex
As an example, a hospital complex had an internal process objective to, “Assure service and process excellence & optimize the customer experience.”
Key to our success is ensuring that from entering to leaving the hospital the patient’s experience is as comfortable and stress-free as possible.
[This explains why it is strategic important in delivering the customer objective of, “Provide me with the highest quality of care in a safe and respectful environment that is easy to navigate.”]
We will achieve this through implementing an end-to-end process that seamlessly integrates the process steps from the point at which the patient enters the hospital system, through the coordination of care whilst the patient is within the hospital, and finally to how the patient is discharged from the facility.
[This explains how the objective will be delivered and thusly the customer objective – cause and effect].
In effect, the objective statements collectively tell the story of the strategy and the underpinning causal assumptions (and can be easily woven together to create a single value narrative). From these statements, value drivers are drawn, which makes the identification of KPIs a relatively straightforward task (see next chapter). They are also helpful in identifying strategic risks (see Panel 1 and the next chapter).
Consistent Interpretations
Another key benefit of objective statements is that they ensure a consistent interpretation of the objective as it threads its way across the enterprise. The fact is the senior leadership team, which agrees on the objectives, will have a shared understanding of the importance and meaning of the few words that describes them (or at least should).
But, outside of the leadership team, people will put their own interpretations onto the meaning—often function-centric, leading to misalignment rather than alignment. For instance, the senior team might have a clear understanding of the importance and meaning of “Develop a High-Performing Culture” but this will mean many different things to many people.
Advice Snippet
At the outcome level, just describe why the objective is strategically important—this represents the desired result
The enabler level describes why the objective is important for delivering to the outcomes as well as how the objective will be delivered (perhaps three components)
Complete the financial objective statements first, and then customer, internal process, and learning and growth. This is critical for visualizing cause and effect
Keep the statement short. One paragraph explaining the strategic importance and (at the enabler level) a second describing the how (which might be listed as bullet points)
Pull the statements together to create a value narrative. This is valuable for communication purposes and for telling the story of the strategy in more detail than can be provided through a Map.
The Value of Strategic Themes
When thinking about alignment and the cascade of the scorecard system, it is worth considering the use of strategic themes, through which strategic objectives are grouped into several categories within a Strategy Map—such as customer management, innovation, operational excellence, and so on (as it is easier to align devolved functions etc., more directly to a specific theme).
In an interview with Dr. David Norton, he described the power of Strategic Themes. “Strategy is about delivering solutions to common challenges that the organization is facing, and this is at odds with a vertical structure,” he explained. “By identifying and laying out strategic themes on a map, organizations are able to overlay a horizontal form of management onto the necessary hierarchical structure.”
Designing Themes
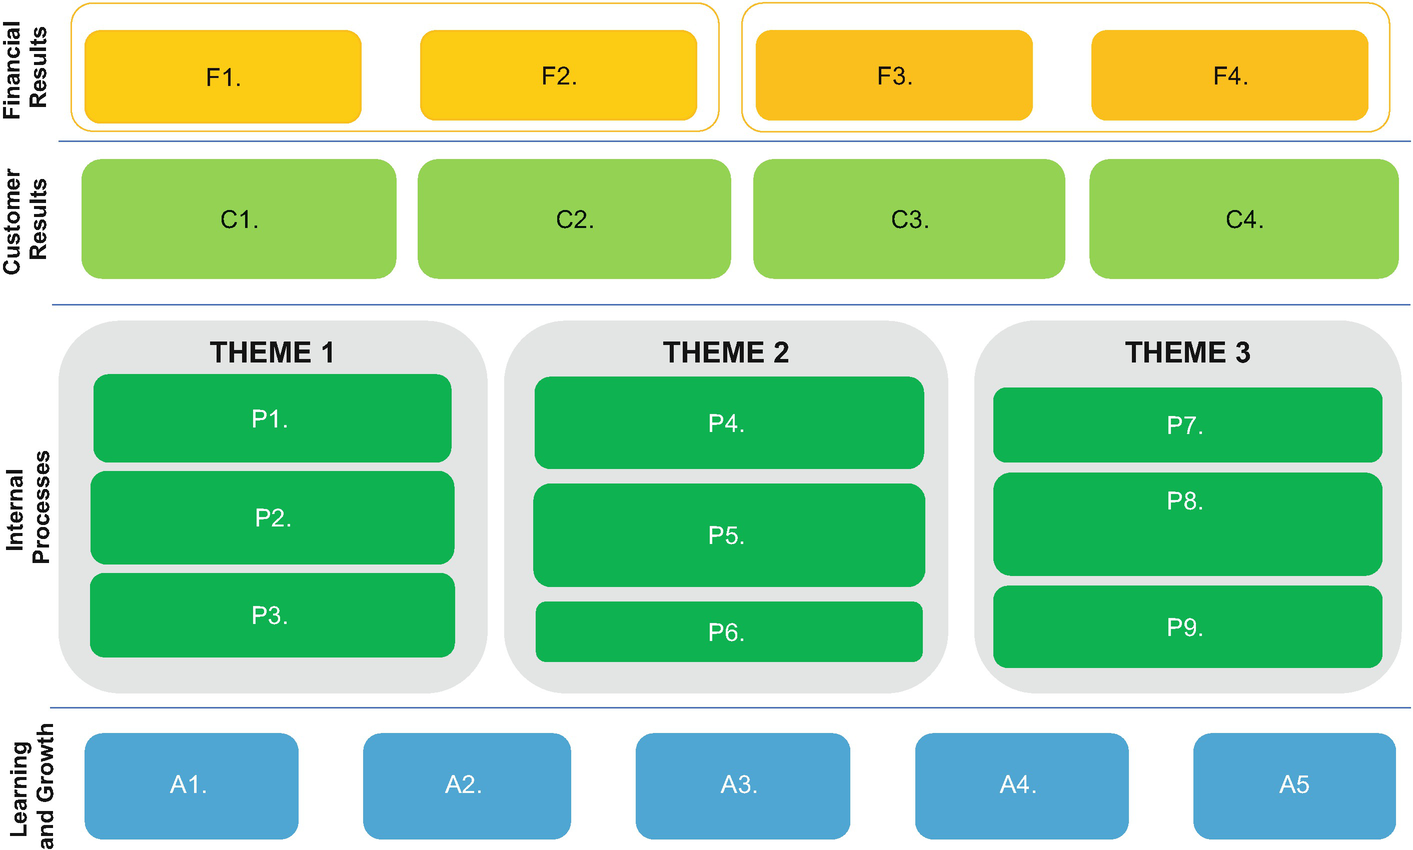
Strategic themes within the internal process perspective
Together, these themes delivered the customer outcomes and from that financial results. However, organizations have since shaped themes according to their own needs and oftentimes across perspectives. Arrangements vary.
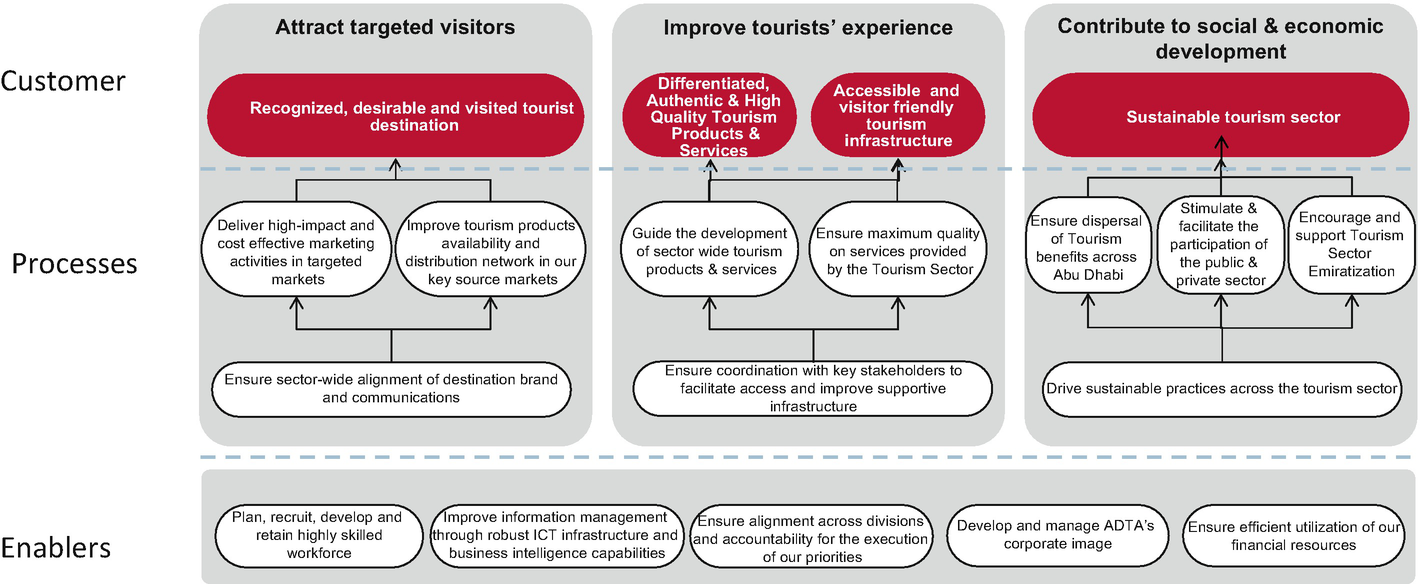
Example of strategic themes within customer and internal process perspectives. (Source: Palladium)
Case Illustration: AW Rostamani
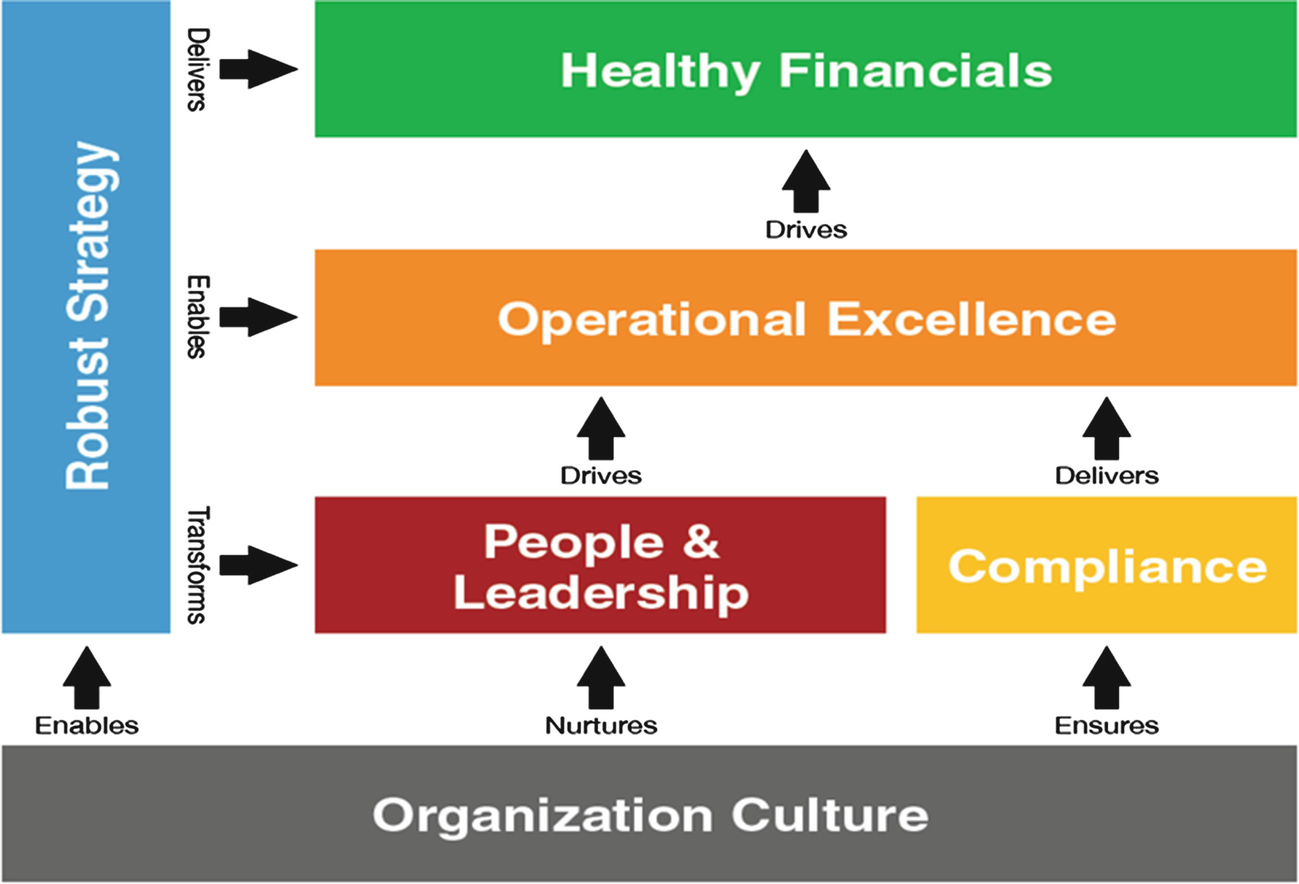
A.W. Rostamani strategic pillars
As an aside, its new corporate-level Strategy Map is designed in the shape of a car, something that one of the authors advised them to do as they were seeking a more impactful and inspiring way to use the map as a communication vehicle.
Constructing Theme Teams
Whatever the construct, a member of the executive leadership team must lead the “Theme Team.” Only they have the power to drive the end-to-end process changes required to deliver transformational change, as well as the authority to second the resources required to work on strategic initiatives (functional heads typically balk at losing their “star” performers—the most likely candidates for large and potentially complex change projects).
A team of managers support the theme leaders and are responsible for the specific objectives within the themes—and supporting KPIs and initiatives.
Potential Downsides of Working with Themes
We must stress, however, that managing strategy through themes does come with some “watch outs” that might lead to them being performance-blockers rather than enhancers.
Although enabling executives to separately plan and manage each of the key components of the strategy, themes still need to operate coherently. That is, working together as an interdependent whole that collectively delivers strategic success.
A real danger is that themes default to into new, function-style silos, in that the members of the team focus only on their theme and ignore the others on the Strategy Map: encouraging battles for scarce cross-enterprise resources between theme owners.
Frederick W. Taylor’s message (see Chap. 1) is well ingrained in the subconscious of most organizations.While asking a sub-team to manage a ‘mini’ Strategy Map, focused on a specific theme area, may ensure the successful achievement of the strategic theme, it may also result in sub-optimizing the achievement of other strategic theme areas and/or the entire business strategy.
Moreover, and as Richardson says, cause and effect, or causality, typically does not work in a strictly linear fashion, which is something people often lose sight of when working with themes. As an example, one of the authors advised a government organization, working in a country in which contractor treatment of low-wage migrant workers was a significant issue, that the “partner management,” objective within the “Outsource and Deliver” theme directly impacted the “national and global reputation,” objective within the “Customer Excellence” theme. As they were located in different themes the causal relationship was easy to overlook. Not managing this causal relationship carefully could have led to devastating consequences.
The Power of Cause and Effect
Something that organizations usually overlook, or to which they at best give perfunctory attention, is the causal relationship between the objectives (and indeed elements of the statement).
Most Strategy Maps that we see are not maps, but simply a collection of objectives—useful for communication purposes and for providing a succinct view of the strategy, but not for visualizing, and from that, testing the underpinning causal assumptions. A splattering of “arrows” throughout the map purportedly demonstrate a causal relationship. When reviewing Strategy Maps, we ask leaders to explain their hypotheses as to how improvements to a learning and growth objective will eventually deliver financial (or stakeholder) outcomes.
Normally, the answers are somewhat vague and hesitant. We will then ask for a written description of the causal relationship. If the map is collocated per strategic themes (as examples, customer focus, operational excellence, and innovation), we ask for a description at the theme level. This strategic performance narrative proves a powerful mechanism for leaders to gain a better understanding of their hypothesis and the causal assumptions (and is a critical purpose of the objective statement). Historically, cause and effect analysis has not been a standard practice of most scorecard users. The “arrows” placed on maps are rarely validated.
To be fair, there are good reasons why, historically, the required attention has not been given to causality. We simply did not have the organizational capabilities (people skills and software) to do this work. Or rather, it could be done by hiring a boatload of very expensive statisticians—rarely feasible. Advanced data analytics make this task relatively straightforward and financially viable (see Chap. 9).
Furthermore, the need to understand causality is precisely why weightings should not be used in a Balanced Scorecard system. This is a long-held argument in the strategy execution community, and we present our arguments against weightings in Panel 1.
Age 2 Balanced Scorecard Systems
Within Chap. 1, we outlined Dr. David Norton’s thoughts regarding Age 2 Balanced Scorecard systems. Age 1, he argues, was essentially about building scorecards, communicating strategy, and alignment. All of these are still important and the foundation for Age 2.
Causal analytics is one of the components of Age 2 systems. Although we discuss analytics in detail within Chap. 9, where we explore some of the advanced data analytics tools that can now be used to gain better insights into the performance of the strategy (big data in particular), it is important to discuss here—for one critical reason. Perhaps for the first time since Strategy Maps were introduced to the strategist’s toolkit, we are finally able to realize the promise of the map—to describe, manage, and test cause and effect.
The Contribution of Early Pioneers
Although advanced data analytics is enabling causal understanding, it is not an Age 2, or digital-age, evolution. The map’s value for doing this was precisely why Strategy Maps evolved out of the first generation Balanced Scorecard—that did not include maps.
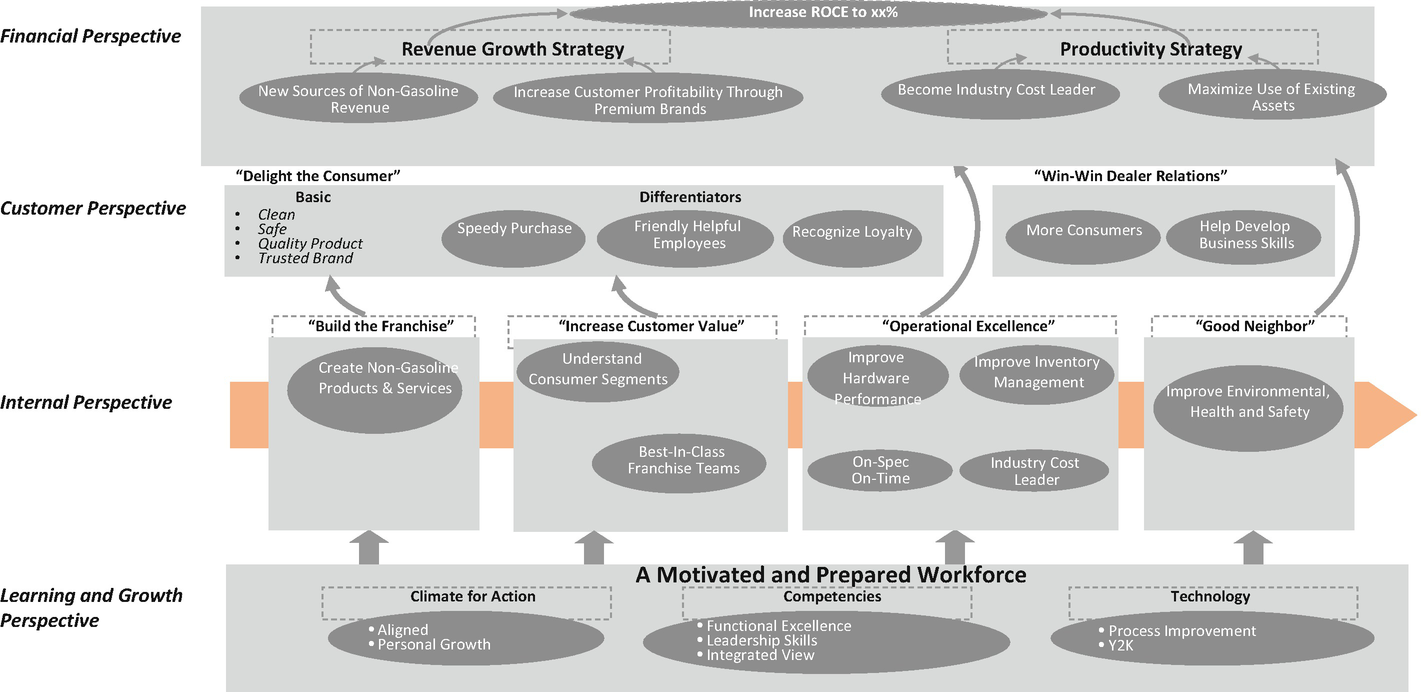
Mobil oil linkage model for 1994
The value identified by the pioneers was in laying out a cause-and-effect relationship, thus, understanding how progress to one or more enabler objectives delivered the desired outcomes. Indeed, it transformed the Balanced Scorecard System from a “balanced” measurement system to a full-fledged strategy execution model. Dr. David Norton has said that, “The idea of the Strategy Map was as important an insight as the original Balanced Scorecard framework.”
However, analytical tools are only of value if there’s an understanding of the causal assumptions. Organizations require the discipline of ensuring that when formulating objectives (and this starts with the Strategic Change Agenda), cause and effect is at the front of the mind. Explain how these customer objectives will deliver the financial results, how the internal process objectives deliver for the customer, and—the one relationship that is typically not considered well—how the learning and growth objectives deliver the internal processes.
There’s an important caveat here: do we accept the premise that improving capabilities within the learning and growth perspective leads to the effective delivery of strategic processes and from that the realization of customer and financial outcomes? Yes, we do! Do we think that the causal logic of a map accurately describes how value is created in an organization? Well, not exactly. This requires some explanation, which leads to the wandering into the world of mechanics. Specifically, the differences between classical and quantum mechanics and how this relates to our understanding of how Strategy Maps work.
Classical Versus Quantum Mechanics
Classical mechanics tells us (among other things) that if we pull a lever in one place a predictable result will occur elsewhere. The basics of the laws of cause and effect. Quantum mechanics (admittedly at the level of the particle) tells us that for any initial situation, there are many possible outcomes and effects, with different probabilities: cause and effect is not deterministic—we cannot predict an effect, just calculate probabilities.
A lot of the literature shows that we’ve inherited a cause-and-effect, central control form of management from Newtonian physics. The idea that we have a clockwork mechanism where there are levers within levers and that we can predict that if we pull a lever in one part of the organization it will have a predictable effect elsewhere… And strategy mapping reflects that to some degree.
There’s a lot of evidence now that cause and effect is not a model that represents reality. “The real world is an eco-system and is more quantum mechanics. Things move around and are inter-dependent and more chaotic.”
He added that, “What we’re seeing now is a movement away from the Newtonian model to one that is more organic, more devolved, more adaptive and more flexible to change.”
Hope’s comments further underline the dangers of applying agile software development thinking to strategy. Predictability is an issue.
The Intellectual Capital Model
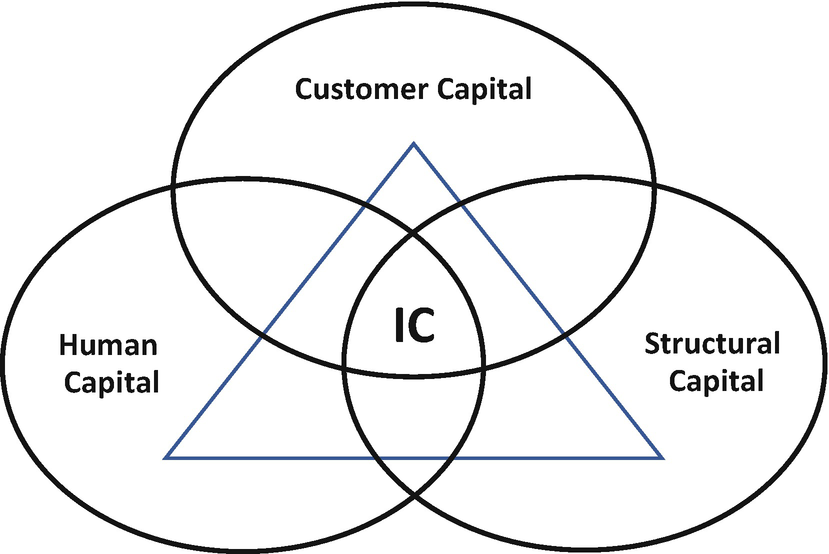
Intellectual capital model
That said, the actual drivers of the value created is not easy to isolate. Cause and effect is at best implied. However, although a useful model for visualizing value creation, such a model is extremely difficult to put into practice.
Interactions Between Intangible Assets
The value of an intangible asset is influenced by its interaction with other intangible assets.
It is difficult to isolate the value of one asset.
The value of an intangible asset is determined by its impact on other variables.
These observations relate to the intangible assets found in the learning and growth perspective, but it is hardly a stretch to extend to process and customer assets (as described in the Intellectual Capital model).
Parting Words
In an interview with Dr. Norton , he stated that when it comes to describing how value is created, a Strategy Map sacrifices some degree of precision for practical usability (a 2D map rather than a 3D model) and that this was a conscious decision. “That organizational value is not quite delivered according to the flat cause and effect assumptions within a map, but the relationships provide a strong enough picture and narrative to overcome the negatives of imprecision.” A recognition, perhaps, that value creation is as much about quantum as classical mechanics and that both have a place in managing strategy.
The fact is that to manage performance effectively, we need structure, process, and, not least, a roadmap to follow. A Strategy Map provides this performance management framework very well—and, in doing so, conforms to classical mechanics. Beleaguered managers require such aids.
Panel 1: Why Weightings Should Not Be Used in the Balanced Scorecard
For more than two decades, there has been a continued debate on the rights and wrongs of using weightings on a Strategy Map and Balanced Scorecard. Passions run high on both sides of the divide.
We take a firm and thus far unequivocal stance with regarding map/scorecard weightings. They should never be used. The reason—they make zero sense. And here’s why:
Where Do We Place the Weightings?
A Strategy Map describes the causal assumptions regarding the capabilities that work together to deliver ultimate strategic success. Put simply, objectives within the learning and growth and internal process perspectives enable successful outcomes within the objectives at the customer and financial (or stakeholder) level. If that is accepted, then where exactly do we place the weightings?
At first glance, it might seem logical to give the highest weightings to the financial objectives; after all, these are the ultimate measure of a commercial organization’s success. However, in keeping with the logic of the Balanced Scorecard system, these are simply the result of success within the other perspectives. So, it makes no sense to place the highest weightings here, as the results cannot be delivered without succeeding to customer and enabling objectives. Similarly, customer objectives are the outcomes of what happens within learning and growth and internal process: so, putting the highest weightings here is equally nonsensical.
Therefore, the conclusion might be that we should place the highest weightings on enabler perspectives, as this is how success is driven. But, what precisely is the purpose of having great scores for enabler objectives if the customers are leaving and the financials are nose-diving?
An Overall Scorecard Score!!!
Many organization like the idea of coming up with an overall “scorecard score.” We struggle to see the point of this. Balanced Scorecard managers have said to us, and with great pride in their voices, things like, “I have a score of 90 on the scorecard.” We have absolutely no idea what that means!
How to Prioritize Without Weighting
Of course, executing strategy is about prioritization. We do not argue against this, but weighting is not the way it is done. Prioritization should be through the resources that are committed to the designated strategic initiatives and process improvements, as this is how performance is enhanced.
Prioritizing Through Themes
This is one reason why themes are so useful on a Strategy Map. If, for example, there’s a requirement to pay attention to the cost structure, then the bulk of the investments might go to initiatives and process improvements supporting an operational excellence theme. Conversely, if revenue generation is a priority, then the investments might be directed to an innovation theme.
In fact, at the outset of the financial crisis, some banks kept their Strategy Maps unchanged. They did not apply weighting, but did divert investments from growth to cost management themes and interventions. What these firms concluded was that, despite the severe pressures they were experiencing, the strategy was still valid and that, over the longer term, all themes/objectives remained of equal value. Just the short-term focus changed: after a while, the focus shifted.
Even when there isn’t a “crisis,” or an urgent requirement, due to funding issues, organizations still need to prioritize their investments over the lifetime of the strategic plan. This often means focusing more attention on certain themes/objectives than on others for a specified time frame. There is nothing wrong with this, and the sequencing of these investments is simply good management.
Weighting and KPIs
Furthermore, neither should we use weightings to prioritize KPIs. We argue that this suggests there has not been enough rigour in selecting the measures that most accurately assesses how well the organization is delivering on its objectives. So, the solution for too many organizations is to throw many potentially useful KPIs together, arbitrarily assign weighting, and come up with a collective score. This approach provides little insight into the drivers of performance improvement—but does create a lot of confusion.
Moreover, if the average score is green on a traffic light system, precisely what information does this provide into the drivers of performance? (See also the next chapter, where we discuss KPIs in detail).
A while back, one of the authors listened to Professor Robert Kaplan make a presentation on aligning incentive compensation to the Balanced Scorecard. At one juncture, he casually commented (more as an aside than anything else), “By the way, this is the only time weightings should be used in a Balanced Scorecard implementation.” We can’t argue with that.
Panel 2: Identifying Strategic Risks
There have always been risks attached to strategy execution, but with so many variables in play these days, it is ever present. In this the digital economy, successfully implementing strategy is about keeping one eye on performance and the other on risk. One without the other is not enough. Conventional Balanced Scorecard systems only consider the performance view, with Key Performance Indicators (KPIs) providing the evidence of success (or otherwise) of strategic objectives.
Risks Do Not Belong on a Strategy Map
Some organizations will claim that they cater for risk through its inclusion on a Strategy Map—as a theme, or even an objective. We’ve even seen it captured as a separate perspective. However, although common in the early days of the scorecard, we agree with Dr. Robert Kaplan, who said to one of the authors in an interview that, “risk management would become a strategic theme that would appear on the Strategy Map, alongside other themes such as customer service management and operational excellence. I now advocate that risk should not be on a Strategy Map at all, be that as a theme, perspective or objective.”
He explained that the Balanced Scorecard is about managing and delivering performance, not mitigating risk, and that risks impact every objective on the Strategy Map, both financial and non-financial.
However, as a caveat, if the organization has a strategic need to develop risk management capabilities, then this might appear as an objective within the internal process perspective. This is very different from managing risks.
To manage risk effectively, we need a definition. “A key strategic risk is the possibility of an event or scenario (either internal or external) that inhibits or prevents an organization from achieving its strategic objectives” [2].
Note that a strategic risk event is a tangible occurrence. It is something that happens. Staff turnover is not a risk event, as turnover is an everyday reality of any business, although a defined loss of capability against a strategically critical skill might well be.
Although there are various ways to identify key strategic risks, one useful technique is to pose a \Key Risk Question (KRQ). For example, “What circumstances might lead to a degradation of processing accuracy?” might be a KRQ for the strategic objective “improve application processing accuracy,” in a financial services company. A key risk event might be described as “the risk of a failure to achieve standards of processing accuracy caused by the loss of key staff resulting in the deployment of inexperienced staff.”
Note that the strategic risk event is articulated as “the (key) risk of (what, where, when) . . . caused by (how) . . . resulting in . . . (impact).”
The Risk Bow-Tie

The risk Bow-Tie
When using the Risk Bow-tie, start by focusing on events that could prevent the achievement of the strategic objectives. Once these are listed, start to develop as many potential causes as possible that will lead to the event happening and therefore the risk materializing.
Creating this long list of causes will help clarify thinking about the risk and form the base of a consolidated list of causes that are documented alongside the risk. This process is repeated for consequences.
Risk Heat Maps
With the strategic risk events identified, we sequence to assessing whether that risk will materialize and the effect on the organization if it does. This assessment often begins with a “Likelihood and Consequence” matrix. This simply plots on a vertical axis the likelihood of a risk materializing and the consequence to the organization if it does. The point where likelihood and consequence meet determine the risk’s position on the matrix (the Risk Heat Map) and therefore the level of urgency for risk mitigation.
Four Perspective Risk Map
While the Risk Heat Map is a well-known tool, one innovation (pioneered by Andrew Smart, CEO of Ascendore and explained more fully in a 2013 book by Smart and Creelman) is a Four Perspective Risk Map [3]. This brings key risks together, enabling their visualization in relation to each other.
The Four Perspective Risk Map enables organizations to focus on risks in each perspective and explore the relationship between risks across perspectives and to identify risk clusters. For example, one organization that uses the Four Perspective Risk Map focuses attention on the risks within the outcome perspectives—financial and customer—as a starting point for their monthly risk review. The senior team explores the causal relationship between objectives, using both the Strategy Map and Four Perspective Risk Map, believing that taking this approach enables them to manage and monitor the delivery of their strategy.
What level of risk are we taking?
What level of risk are we exposed to?
What are our main exposures?
Just as KPIs track performance to strategic objectives via a scorecard, KRIs monitor exposure to key risks on a “Risk Dashboard” (we prefer the term dashboard, simply to differentiate from the performance-focused scorecard). We discuss KRIs in the next chapter.
Self-Assessment Checklist
The following self-assessment assists the reader in identifying strengths and opportunities for improvement against the key performance dimension that we consider critical for succeeding with strategy management in the digital age.
Self-assessment checklist
Please tick the number that is the closest to the statement with which you agree | ||||||||
7 | 6 | 5 | 4 | 3 | 2 | 1 | ||
My organization has a well-developed Strategy Map or similar | My organization has not developed a Strategy Map or similar | |||||||
We articulate customer-facing strategic objectives from the starting point of the value they seek | We articulate customer-facing strategic objectives from a standpoint of what we want from the customer | |||||||
Our strategic objectives have well defined descriptions | Our strategic objectives have poorly defined descriptions | |||||||
We have a very good understanding of the causal relationships between objectives | We have a very poor understanding of the causal relationships between objectives | |||||||
Generally, our people-related objectives are specific to the needs of the organization | Generally, our people-related objectives could be applied to any organization | |||||||
In my organization, we very closely consider the relationship between intangible measures | In my organization, we only consider intangible measures in isolation | |||||||
We place very high importance to the weighting of individual objectives | We place very low importance to the weighting of individual objectives | |||||||
We have a very good understanding of the key strategic risks to the organization | We have a very good understanding of the key strategic risks to the organization | |||||||