Introduction

Stage 2: How to build an “agile,” and “adaptive,” Balanced Scorecard System
Too Many KPIs
Too often, Balanced Scorecards are excessively big with too many KPIs (and that have often been poorly designed) and the scorecard process is viewed by most people in the organization as little more than a quarterly chore of reporting a “score.”
The strategy office (perhaps called an Office of Strategy Management—OSM—see Chap. 9: Unleashing the Power of Analytics for Strategic Learning and Adapting) spends all its time managing the scorecard, rather than using the scorecard to manage the business better. As we’ve been told on many occasions, “They’re a bunch of data chasers.” The process is fixed, inflexible, and cumbersome—the antithesis of agile or even adaptive.
As a starter, scorecards should have a limited number of KPIs (perhaps two for each of say 15 objectives), supported by about a dozen high-impact initiatives. Although quarterly reporting might still be appropriate (for formal governance reasons—although the reports should be much smaller than is typically the case), the data and insights must be available and applied on a more frequent basis (see also Chap. 9). Agility becomes possible.
Agility in Strategy Execution
Agility in strategy execution means being able to rapidly shift positions to exploit opportunities or mitigate risks—to capture, interpret, and act on data and insights in as close to real time as possible. Although strategy and operations are different things, this is where we are beginning to witness a blurring of the lines (see Stage 4, Getting Results through Agile Strategy Execution, Chaps. 7 and 8).
Before we get to execution and with the Strategy Map and objective statements agreed, we first need to identify the KPIs, set targets, and put in place the strategic initiatives. Alas, many organizations struggle with each of these three steps.
The Purpose of KPIs
We agree with the observation of Mihai Ionescu, Senior Strategy Consultant at the Romania-based Strategsys, on the challenges of identifying the relevant measures for each strategic objective. “This is where the operational and strategic views intersect,” he says. You can often hear during workshops opinions such as, “We’ve always measured this KPI, so we should find a place for it in the scorecard,” or “I’d like to see these additional KPIs in the scorecard, to have a more complete picture.”
“This is what “translation” means for too many people; so, it’s no wonder that the Balanced Scorecard soon becomes an unbalanced KPI system with lots of analytics that often succeed in masking its fundamental focus on the most important aspects and changes that will bring the strategy to life.”
We also concur with the view of James Coffey, Principal of the US-based Beyond Scorecard, that the right strategic measures focus attention onto two things: (1) strategic discussions and (2) decision making.
Why did this happen?
What do we need to do?
What has changed that may require adapting our strategy?
What new initiatives do we need to improve performance?
Is this a temporary dip with no action needed?
What changes are needed to our strategy?
Coffey continues, “For strategic measures to be meaningful, leaders have to encourage accurate and honest reporting. The first time someone is punished for reporting poor results everyone else will do whatever is necessary to game the results.”
- 1.
Will leadership care about the results? If all they do is review them but not discuss them, then they are not strategic.
- 2.
Will they drive the right behaviours? If they are easily gamed, then it is vital to determine if the organization is doing the right things or merely doing what it takes to be green regardless of the overall impact on the strategic goals.
- 3.
What are the risks associated with the performance? Strategic measures also drive risk discussions. They support assessing and understanding the consequences of not addressing risk.
Four Steps of KPI Selection
- 1.
Write the objective statement (which comprises both the strategic reason for the objective as well as how it will be achieved, see the previous chapter)
- 2.
Identify the objective value drivers (the most critical capabilities and relationships that must be mastered if the objective is to be delivered).
- 3.
Ask a Key Performance Question (KPQ) for each of the drivers (what is the most important information that we need to know about performance with regard to this driver).
- 4.
Select the most impactful KPIs (and keeping in mind the objectives/KPIs that it drives in the ascending perspective).
Key Performance Questions Explained
Before providing a practical example, perhaps a note of explanation is required for KPQs, with which readers will likely be less familiar than KPIs.
Albert Einstein once said, “If I had an hour to solve a problem and my life depended on the solution, I would spend the first 55 minutes determining the proper question to ask… for once I know the proper question, I could solve the problem in less than five minutes.”
The great physicist’s words are always front-of-mind when we begin the process of selecting KPIs to support strategic objectives. Rather than which indicator to choose, better to think about which performance question any KPI will help to answer.
An innovation of LinkedIn influencer Bernard Marr (and explained fully in the book by Marr and Creelman Doing More with Less: Measuring, Analyzing and Improving Performance in the Government and Not-For-Profit Sectors, − [1],) a KPQ focuses on and highlights what the organization needs to know in terms of executing strategic objectives. Enabling a full and focused discussion on how well the organization is delivering on these objectives, KPQs also serve as an important bridge between organizational goals and KPIs. Too often, organizations jump straight from objectives to KPIs without truly understanding the performance issues the indicator will help address.
Case Illustration: Hospital Complex
As a practical example of the four steps and continuing with the hospital complex example from the previous chapter, the organization has an internal process objective to “assure service excellence & optimize the customer experience.”
Step 1: The Objective Description
Key to our success is ensuring that from entering to leaving the hospital the patient’s experience is as comfortable and stress-free as possible.
We will achieve this through implementing an end-to-end process that seamlessly integrates the process steps from the point at which the patient enters the hospital system, through the coordination of care whilst the patient is within the hospital, and finally to how the patient is discharged from the facility.
Step 2: Value Drivers
At the internal process and learning and growth levels, a driver-based model is applied to the achievement section (how the objective will be achieved). At the outcome level, it is applied to the results.
When using a driver-based model, the leadership team discusses what are the most important capabilities or relationships required for successful achievement. Perhaps three key drivers are chosen and are often listed in the “how,” section of the objective statement. Here, the focus is on the wording of the objective statement, not the objective itself.
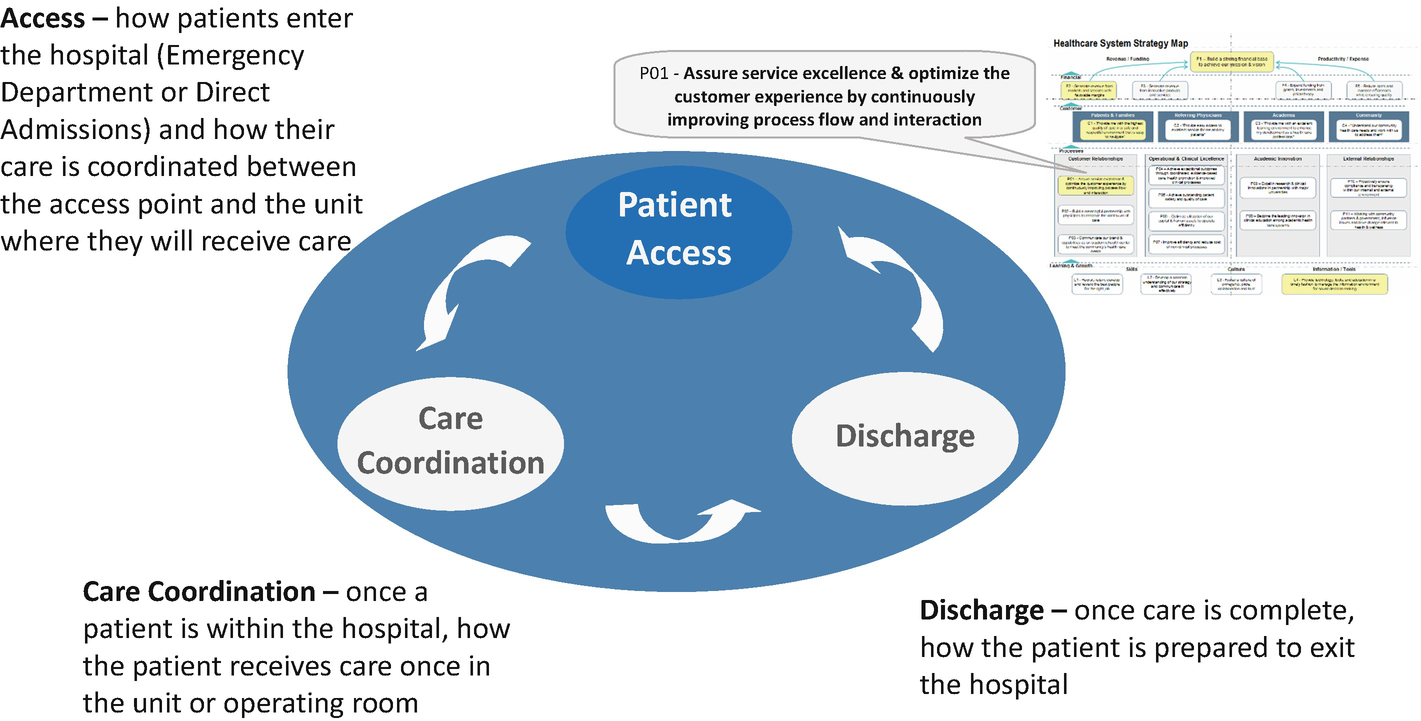
Three sub-processes of hospital example strategic objective
Step 3: KPQs
A KPQ for patient access might be, “how well do we understand the patient’s needs from booking the appointment to entering the hospital?” For care coordination, “to what extent are departments sharing information to maximize the quality of care?”
Note that the KPQs are phrased to focus on the present and the future, not on the past. This opens a dialogue that enables managers to do something about the future rather than simply discussing past performance.
Step 4: KPIs
The discussion around the KPQ invariable leads to the identification of the most relevant and impactful KPIs.
For the hospital complex, a KPI for, “how well do we understand the patient’s needs from booking the appointment to entering the hospital?” might be: “percentage of patients that are very satisfied with the pre-admission process?”
For, “to what extent are departments sharing information to maximize the quality of care?” a KPI might be, “internal departmental satisfaction with the quality of patient information received from other departments?”
Case Illustration 2: Durham Constabulary
KPQs helped the UK-based Durham Constabulary convert the strategic objective, “Tackle Criminality,” into relevant KPIs. The objective had three supporting KPQs, including “How well do we prevent people from becoming criminals?” which was assisted in being answered through a KPI that measured the “Number of first time entrants as a percentage of all persons arrested” as well as KPIs around re-offending rates and the percentage of the population who are offenders.
In Doing More with Less, Durham Constabulary’s Head of Performance and Analysis, Gillian Porter commented that KPIs were still vitally important within the constabulary, but that the KPQs put these metrics into context. “…there’s a tendency to measure things that are easy to collect data against and performance can get skewed as a result.” She added that indicators can be dangerous things, especially when you get hung up on targets. “Now the focus is moving to identifying solutions rather than just performance against the indicators. It’s becoming more about the conversation than the numbers” [2].
Interestingly, the Constabulary ensured that all strategic actions had to be justified against the objectives and KPQs: note - not the KPIs. Moreover, note the highlighting of the importance of the conversation. This signals that a KPI is the beginning of a conversation, not the end. The intent should be to improve performance, not simply to hit a target.
Advice Snippet
- 1.
Design between one and three KPQs for each strategic objective on your Strategy Map
- 2.
Create short and clear KPQs
- 3.
KPQs should be open questions
- 4.
KPQs should focus on the present and future
- 5.
Use your KPQs to design relevant and meaningful performance indicators
- 6.
Use KPQs to refine and challenge existing performance indicators
- 7.
Use KPQs to report, communicate, and review performance
In performance reporting and communications, organizations should always put the KPQs with the performance data. This way, the person who looks at the data understands the purpose of collecting this data and is therefore able to put it into context.
The Balanced Scorecard Is Not a Measurement System
The four-step process is a relatively straightforward yet effective mechanism for identifying KPIs . Indeed, get the first three steps right and the KPIs are obvious, as numerous practitioners have told us.
Yet (as well as the criticality of the conversation) something we continually struggle to get organizations to understand is that, despite popular belief, the Balanced Scorecard is not primarily about measurement. As Mihai Ionescu, Senior Strategy Consultant at the Romania-based Strategsys says, “The Balanced Scorecard is not a measurement system. It is a strategic communication and decision-support system.”
He continues, “It organizes, in a traceable way, the chains of hypothesis used in formulating the Strategy and in planning its execution, around the strategic causality concept, enabling the management team and the entire organization to participate in defining them, in identifying the invalid hypothesis, along the execution cycle, and in adapting the Strategy and the Strategic Plan accordingly.”
KPIs are an important component of that system, but only third in the hierarchy of importance. First is the Strategy Map (that visually describes the intended results (outcomes) and the capabilities and relationships required for their delivery (enablers). Second is the initiatives (supported by process improvements) that deliver change. KPIs are simply a mechanism for monitoring performance to an objective.
No “Perfect” KPI
With the obsession on measures, there’s a tendency to spend an inordinate amount of time finding the perfect KPI. As if by doing so, performance will automatically improve. Marginally perhaps, as people do pay for attention to what they are measured on (which is not always a good thing, see below) but step-change transformational change will certainly not happen.
Moreover, identifying the “ideal” KPI is notoriously challenging. We often end up selecting many KPIs, in the hope that, somehow, they will meld together into something that is perfect. Consequently, the scorecard system becomes a bloated and impermeable mechanism for capturing and reporting measures.
Quite simply, there is no such thing as a perfect KPI. As Bjarte Bogsnes, Senior Advisor, Performance Framework, at the oil and gas giant Statoil comments, “There are good KPIs and good combinations of KPIs, but not a perfect KPI. Believe me; I spent many years searching for them.”
Moreover, although we have more than 500 years of experience of working with and evolving financial KPIs (double entry bookkeeping was invented by a Venetian monk in 1492), we have only relatively recently began working with non-financial measures. Therefore, our understanding is a lot less mature—thusly, a long way from anything close to perfection.
Also, seeking the perfect strategic KPI for a non-financial objective is something of a red herring. These KPIs differ from most of their financial counterparts in that they are rarely of value in isolation and are very difficult to benchmark across industries. Customer, process, and learning and growth KPIs work together, in a difficult-to-capture dynamic to deliver ultimate financial value (as we explained in earlier chapters).
Indeed, and particularly from the learning and growth perspective, organizations might have a KPI that is at best a proxy—in that it provides some, but by no means perfect, measure of progress. That is acceptable as these can be improved over time. This helps overcome the barrier of spending a lot of time worrying over what is the best KPI for creating a collaborative culture, for instance, and focusing on what needs to change (technologically and culturally) to enable collaboration.
As a result, the chosen KPI is still an indicator of progress to an objective, with an identified performance gap. But note the words of Bogsnes: “The I in KPI is there for a good reason, it is an indicator not an absolute measure of performance.”
De-emphasize KPIs
Bogsnes argues that organizations should de-emphasize KPIs and emphasize actions. “Spend less time on KPI selection and expend more energy on thinking about the actions.”
The marketplace moves way too fast these days to rely heavily on static KPIs and in spending months finding the perfect performance measure. The key to successfully implementing a strategy is speed and agility as well as adaptiveness. An overblown, over-engineered KPI system is a showstopper. To expand on a quote from John Ruskin. “In the final analysis, our goals and measures are of little consequence. Neither are what we think or believe. The only thing of consequence is what we do” [3].
- 1.
KPIs can be very misleading
- 2.
KPIs can drive the wrong behaviours.
Misunderstanding here can lead to potentially catastrophic consequences and is often rooted in a lack of knowledge in the organization regarding how measures work.
The Science of Measurement
When we work with organizations to build scorecards, we always stress that those that work with measures need to understand at least the basics of how measures work. In assignments, we often have to explain the importance of understanding confidence levels and intervals when using surveys. This is not rocket science.
With at least the basics understood, we then progress to the basics of analytics. In time, they can mature to a more advanced understanding of measurement and analytics. But simply understanding the basics means that organizations do not spend endless amount of times collecting KPIs and then providing commentary that is at best of limited value or (not uncommon) downright dangerous as the so-called analysis leads to strategic, and often expensive, improvement interventions that are not addressing the problem—and perhaps exacerbating it.
It is a continued mystery how organizations are, as is typically the case, obsessed with measurement, but do not invest the time and money into teaching those that work with measures even the basics of the underpinning science. We would expect a finance professional to understand finance and the same for an IT specialist, but not for those working with KPIs. We need to redress this odd, and dangerous, omission.
The Dangers of Aggregation
Of the many common mistakes that organizations routinely make, consider aggregation.
Here’s a task: put one leg in a bucket of boiling water and the other in a bucket of freezing water. On average, it’s the perfect temperature. Herein lies a major issue with measurement that we commonly observe: believing that aggregated data is an insightful measure of performance. Of course, aggregation has some value as a high-level performance indicator, but without interrogating, the data beneath it can be very misleading.
Simpson’s Paradox
As a powerful illustration, consider Simpson’s Paradox: the paradox in probability and statistics, in which a trend appears in different groups of data but disappears or reverses when we combine these groups.
As a true example, a University in the USA was taken to court by a young woman that claimed gender bias on the basis that the annual admission data showed that significantly more boys were being admitted than girls. Sounds fair, yes?
However, the analysis of the data showed that generally girls were applying for the most competitive courses, whereas boys were more attracted to the less competitive courses. In reality, more girls were being admitted to both the more competitive and less competitive courses. Yet, when the numbers were aggregated, there were more boys admitted. Simpson’s Paradox.
Consequently, whenever we are shown aggregated data (which on most scorecards are colour-coded), we always ask “but what does this mean?” Typically, the answer we get is “It shows we are performing well”—if it’s green. Maybe it does or maybe it doesn’t. We have no idea without looking at the underlying data. The downsides of colour coding are explored in Chap. 9: Unleashing the Power of Analytics for Strategic Learning and Adapting.
Herein lies another major issue with measurement: the belief that the reported KPI score is sufficient information for decision-making purposes. It is not. The top-level KPI “number” does not provide the full picture of performance. Back to the word “indicator.”
Trend Analysis
A further area of concern is a failure to understand trends properly. It is the trend that is important, not the direct comparison between two adjacent numbers. This enables, as one example, performance to be analysed so to understand if any variations to performance can be attributed to reasons such as normal seasonal change or is due to negative influences that to redress require targeted interventions. As one practitioner noted, “We can make informed choices based on analysis that tell us that yes performance to a target has fallen by 10% but it’s not significant so there’s no need to do anything about it.”
Moreover, good trend analysis might show that although a financial KPI is still green, it is trending downward, whereas a red KPI is trending upward and is forecasted to move into yellow soon. Much better to intervene to stop the downward trends than the one trending upwards. This points to one of the shortcoming of exception-based reporting, where all the conversations are about “apparently” underperforming KPIs.
Driving “Rational” Behaviours
A poor understanding of the science of measurement also means that organizations overlook the fact that measurement does not always drive the expected behaviours.
An Amusing Story
Here’s an amusing true story. A few years back, the city of Mumbai had an issue with rat infestation. The rat population was growing rapidly and, of course, causing all manner of health concerns. Then a government official had a great idea. Mumbai also has a lot of poor people, so simply pay people to kill rats—deliver X numbers of dead rats and receive X rupees…brilliant!
It worked beautifully. The rat population declined rapidly. Nevertheless, after a few months it started to rise again, and the number of dead rats delivered for payment rose as well. No-one could understand why. Investigations found the answer—people were breeding rats. Makes sense as rats breed quickly, and they were proving a useful source of income to struggling folk.
A Tragic Story
The next true story is not amusing. A pizza company had an objective “Deliver Superior Customer Experience” and a supporting measure of “95% of Pizzas delivered within 15 minutes.” This was based on research that found that customers wanted their food hot and delivered quickly. Makes sense, and to encourage the delivery of this customer experience, outlet managers’ bonuses were based largely on this KPI.
One day, an outlet had an issue with its ovens and there was a panic about not hitting the target. The manager told a delivery boy to get on his motorcycle, hurry up, and get to the customers’ homes quicker than he normally would have so as to hit the target. The young driver drove quickly, crashed, and died.
Be Careful What You Ask For
Both these amusing and tragic stories deliver the same message. Be careful what you ask for when creating KPIs and setting targets. They might just encourage “rational” behaviours that could be either positive or negative.
Dysfunctional behaviours (which are simply “rational” responses—that is, doing what is required to hit the target) triggered by a KPI are far from uncommon. It is well known (and we have seen this) for a manufacturing plant to bet set a target to reduce reported injuries, and for the target to be reached simply by only reporting serious injuries (that cannot be hidden). Performance does not improve, but the target is met. Put another way, “the target is hit, but the point is missed.” There are many similar examples from all sectors, industries, and functions.
Identifying Rational Behaviours
When we work with organizations to select KPIs and targets, a step we always include is to get people to think about the behaviours the KPI might drive. We simply ask them to brainstorm and write down all the positive behaviours that might be encouraged and then the negatives. When done, we then discuss how to best encourage the former and mitigate the latter. Sometimes, the risk of dysfunctional behaviour is so great that the KPI must be rethought or abandoned: a simple exercise that can deliver a lot of benefits and save a lot of heartache.
Sometimes negative behaviours can happen as the KPI transitions from the design phase to reporting. We worked with one government organization that had set a KPI for the finance department of “90% of invoices paid within two months.” This was something of a stretch for a government entity in that country. So, when we reviewed the finance scorecard, we were surprised to find the colour was green. It was being hit. This made little sense as in conversations with suppliers, a common gripe was that it took up to eight months to be paid. Clearly, something was amiss.
Auditing the KPI found that although the original intent was payment within two months of receipt, finance had changed this to two months from final sign-off, which—in this very bureaucratic organization—took six months. Again, performance did not change but the target was hit. No need for exception reporting here.
So, when designing KPIs and targets, think about the rational behaviours (positive and negative) that might be encouraged and plan accordingly. Also, ensure that the original performance-enhancing intent of the measure is not changed (oftentimes surreptitiously) during implementation. Indeed, a regular audit of the Balanced Scorecard is good practice (and when managers resist this, it is a strong indication that something just ain’t right).
In addition, be particularly careful when bonuses are linked to KPI target achievement. An old adage says, “What gets measured gets done. What gets rewarded gets repeated.” Be careful you don’t simply end up rewarding more rats.
Advice Snippet
A failure to understand the potential dangers of aggregating data. As well as hiding potentially damaging performance trends (hidden in the measures that are aggregated), they also might give a totally misleading view of performance: Simpson’s Paradox.
Not taking confidence levels and intervals into account leads to wasting time discussing statistically meaningless data. Best practice is to be 95% confident that the figure provide is correct to an error rate of two percentage points.
Simply comparing one data point with the one previous. This provides a performance snapshot and is only meaningful when the organization has perhaps four or more time-based data points. For this reason, annual KPIs are of limited value when used over the timeline of a strategy.
Believing that the high-level KPI score is sufficient for analysis and reporting—it generally is not—and rigorous analysis of the data that underpins the KPI is important. Moreover, the I in KPI means indicator—not an absolute measure of performance.
Underpinning this is a failure to provide staff that regularly collect and analyse data basic training in the metrology—the science of measurement.
Setting Targets
In his LinkedIn Blog The Work is not the Problem, Jeremy Cox, a Senior Consultant with Vanguard Consulting, neatly explained how the dysfunctional relationship between target-setting and the hierarchical (we would say Taloyesque) top-down style of management leads to “rational” behaviour [4]. “Top-down performance management causes systemic sub-optimisation and demotivation, as “what do I do to get the sale (and meet my target)” invariably wins over “what is the right thing for me to do for the customer?””
unfortunately, we know that the use of targets in a hierarchical system only engages peoples’ ingenuity in managing the numbers rather than improving their methods. People’s attention turns to being seen to meet the targets—fulfilling the bureaucratic requirements of reporting that which they have become “accountable” for—at the expense of achieving the organization’s purpose. In simple terms, all this effort constitutes and causes waste—inefficiency, poor service and, worst of all, low morale.
He continues, “When targets produce unintended consequences, as they always do, managers react to the symptoms by doing more (adding targets) or less (subtracting targets, de-coupling incentives from targets) of the wrong thing.”
He explains that doing the “wrong thing righter,” is not the same as doing the right thing. “Unfortunately, leaders who grasp the damage wrought on their organization’s performance by targets are forced to confront a dilemma because doing something different at the level of work requires de-constructing the system of management that creates and underpins the target regime. Arriving at this insight is by no means guaranteed – it is impossible for most managers (and government ministers) to imagine an alternative because of the degree to which targets have become embedded in our collective mind-set.”
He argues that we do not need to learn how “to do change better,” but that we need to change the way that we approach change. “Instead of separating decision-making from work, managers must learn to both study ‘how the work really works’ and then lead improvement activity in situ, with emergent change based on knowledge.”
Cox’s views support a key message of this book—that the underlying approach to managing organizations is no longer fit-for-purpose (if it ever was). In the digital age, we must reconfigure how we structure organizations, how decisions are made, and how we learn. Only then will “formal” frameworks such as the Balanced Scorecard be able to optimize performance fully and with an engaged workforce (see also Chap. 12: Ensuring Employee Sense of Purpose in the Digital Age).
While we figure what the new configurations will look like, we still need to set targets, and they are critical element of the Balanced Scorecard System. As Professor Kaplan has said, target setting is the least well developed of all the scorecard components. Oftentimes, targets are simply plucked from the air, akin to what often happens with target setting for the annual budget (the shortcomings of which we discuss in Chap. 7: Aligning the Financial and Operational Drivers of Strategic Success.)
One of the more prevalent criticisms of the annual budgeting process is that setting precise financial targets in say August 2017 to the end of 2018 is nonsensical, especially in fast-moving markets. The same applies to target setting on the Balanced Scorecard, which might set targets over a five-year period. Basic statistics tells us that setting precise targets over such a timeframe is nearly impossible with any reasonable degree of confidence (even in stable markets).
Precision and the Quantified Vision
However, we have a quandary here. With a quantified vision (see Chap. 3: Agile Strategy Setting), we typically include a precise financial number—perhaps over both five- and two-year timeframes. From this, the leadership team can understand the gap from where the organization is now, and the number expressed in the vision and the required contributions from revenue growth and cost reduction. Good analytics can help identify present and emerging market opportunities and internal cost reduction programs and work out timings and therefore set milestone targets.
Analytics will also enable an understanding of, for example, which components of customer satisfaction correlate with loyalty, repurchasing, and so on, enabling more targered performance improvement interventions and by implication better use of scarce financial and human resources.
That said, with so many unknowns these days, we must take care in turning these into absolute targets. The further out the target, the more it should be considered a stake-in-the-ground—a guide if you will.
From our experience, greater confidence and rigour can be applied over shorter-term horizons, much in keeping with best practice driver-based quarterly rolling forecasts (see also Chap. 7) where accuracy in the forecast is significant for the first couple of quarters but increasingly less so as the quarters stretch out. As time progresses, the organization can assess where it is against the quantified vision and judge what needs to be done to reach that financial target or whether it now requires revision.
Note that if a quantified financial target is very stretching, not hitting it over the timeline of the strategy is not necessarily a failure. It is a success if the organization is still outperforming its competitors and significantly improving performance. Indeed, for the quantified vision and for targets to KPIs, it might be worth considering ranges rather than precise figures, in line with good practice forecasting and our understanding of confidence levels and intervals.
A Target Is Not a Forecast
However, there’s an important twist to this recommendation. A target is not a forecast—they are different things and have different purposes.
A target is what the organization would like to achieve, if all goes their way and it will typically be stretching, in that it represents an improvement from the present performance. This holds true for Balanced Scorecard targets as much as for the budget.
Conversely, a forecast is an honest assessment of likely future performance based on the most current data and information. The forecast should tell you whether you are on track to meet targets: it is a “health check” against targets, confirming their accuracy or providing an early warning signal of problems ahead.
Not appreciating the differences leads to significant dysfunctional behaviours—be that for budgeting or strategy. Applied to the Balanced Scorecard system, one of the authors recently reviewed the scorecard of a telecommunications company where the Head o the Office of Strategy Management ( OSM) proudly pointed to all the green colours. Yet they were underperforming their competitors.
The fact is that their scorecard targets were tied to bonuses so, again as with the budget, managers fought for the easiest possible targets. Why wouldn’t they? The fact is these scorecard targets were, in reality, forecasts. As with the budget, a rational outcome of incentive-compensation being based on targeted performance, but equally, it might be the consequence of a toxic culture where it is “better to be dead than red.”
Assumption Management
So, organizational leaders must understand that a target and a forecast are different things, and this acceptance leads to significant benefits, especially when “key assumptions” are used to compare the two numbers, which might be external, (e.g. a macroeconomic development, a main competitor’s behaviour) or internal (e.g. productivity gains, product launch success).
When assumption management is used, the infrastructure is in place for a rich and material conversation about what can and needs to be done to close the performance gap on the KPIs (the gap between present and desired performance, which collectively close the value gap between present and desired performance to the quantified vision).
For instance, if the forecast suggests that a financial target will be missed by 10%, it then becomes possible for an informed and honest exploration of the key assumptions (supported of course by good analytics) and to reach a conclusion as to what is really happening in that market and the likely consequences on financial performance. From that basis, there can be an agreement on next steps. Initiatives or other actions might be launched to close any performance gaps, or it might be agreed that market conditions have changed materially and thus the target cannot be hit.
The same thinking applies to non-financial targets. Perhaps something has happened that will materially affect a targeted customer KPI, for instance. The conversation can focus on whether this is a controllable issue that can be resolved through a particular intervention or is not controllable so not hitting the target can be accepted.
Choosing Strategic Initiatives
Of course, moving from present to targeted performance requires “work to be done.” As an allegory, if someone decides to lose weight, they can set a target—that’s easy. However, just setting the target won’t change anything, as there would need to be “initiatives” around eating healthier/less and exercising, as examples. The same principle holds for improving performance on a scorecard, which is through continuous process improvements (see Chap. 7) and through strategic initiatives (Chap. 8 considers how to implement and manage initiatives). Here, we consider selecting initiatives.
Research Evidence
2014 research by the Palladium Group found that only 9% of almost 1300 firms surveyed believe they have the capability to optimize their strategic initiatives fully [5]. Findings such as these indicate there are significant problems here to address throughout the initiative management process.
One key reason for such disappointing findings is that, and unlike the selection of strategic objectives or KPIs, choosing initiatives means committing what might be scarce financial and human resources. A much more complex and politically charged process than choosing objectives and KPIs.
In addition, there are often too many initiatives on a scorecard (as there are usually too many objectives and KPIs). About 12 should suffice, and these should be high impact and, wherever possible, impacting more than one objective at the enabler lever. Initiatives should not be identified at the outcome level, as these are the result of the work done below.
Oftentimes, there are too many initiatives because a significant percentage are not initiatives, but regular work. As Kaplan and Norton explain, initiatives are one-off discretionary efforts and so are not repeated or business as usual. For example, publishing the annual report or completing scheduled maintenance problems are not initiatives.
Steps to Prioritizing Initiatives
In our work with hundreds of organizations, we have observed that there is a significant challenge in prioritizing initiatives amongst the many possible candidates.
An Initiative Inventory
We recommend that as a first step, all current initiatives should be inventoried and mapped against the objectives on the Strategy Map. Those that do not support an objective will not move to the next stage of prioritization.
Interestingly, it is our experience that this exercise delivers myriad benefits. It enables the culling of projects that might well have been launched for a good reason but are no longer strategically relevant. Furthermore, it invariably unearths instances of where similar initiatives exist in different parts of the organization and so enables the culling of initiatives that are misaligned with the strategy of the organization.
Other times, it is found that several initiatives are underway, which are really components of one bigger initiative; this enables the pooling together and streamlining of these efforts. Overall, the inventorying and mapping process by itself typically leads to significant cost-savings.
Prioritization Model
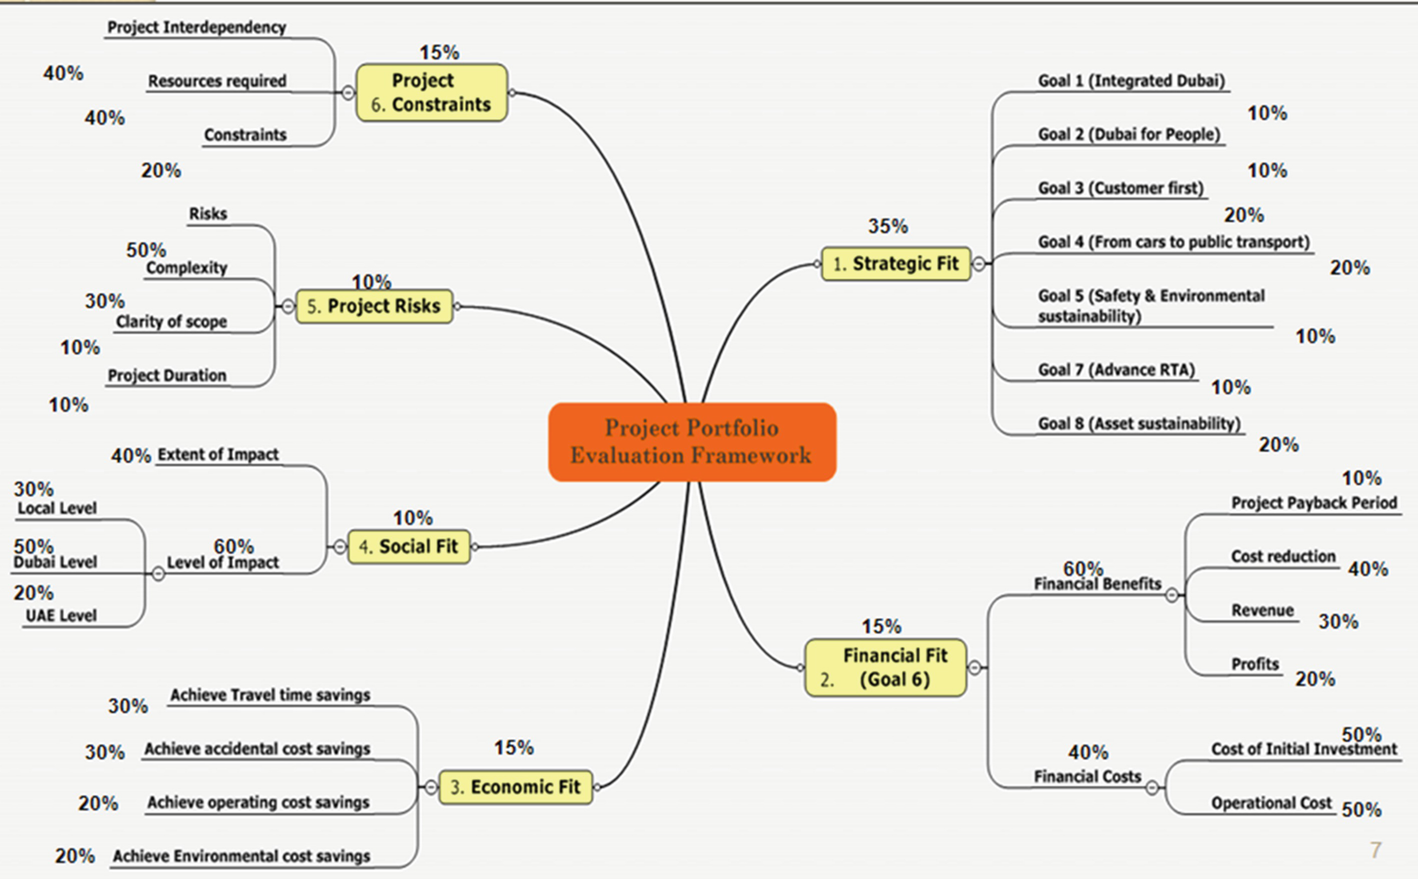
Initiative scoring model
It is also worth noting that not all selected initiatives have to be implemented at the same time. Sequencing of initiatives is important. All initiatives are of equal value over the lifetime of the strategy, but high-impact initiatives that drive quick wins might be prioritized. Moreover, there might be times during strategy implementation when one theme is more important than others and priority funding is directed to supporting initiatives (see also the previous chapter and the discussion on strategic themes).
Parting Words
With the organization-level Balanced Scorecard system established, the next step is to align each part of the enterprise to those strategic goals. Oftentimes, this is where any hoped-for performance agility gets smothered in overly restrictive diktats and controls, as well as ridiculously long timeframes for developing scorecard systems for lower-level units and functions. We explain how to overcome this agility-sapping conundrum in the next chapter.
Panel 1: Key Risk Indicators
Strategy cannot be managed effectively without understanding both the “performance” story (KPIs) and “risk” story (KRIs). The proper use of KRI provides for much greater insight into the future and promotes much greater quality of management conversation than can be gained by simply using KPIs.
To be fair, many organizations are using both KPIs and KRIs : although this is certainly an improvement on KPIs alone, they still tend to feed into different reporting and decision-making processes.
As the KPIs (which answer the question “Are we achieving our desired levels of performance?”) and KRIs (“How is our risk profile changing and is it within our desired tolerance”?) are not integrated, they deliver a siloed and often competing, view of the organization and its performance. Therefore, the executive team does not have the appropriate data and information to inform the required high-quality management conversations that provide a more complete view of progress towards the strategic objectives or enable the trade-off between risk and reward to be discussed, understood, and acted upon.
A simple likelihood multiplied by impact equation is often used to assess the level of risk the organization is facing. KRIs provide a base of data and trend information that informs the calculation of risk exposures and informs management conversations as to current level of risk-taking, changes in risk-taking, and about how much risk needs to be taken to successfully deliver to the strategic objectives.
The other function of KRIs is that they help translate risk appetite into operational risk tolerances (expressed as thresholds around the indicators). If the organization has a high appetite, it would be expected that the threshold would be wider, allowing for greater levels of variation away from the baseline; whereas a low risk organization is going to have tight thresholds to promote a higher level of control.
KRIs are typically derived from specific events or root causes, identified internally or externally, that can prevent achievement of performance goals. Examples can include items such as the introduction of a new product by a competitor, a strike at a supplier’s plant, proposed changes in the regulatory environment, or input price changes.
We strongly recommend the tracking of KPIs and KRIs on separate scorecards. A risk scorecard (or dashboard, to avoid terminology confusion) will complement the more conventional performance scorecard—but reported together.
For example, Infosys has a strategy focused on large contracts with large corporations. The concentration of revenues was identified as a significant strategic risk (a large account failure would show up on the income statement). The company identified a strategic risk indicator, credit default swap (CDS) rates, for its risk dashboard. If the CDS rate, the price for insuring against a client’s default, went outside a specified range, then mitigation steps could be taken to cope with the client’s increased risk.
A risk mitigation might well be a strategic initiative that impacts both sets of indicators and, ultimately, the delivery of the strategic objectives.
With good data and insights from both strategy and risk officers, the executive team can then make informed decision about how much risk they are willing to take in their strategy implementation efforts and how much to spend on strategy execution and risk management.
With a deep knowledge of the performance/risk dynamic, managers might even take on more risk than their competitors—knowing that their risks are visible, that they are tracked through the strategic management system and that the limit of the risk taking is understood. In this way risk management becomes another tool for competitive advantage: as much about saying yes as saying no.
Self-Assessment Checklist
The following self-assessment assists the reader in identifying strengths and opportunities for improvement against the key performance dimension that we consider critical for succeeding with strategy management in the digital age.
Self-assessment checklist
Please tick the number that is the closest to the statement with which you agree | ||||||||
7 | 6 | 5 | 4 | 3 | 2 | 1 | ||
When implementing strategy, my organization focuses on a small number of KPIs | When implementing strategy, my organization focuses on a large number of KPIs | |||||||
We have a very good understanding of the purpose of KPIs | We have a very poor understanding of the purpose of KPIs | |||||||
We use value drivers, or similar, in assigning KPIs to strategic objectives | We use brainstorming, or similar, in assigning KPIs to strategic objectives | |||||||
My organization has a very good understanding of the strategic questions a KPI will answer | My organization has a very poor understanding of the strategic questions a KPI will answer | |||||||
My organization places much more importance on initiatives/actions than on measures | My organization places much more importance on measures than on initiatives/actions | |||||||
Those tasked with collecting and/or reporting KPI performance have a very good understanding of how measures work | Those tasked with collecting and/or reporting KPI performance have a very poor understanding of how measures work | |||||||
When setting KPIs, we closely consider the potential negative behaviours that might be triggered | When setting KPIs we do not consider the potential negative behaviours that might be triggered | |||||||
My organization has a very good understanding of how to set performance targets | My organization has a very poor understanding of how to set performance targets | |||||||
We have an appropriate number of strategic initiatives | We have too many strategic initiatives | |||||||
We have a very good process for prioritizing initiatives | We have a very poor process for prioritizing initiatives | |||||||
We have a very good understanding of the difference between strategic initiatives and business as usual | We have a very poor understanding of the difference between strategic initiatives and business as usual | |||||||
My organization has clearly identified the key risk indicators to track | My organization has not identified the key risk indicators to track | |||||||