Note
Note
This, of course, ignores the woman’s role in this. What if your best match ranks you as a terrible match?
There is no expedient to which a man will not resort to avoid the real labor of thinking.
—JOSHUA REYNOLDS
Humans are often bad at decision-making. We consistently engage in behaviors that are conflict with our stated goals. We misread data and come to bad conclusions. We see things we want to see and hear things we want to hear. We misinterpret odds and act accordingly. The world is a complex and confusing place, and despite our profound ability to change and shape our world in remarkable ways, our ability to understand the world at any given time is limited. Because of this limitation, we take shortcuts. Those shortcuts are called heuristics (and their results are called biases) and they often result in costly mistakes.
Take, for instance, the problem of marriage. Say you are an of-age heterosexual man who wants to find a wife. The rational way of maximizing your happiness is to enumerate all the things that would make you happy with a potential wife and then weigh them in accordance with how important they are. Then you would use this scoring system to compare every available woman on the planet and select the best possible woman to court.
Note
This, of course, ignores the woman’s role in this. What if your best match ranks you as a terrible match?
Naturally, we cannot do that. Even if we could fairly create that scoring chart, there are nearly 50 million unmarried adult women in the US alone.1 Instead, we use heuristics to narrow our search. We date a small number of people. Men, on average, have only six relationships before marriage.2 Six out of 50 million is not an exhaustive search. Even when the stakes are as high as they are when choosing a potential partner for life, humans do not tackle problems in a scientific manner. Instead, we take shortcuts. This chapter is largely about the kinds of shortcuts we take.
1 DePaulo, B., & Trimberger, E.K. (2008) “Single Women. Sociologists for Women in Society Fact Sheet.” Retrieved from http://belladepaulo.com/wp-content/uploads/2013/03/Single-Women-Fact-Sheet-11-1-08.pdf.
2 Daily Mail Reporter. (2014). “No One Said Finding The One Would Be easy.” Daily Mail. Retrieved December 3, 2014, from www.dailymail.co.uk/femail/article-2532213/No-one-said-finding-The-One-easy-The-averagewomen-kiss-FIFTEEN-men-enjoy-TWO-long-term-relationships-heart-broken-TWICE.html.
These shortcuts are not always conscious and often they do not even make sense. In one study, researchers asked subjects to complete a task in which they had to rearrange words. When they were finished, subjects were asked to walk down the hall to turn in their work. Secretly, the researchers were timing how long it took the subjects to walk down the hall. Researchers found that when the words list included words that reminded people of being old (retirement, elderly, bingo, Florida), subjects walked slower than when those words were not included.3 The researchers concluded that unconsciously the subjects were primed to walk slowly by the “old” words. This study has been highly controversial and disputed for many reasons, but it is only one of many that shows our decision-making is not necessarily entirely conscious or reasonable.
3 Bargh, J. A., Chen, M., & Burrows, L. (1996). “Automaticity of Social Behavior: Direct Effects of Trait Construct and Stereotype Activation on Action.” Journal of Personality and Social Psychology, 71(2), 230.
One judgment error is so pervasive that it is named the “fundamental” attribution error. The reasons that events happen to people can be split into two categories: dispositional factors and situational factors. Dispositional factors are factors that happen because of the abilities, features, or motives of an actor. When an angry baseball player blows up at an umpire, we call him a “hot head.” We attribute his outburst to his disposition. Situational factors happen due to chance or situation. When you become angry with a friend, you often apologize by attributing it to just having a bad day. The bad day is the situation that caused the event, not your disposition.
The fundamental attribution error is the tendency to assign dispositional factors to the actions of others and situational factors to your own actions. When someone cuts you off in traffic, you say that she is a bad driver (dispositional). When you cut someone off in traffic, you rationalize that it just cannot be helped because you are late for work (situational) or the other driver did not give you enough room (situational).
This error is pervasive. Study subjects who are explicitly told that an author’s viewpoint was determined by a coin flip still attribute the position to the author.4 They cannot divorce that author’s viewpoint from his disposition. We consistently attribute dispositional factors to others and situational factors to our own behaviors.5
4 Jones, E. E., & Harris, V. A. (1967). “The Attribution of Attitudes.” Journal of Experimental Social Psychology, 3(1), 1–24.
5 Jones, E. E., & Nisbett, R. E. (1971). “The Actor and the Observer: Divergent Perceptions of the Causes of Behavior” (p. 16). Morristown, NJ: General Learning Press.
Of course, this is not the only way humans fail to attribute success, failure, and causal relationships correctly. A famous study asked subjects to predict coin tosses.6 Subjects in the study who had early successes believed that their success was attributed to skill, even though the results were clearly random. You are likely to have made the same observation at one point or another. When you win at games, you claim it is because you are skilled. When you lose, it is because the game cheats, the random number generator went against you, or the controller is broken. This is often referred to as the “self-serving bias.”7 When a player loses, the designer should want her to blame herself, not the game or the designer. If the player blames the game, it will cause her to devalue the game experience.
6 Langer, E. J. (1975). “The Illusion of Control.” Journal of Personality and Social Psychology, 32(2), 311.
7 Miller, D. T., & Ross, M. (1975). “Self-Serving Biases in the Attribution of Causality: Fact or Fiction?” Psychological Bulletin, 82(2), 213.
In 1951, Dartmouth and Princeton had a particularly rough football game. Both teams suffered considerable injuries on the field, and both teams racked up penalty after penalty. Princeton fans blamed Dartmouth for the fracas. Dartmouth fans, naturally, blamed Princeton. Luckily, a pair of researchers, one at Princeton and one at Dartmouth found this interesting enough to examine. They recruited a group of students from each school to watch game film and record the number of infractions from each team. Both groups of students noticed a similar number of infractions for Princeton’s players. However, Princeton students saw twice the number of infractions for Dartmouth than the Dartmouth players did.8 This lead the researchers to postulate that the Dartmouth students were watching different games than the Princeton students, despite all the students seeing the same film. Students’ perceptions were such that even given the same images to view, they could not see what the others saw. Their dispositions made them unable to objectively report what was really there. Think about this the next time you blame the officials when your team loses.
8 Hastorf, A. H., & Cantril, H. (1954). “They Saw a Game: A Case Study.” The Journal of Abnormal and Social Psychology, 49(1), 129.
What is particularly troubling is that even if we know about the bias, we still have a hard time shaking its effects on our own perceptions.
Millions of dollars are spent by professional football teams to eke out additional wins. Yet the distribution of NFL records over a season fits a similar distribution to what would happen if you just had each of the teams flip a coin every week instead of actually play a game.9 If you assume each team has a 50 percent chance of winning, then you expect a 32-team league to have one 5-0 team and one 0-5 team after the first five games, even though their chances of winning are identical. In 32 trials of coin flips, one of the trials is expected to be HHHHH (all heads) and one should be TTTTT (all tails).
9 Hiwiller, Z. (2014, April 24). “ECGC 2014: Design Lessons from Pareto.” Retrieved December 8, 2014, from www.hiwiller.com/2014/04/24/ecgc-2014-design-lessons-from-pareto.
Say that you have a fair coin, you have flipped it three times, and it has come up heads each time. You are now offered a fourth flip on which you can place a bet of $50 on the outcome. Do you choose heads or tails? Is tails not due at this point?
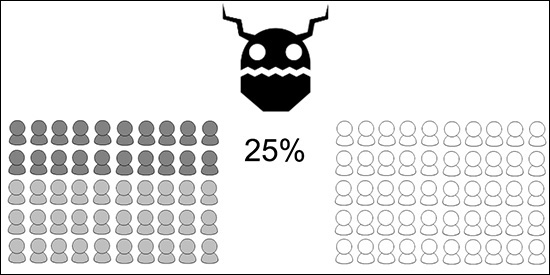
Or to put it another way: Say that in a game, you have a 25 percent chance in each session of facing a particularly difficult version of a boss (the MegaBoss). You have 100 playtesters and 50 have already played. Of those 50, 20 have seen the MegaBoss. Of the remaining 50, how many will see the MegaBoss (FIGURE 26.1)?
MONSTER SYMBOL BY BRYAN ANDERSON, FROM THENOUNPROJECT. COM COLLECTION.
FIGURE 26.1 Already 20 have seen the MegaBoss. How many of the remaining 50 will?
People try to solve this problem in two ways. The first way is that since there is a 25 percent chance of seeing the MegaBoss, then of the 100 playtesters, 25 should see it. Since 20 have already seen it, 5 of the next 50 playtesters should see the MegaBoss.
This method would be committing what is commonly known as the gambler’s fallacy. The gambler’s fallacy is a belief that random processes “remember” what has happened before and adjust accordingly. In this example, saying that 5 of the next 50 playtesters should see the MegaBoss implies that the game knows 20 have already seen it and thus it should make it up to the player by having a lower probability later. This is no different than saying a slot machine is “due” to pay off or that if a couple has two boys then they are “due” a girl.
The second, actual way of solving this problem is by applying the 25 percent for the next 50 players. If the odds of each trial seeing the MegaBoss are 1 in 4, the problem definition says nothing about the MegaBoss knowing how many players saw him before. So ignore the fact that a greater-than-expected number of players saw him before. Going forward, 1 in 4 will continue to see him. The MegaBoss should be expected 12.5 (50/4) more times.
Humans have difficulty understanding randomness.10 We are loath to attribute variation to randomness; instead we look for hidden patterns and rules.11 We believe in provably false concepts like streak shooting (or having “a hot hand”) in sports.12 We believe that a pattern of heads and tails coin flips like HTHHTTHTTH looks more random than HHHHHTTTTT, even though they have the same exact probability of happening. This is not just an academic problem. A whole industry revolves around trying to convince people to pay for someone to pick stocks for them, even though people cannot distinguish between real market activity and random patterns.13
10 Zhao, J., Hahn, U., & Osherson, D. (2014). “Perception and Identification of Random Events.” Human Perception and Performance, 40, 1358-1371.
11 Schwartz, B. (1982). “Reinforcement-Induced Behavioral Stereotypy: How Not to Teach People to Discover Rules.” Journal of Experimental Psychology: General, 111(1), 23.
12 Gilovich, T., Vallone, R., & Tversky, A. (1985). “The Hot Hand in Basketball: On the Misperception of Random Sequences.” Cognitive Psychology, 17(3), 295–314.
13 Hasanhodzic, J., Lo, A. W., & Viola, E. (2010). “Is It Real, or Is It Randomized?: A Financial Turing Test.” arXiv Preprint arXiv:1002.4592.
Sid Meier explained the actual effects that this had on his game design.14 In Civilization Revolution, armies have ratings, and the ratio of those ratings affects how often that army wins. For instance, if an army of rating 3 faces an army with a rating of 1, the 3 army wins 75 percent (3/(3+1)) of the time and the 1 army wins 25 percent of the time (1/(3+1)). Yet players had a hard time understanding this. When they played as the 3-powered army and lost, they complained that they had an overwhelming advantage and should have won. But when they played as the 1-powered army and won, they had no issue understanding that the player with the 1 should win 1 in 4 times.
14 Graft, K. (2010, March 12). “GDC: Sid Meier’s Lessons On Gamer Psychology.” Retrieved December 8, 2014, from www.gamasutra.com/view/news/118597/GDC_Sid_Meiers_Lessons_On_Gamer_Psychology.php.
Also, some players who were OK when they lost on a 3:1 advantage lost their minds when they lost and had a 30:10 advantage, despite these producing the same odds. Their issue was that they claimed 30 was so much bigger than 10 that it should automatically win.
Additionally, players complained that if they lost a 3:1 battle, then they should win the next 3:1 battle. This is just the gambler’s fallacy again. These battles are independent events. By probability, one in 16 times, the 3-value army will lose two 3:1 matches in a row. However, when that happened, players freaked out and claimed that the game was being unfair. These reactions prove that many players don’t understand probability.
Another time it becomes apparent that players don’t understand probability is when compound events are involved. A compound event is made up of a series of simpler events. For instance, flipping three coins heads in a row is a compound event, and it’s made up of three simple coin flip events. It’s much easier for us to understand probability in situations with simple events than it is in situations with compound events.15
15 Cohen, J., Chesnick, E. I., & Haran, D. (1971). “Evaluation of Compound Probabilities in Sequential Choice.” In Kahneman, D. Slovic, P. & Tversky, A. Judgement under Uncertainty: Heuristics and Biases. Cambridge: Cambridge University Press, 1982.
Warren Buffet made news in 2014 when he announced a promotion named the “Billion Dollar Bracket.” If a person could correctly pick the winner of all 63 games in the NCAA Men’s Basketball Tournament, he would award them a billion dollars. It seems pretty straightforward and millions attempted an entry. However, the odds of picking a perfect bracket are somewhere in the range of 1 in 128 billion to 1 in 9.2 quintillion, depending on your methodology.16 A player is something along the lines of 100,000 to 10 trillion times more likely to get struck by lightning. In the first year of the Billion Dollar Bracket, none of the 15 million brackets had a perfect score after only the second day of a three-week tournament.17
16 Kiersz, A. (2014, March 17). “The Odds Of Filling Out A Perfect NCAA Bracket Are Actually Way Better Than 1 In 9,223,372,036,854,775,808.” Retrieved December 8, 2014, from www.businessinsider.com/odds-of-perfect-ncaa-tournament-bracket-2014-3.
17 Kamisar, B. (2014, March 21). “No Perfect March Madness Brackets Left in Warren Buffett’s Billion-Dollar Contest.” Retrieved December 8, 2014, from http://thescoopblog.dallasnews.com/2014/03/just-16-brackets-still-in-running-for-warren-buffetts-billion.html.
Note
The odds of Streak for the Cash are not as simple as a conjunction of simple probabilities. You can start over after a loss, and odds are not calculated to have 50 percent probability for each side of the bet as they would be in a Vegas line.
ESPN also has a game named Streak for the Cash. In it, players have to pick the results of sports events happening that day. To win the cash prize, they must get a large number of these correct in a row. It’s easy to visualize 20 wins. But it’s harder to visualize 20 wins in a row. If each game has a 50 percent chance of resulting in a win, then the odds of getting 20 in a row right is roughly 1 in a million. Nonetheless, Streak for the Cash is popular because people believe the prize is attainable.
One possible explanation for misunderstanding the odds of the Billion Dollar Bracket and Streak for the Cash is the concept of anchoring. People often get stuck by being exposed to numbers. For instance, in Streak for the Cash, players get stuck on the number 20. In the Billion Dollar Bracket contest, players get stuck on 63. However, those are not the numbers players should be thinking about.
Assume you have a sheet of paper that is 0.1 millimeters thick. If you were to fold it on itself 100 times, how thick would the paper be? Think about it for a moment before reading on.
Common answers range from centimeters to a few meters. The actual answer is 1.27 × 10²³ kilometers—a distance trillions of times farther than the distance between the Earth and the Sun.18 Most people think about the first few folds, saying “OK, after one fold it is 0.2 mm thick. Then after two folds it is 0.4 mm thick. Then after three it is 0.8 mm thick.” They anchor on these small values and ignore the latter stages of the problem.
18 Plous, S. (1993). The Psychology of Judgment and Decision Making. Philadelphia: Temple University Press.
This is replicated in a famous study where students estimated that 8 × 7 × 6 × 5 × 4 × 3 × 2 × 1 would be a number four times larger than 1 × 2 × 3 × 4 × 5 × 6 × 7 × 8. Students anchor on the first few numbers and ignore the rest.19
19 Tversky, A., & Kahneman, D. (1974). “Judgment Under Uncertainty: Heuristics and Biases.” Science, 185(4157), 1124–1131.
Anchors don’t even have to be coherently related to the problem at hand. Researchers found that writing down the last two numbers in one’s Social Security number affected how much subjects bid for items in an auction.20 If subjects wrote down a high number, they bid more!
20 Ariely, D., Loewenstein, G., & Prelec, D. (2006). “Tom Sawyer and the Construction of Value.” Journal of Economic Behavior & Organization, 60(1), 1–10.
This is unfortunately used nefariously quite often in games. Say you are trying to sell your virtual currency in your game. You have four bundles to choose from. A small bundle is 99 cents, a medium bundle is $1.99, a large bundle is $4.99, and an extra-large bundle is $9.99. The principle of anchoring suggests that you show the player the $9.99 bundle first. This will force the player into weighing everything else by the concept of spending $9.99. None of the bundles seem expensive when presented this way. However, if you start with the 99-cent bundle, then the $9.99 bundle looks really expensive.
Even including a bundle that you do not expect anyone to buy can cause anchoring to occur. Add a $99.99 bundle to the list first and every player will be locked into a higher number. Ridiculous anchors like these can have an effect. Researchers asked subjects questions with entirely implausible anchors, such as “Is a whale larger or smaller than 0.2 m? How long is a whale?” or “Was Aristotle born after 1832? When was Aristotle born?” and even those anchors affected subject’s answers.21 High anchors resulted in higher guesses. Lower anchors resulted in lower guesses.
21 Strack, F., & Mussweiler, T. (1997). “Explaining the Enigmatic Anchoring Effect: Mechanisms of Selective Accessibility.” Journal of Personality and Social Psychology, 73(3), 437.
Games are often about making choices in situations of uncertainty. Should I take the pistols or the sniper rifle? That depends on the type of battle and terrain that I expect. Should I choose a pass defense or a run defense? That depends on what type of play I expect to come up. Should I spend skill points on archery or diplomacy? That depends on the payoffs between increases in each of the skills. In all these cases, the decision is contingent on what will happen in the future.
One of the easiest models for understanding how people make decisions in these cases is the use of expected value. When using this, you multiply each probability of each world state by the value of that world state happening. Then you sum all those and get the “value” for that branch.
Let’s use a simplified version of American football as an example. You, the player, are choosing a play for the defense. You can choose to line up in a run defense or a pass defense. Your opponent can choose either a run play or a pass play (FIGURE 26.2). In any case, you are trying to minimize the amount of yards the opponent gains.
Note
A little algebra work shows that given these payoffs, you should choose pass defense until you are 15/23 or around 65 percent sure that the opponent will run.
Which type of defense you should choose depends wholly on what you believe your opponent will do. If you believe 100 percent that the opponent will pass, then the 5 yards they gain from choosing a pass defense is better than the 20 yards they gain from the run defense. But if you are 50/50 on what your opponent will choose, then you must use probability. The expected value of each of your options is the sum of the payoff for each event times the probability of that event. The expected value of choosing a run defense would be 0.5 × 2 + 0.5 × 20, or 11 yards, whereas the expected value of the pass defense would be 0.5 × 10 + 0.5 × 5, or 7.5 yards. Since 7.5 yards is less than 11 yards, in this case, you should choose the pass defense.
Expected value is really flexible and works in many situations. It’s easy to apply and easy to understand. However, it doesn’t always work. Mathematician Nicolas Bernoulli identified this problem in the 18th Century, since dubbed the St. Petersburg Paradox.
Say you have a game in which you flip a coin and you get $1 if it comes up heads and nothing if it comes up tails. What would you pay to play that game? Expected value tells you that the value of the game is 1 × 0.5 + 0 × 0.5 or 0.50. So you would theoretically pay up to 50 cents to play that game.
Consider a different game. In this game you flip a coin until it comes up tails. Then you receive $2 if the game ends on the first toss, $4 if it comes up tails on the second toss, $8 if it comes up tails on the third toss and so on, doubling the payoff for each consecutive heads. What would you pay to play that game?
We can try to evaluate this by calculating the expected value as we did in our first game. The odds that the game ends on the first toss are 0.5. The odds that the game ends on the second toss are 0.5 × 0.5 or 0.25. HT is the only combination that would end the game on the second flip. HH continues the game on to the third toss. TH and TT cannot happen since the game would have already ended. Thus, 1 in 4. Odds that the game ends on the third toss are 0.5 × 0.5 × 0.5 or 0.125. Using the same logic as you did earlier, HHT is the only combination that can end the game on the third toss. Since that is one of eight possible results for three coin tosses, the probability is 0.125. And so on. So the expected value of the game should be (0.5 × 2) + (0.25 × 4) + (0.125 × 8) and so on infinitely. The expected value is infinite, 1 + 1 + 1, forever repeating.
But if you ask people what they would pay to play the game, they will not pledge to pay infinite money. Hence the paradox. A resolution, provided by another mathematician—Nicholas Bernoulli’s cousin Daniel 25 years later—is that people do not value all gains equally.22 A poor, starving man will gain more from a 100 dollar bill than a billionaire will. Thus, those extreme examples late in the series are discounted when compared to the rewards of early losses in the series.
22 Bernoulli, D. (1954). “Exposition of a New Theory on the Measurement of Risk.” Econometrica: Journal of the Econometric Society, 23–36. (Original work published 1738).
This is the concept of diminishing marginal utility. Your first donut is delicious. Your second is OK. By the time you get to your sixth donut, you never want to see a donut again. How much you value a thing is based on how much of that thing you already have. In games, this is pervasive. As you gain experience points, for example, you gain skills that make gaining more experience easier. Thus, for the same benefit, you need more and more experience. Each individual experience point is marginally worth less.
One additional concept to analyze when discussing decision-making under uncertainty is how a decision maker treats risk. If people truly acted as expected value maximizers, then no one would ever play the lottery or buy insurance because both of those activities have a negative expected value. Expected value maximizers are called risk-neutral—they don’t care about risk; they seek only to maximize some value.
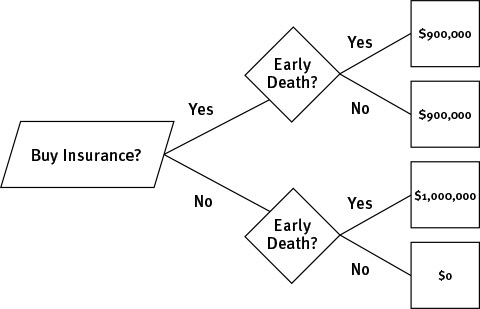
Yet in some situations, we are clearly risk-averse. As a society, we pay billions of dollars in premiums to insurance companies to mitigate risk. Consider life insurance. Say you have a 1 percent chance of dying over the insurance period and you want to maximize the amount of money your family will receive. If you work your whole life, you will make $1,000,000. You want to buy an insurance policy to replace that income if you were to die, so you buy a policy that costs of $100,000 (FIGURE 26.3).
According to expected value, this is irrational. The “buy insurance” option has an expected value of $900,000. The “No insurance” option has an expected value of $990,000. We buy insurance for safety. We are risk-averse. We don’t want our family to end up in the $0 outcome, so we pay a premium to ensure that.
Note
This analysis ignores the smaller prizes for simplicity.
However, sometimes we are risk-loving. Consider the Powerball jackpot. Odds are roughly 1 in 175 million that you’ll win the jackpot. As of today, the Powerball jackpot is listed as $60 million (FIGURE 26.4).
Here, the expected value of buying a ticket is –$1.65 and the expected value of not buying a ticket is $0. A risk-neutral person would not buy the ticket. Yet millions buy Powerball tickets every day. They pay a premium for a chance at a big payout.
When I was buying my first new car out of college, I felt a real dilemma. I was torn between getting a reliable, cost-effective Honda Civic, and a fun, yet more expensive Mini Cooper convertible. I had test-driven both and kept going back and forth to the dealerships. The salespeople were likely sick of me. One day at the Honda dealership, the salesperson hands me the keys and says “Take it home for a couple days and see how you feel.” That was odd to me. They would let me test drive it without someone there? What if I took it cross-country and returned it after? What if I got into an accident?
I didn’t realize at the time, but the dealership was using a classic psychological trick called the endowment effect. It states that you value something more that is in your possession.23 I would feel the loss of giving the car back greater than the gain I received by getting to take the car home. Behavioral economists Daniel Kahneman and Amos Tversky found that people lose more satisfaction from losing x dollars than they gain satisfaction from winning x dollars.24 This is called loss aversion.
23 Kahneman, D., Knetsch, J. L., & Thaler, R. H. (1991). “Anomalies: The Endowment Effect, Loss Aversion, and Status Quo Bias.” The Journal of Economic Perspectives, 5, 193–206.
24 Kahneman, D., & Tversky, A. (1984). “Choices, Values, and Frames.” American Psychologist, 39(4), 341.
This is a simple manipulation that is often done in games. In Metroid Prime, you are given all the weapons in the game at the beginning and then they are taken away. That loss hurts more than never having the weapons in the first place, and it motivates you to seek them out. If you choose to not check in on your FarmVille farm, your crops wither away. There is a minor loss due to withering when compared to never having planted at all, but there is a large loss compared to harvesting them at the right time. Thus players continually come back to avoid the “loss” of spoiled crops.
Game designer Ray Mazza recommends that you (the designer) always keep players as happy as possible to avoid their pain of loss. “[Mechanics that punish a player] may be fun for everyone else, but they are lousy for at least one player. They’re often used to insert randomness into [a] game to even out chances for those less skilled, but that can be accomplished with positive events instead. Rather than lose a turn, try to gain a turn. [...] The happier everyone is, the less likely they’ll never want to play again.”25
25 Costikyan, G. (Ed.) (2011), Tabletop: Analog Game Design. Pittsburgh, PA: ETC Press.
How a designer presents a decision can affect how a player evaluates it. A classic poll showed that when a survey asked if the United States should forbid public speeches against democracy, 46 percent of those polled agreed.26 But when the poll asked if the United States should allow public speeches against democracy, 62 percent said no despite the fact that a “no” answer to allowing the speeches is logically the same as a “yes” answer to forbidding them. The only difference here is in framing. “Allowing” something feels better than “forbidding” something. As in the examples of loss aversion earlier, people don’t want to lose something.
26 Rugg, D. (1941). “Experiments in Wording Questions: II.” Public Opinion Quarterly. 5, 91-92.
Students and researchers registering for a conference were split into groups where one group was offered a $50 discount for registering early. The other group had a $50 charge if they registered late. Both groups paid the same price on the same day; the only difference was the wording of the fees. Of the registrants, 93 percent of the junior researchers involved registered early when it was framed as a penalty for not registering early, while only 67 percent registered when it was framed as a discount for registering early.27 And these students and researchers were economists! They should have been well educated regarding framing effects.
27 Gächter, S., Orzen, H., Renner, E., & Starmer, C. (2009). “Are Experimental Economists Prone to Framing Effects? A Natural Field Experiment.” Journal of Economic Behavior & Organization, 70(3), 443–446.
Here’s another example: Experimenters showed subjects video of a traffic accident and then asked them how fast the car was going at the time of the accident.28 However, different groups received different verbs when they were asked about the accident. Some groups were asked how fast the car was going when it “bumped” the other car. Some were asked how fast it was going when it “smashed” the other car. When researchers used words such as “smashed,” subjects thought the car had been going faster. The verb used affected how fast the subjects remembered the car to be going!
28 Loftus, E. F., & Palmer, J. C. (1974). “Reconstruction of Automobile Destruction: An Example of the Interaction between Language and Memory.” Journal of Verbal Learning and Verbal Behavior, 13(5), 585–589.
Another way of framing is by putting a decision in context. People are bad at estimating how much something is worth, but they have an easier time understanding how much things are worth relative to something else. For instance, you may not know how much a one-carat diamond should cost, but you can be reasonably sure that it costs more than a half-carat diamond. Economist and author Dan Ariely writes in Predictably Irrational about the Economist magazine’s subscription model.29 The print subscription is offered for $59, the digital subscription for $125, or the print-and-digital subscription for $125. Given the choice of the digital-only subscription, the print-and-digital looks like a no-brainer value, and so customers are driven to this more expensive product.
29 Ariely, D. (2008). Predictably Irrational: The Hidden Forces That Shape Our Decisions. New York: HarperCollins.
We do the same thing when we shop at stores and see price tags that say that an item’s regular price has been slashed. In one study, an item priced at $40 sold better than the same item priced at $39 because the $40 tag was marked down from $48.30
30 Anderson, E. T., & Simester, D. I. (2003). “Effects of $9 Price Endings on Retail Sales: Evidence from Field Experiments.” Quantitative Marketing and Economics, 1(1), 93–110.
When you quit a Steam game, you are dropped back to the Steam application that shows you how much time you spent on that game (FIGURE 26.5). You might think that is a bad idea, allowing a player to feel guilty for the amount of time they spent playing.
Research contradicts this, however. It turns out that when you are asked about the time you have spent with an experience, it makes you rate the experience more favorably than if you are primed with questions about how much money you spent or if you are not primed at all.31
31 Mogilner, C., & Aaker, J. (2009). “‘The Time vs. Money Effect’: Shifting Product Attitudes and Decisions through Personal Connection.” Journal of Consumer Research, 36(2), 277–291.
By framing your game’s decisions correctly, you can subtly direct players toward options of your choice.
• The fundamental attribution error is a tendency to explain the behavior of others using dispositional factors while explaining your own behavior with situational factors.
• People value risk differently. The risk-averse accept a negative expected value to avoid risk. The risk-loving accept a negative expected value to engage with risk.
• People are more sensitive to losses. Losing something is more emotionally powerful than gaining something of equal value.
• The endowment effect illustrates that once someone has something, they cite its value as higher than if they did not have it at all.
• How a decision is framed greatly affects the behavior of those making the decision. Simply by changing the words used to describe it or the cues placed around the decision, you can affect the behavior of the decision makers.