CHAPTER 7
Advanced Abletrend Tools
Truth is great. Heaven is great. Earth is great. And, the king is also
great. These are the four greats in the universe, and the king is one
of them. The king must follow the ways of the earth. The earth must
follow the ways of the heaven. The heaven must follow the ways of the
Truth. And, the Truth must follow the ways of nature.
—Tao by Lao-tzu
This chapter introduces some of the special trading tools that have been incorporated into the AbleTrend software. We will look at the rationale for including them in the system, and how they can be applied for the most benefit. While you may not need all of them, you should understand what each can do for you. We have been developing and designing trading software since 1992, and these tools are the result of our many years of experience in trading and in the trading software industry. We believe that these tools, many of which are the direct outgrowth of the philosophy of trading we have been explaining throughout this book, give traders a tremendous advantage in profiting from any of the world’s markets they choose to trade.
VIRTUAL PAPER TRADING (VPT)
Virtual paper trading (VPT) is an ideal way to test trading strategies without risking any real money. The AbleTrend software provides for two types of VPT that give traders great power and flexibility for testing strategies they may be considering using: (1) virtual paper trading with historical data and (2) virtual paper trading with real-time data.
To initiate either paper trading program on AbleTrend, users only need to bring up the appropriate dialog box and specify their parameters, and the software takes care of the rest.
Virtual Paper Trading with Historical Data
Traders can validate their trading strategy, beyond the capabilities of back-testing, by using historical data to paper trade. Traders can choose which indicators they want to include in their strategy and they can set the rules they want to use to interpret the indicators. They can even use subjective indicators alone using AbleTrend. VPT gives you such power by providing combinations of testing subjective indicators and a mechanical trading system.
Virtual Paper Trading with Real-Time Data
Traders can experience real-time virtual paper trading to closely simulate real-time trading without risking any money. This can be very effective with subjective indicators, the mechanical trading system, or a combination of both. When you buy with VPT in real time, it uses the “ask” prices. When you sell, it uses the “bid” prices. Therefore, it is very close to the real trading results.
When you practice VPT, treat paper trading like real trading. Weigh your decisions carefully and keep track of your profits and losses as though the trades were actually executed. It is only in this way that you can give the strategies a good test.
On the other hand, when you are doing real trading, treat it like VPT. Don’t think about money at that time. Focus on whether the trade is right or wrong, and how you are executing it in real time. Don’t let your mind be clouded with concerns about money, as these will likely affect your judgment.
Basic Functions of VPT
When using VPT, traders can run their trading with the following commands:
• Stop—Stop the bar’s coming.
• Play—Start to simulate the bar’s coming.
• Speed—Set up the bar speed, 1 second to 10 seconds per bar.
• Buy—Place a buy order by clicking a bar, mark a blue up-arrow.
• Sell—Place a sell order by clicking a bar, mark a red down-arrow.
• Exit—Place an exit order by clicking a bar, mark a white cross.
• Re-do—Re-do the last trade.
• Re-set—Reset the VPT again; start over.
• C/B—Default is entry at bar close. Click C/B icon; it will switch to Bid/Ask price, or any specific price on the bar (the price you click will be the price for entry or exit).
• Setting—Set up ContractSize, CostPerTrade, and PointValue.
• Report/Exit—Show the VPT testing report.
HISTORICAL FORWARD TESTING
Back-testing is a traditional way for traders to test their trading strategies with a set of fixed parameters applied to a specific set of sample data. Parameters used in back-testing are normally optimized, predetermined with some knowledge of the sample data, or derived directly from the sample data; therefore, back-testing has the benefit of hindsight and data-fitting built into its very nature. Back-testing is still valuable, of course. If a trading system or strategy couldn’t win in the past, how could we expect it to win in the future? People hope that history will be repeated in the future. This is why back-testing of trading systems has become popular in the last two decades.
Historical forward testing (HFT; also called trading simulation), on the other hand, is one major step closer to providing results that are like those obtained from real trading.
AbleSys has developed the industry’s first trading simulation software - HFT in 2000. At the request of a trader using the system, the software will derive a set of parameters from a set of “sample data,” and then will apply those parameters to forward moving “out-of-sample data.” The HFT routine allows traders to simulate what they would have done with a real trading account in the past based on the trading system they are testing. The simulation routine will automatically select system parameters for use with the sample data. After that it moves forward in time to test the out-of-sample data with those parameters preselected. Step-by-step, the program will cover the whole data range.
How does the HFT work?
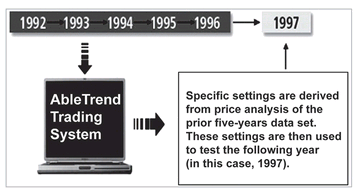
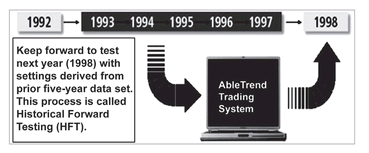
Figures 7.1 and
7.2 visually display the basic concept of the HFT. For example, you might use the first 5 years (1992 to 1996) of a 10-year set of sample data to auto select parameters, and then use the preselected parameters to test system performance results for the 6th year (i.e., 1997). This procedure can be repeated again and again as you go through 10 years of historical data. The cumulated forward-testing results tell us how well the trading system would have performed in the past. The results of HFT are a
simulation of real trading, not back-testing, and the data it provides is much closer to real trading results.
FIGURE 7.1 General methodology used by AbleTrend for HFT. It uses prior five-year historical data (the five-year sample data period 1992 to 1996) to derive the settings (parameters) of a trading system. These settings are then used to test the following year (the forward-testing period, 1997).
FIGURE 7.2 HFT price analysis procedure. The last five years’ worth of price data for each market are analyzed by AbleTrend trading system. From the analysis, system-specific parameter settings are derived for each market. These settings are then used to trade each market for the following year. This procedure of price analysis is then moved forward each year to the present. It is called historical forward testing (HFT). Here, in the example, the five-year sample data period was moved forward one year, 1993 to 1997. The forward-testing period was also moved forward one year, to 1998.
For daily charts, using 2- to 5-year data to run back-testing, you will get parameter settings from the back-testing. Fix the settings; apply it to the next forward-testing data. The computer program will give the overall forward-testing results, as long as correct parameters are used for a given time period.
Advantages of Historical Forward Testing (HFT)
Basically, historical forward testing solves the problem of validating a trading system. Trying to do so strictly with back-testing can easily give false guidance for the future; however, if a trader must validate a trading system with real money in real-time trading, it can be quite expensive and time consuming. Additionally, only one or two months of testing real-time trading means nothing to the validation of a trading system. It simply isn’t enough time for a rigorous test. The HFT software solves this problem, and makes that which was impossible—a rigorous test of a trading system with simulated trading—a reality.
Advantages of HFT are summarized in
Table 7.1, when compared with back-testing.
System Efficacy Validating a trading system helps to build system efficacy, which is closely related to system confidence: the positive judgment of a system’s capability to perform. System efficacy does not refer to the actual capability of the system, but rather the system’s ability to convince you of its capability. System capability alone is not enough to guarantee its best performance—the system has to demonstrate and convince the user that it is capable in order for it to be best utilized in real trading.
There is a big difference in behavior between those who trust in their system and those who have doubts. A trader who trusts in his system will follow it, entering and exiting the market when he is signaled to do so. A trader who has doubts will hesitate until he can’t stand to sit on the sidelines anymore. When it comes time to exit, he will doubt the system again and be unwilling to exit until losses are too large to bear. As a result, those who believe in their system will perform better in real trading. It is easy to see why system efficacy is extremely important.
TABLE 7.1 Comparisons of Back-Testing and Forward Testing
| Back-Testing | Forward Testing |
|---|
| Validation | Traditional validation | One step closer to actual results |
| Trading system parameters (inputs) | Fixed parameters | Parameters derived from in-sample set, and move forward with time |
| Data set | Fixed in-sample data set | Applied to unknown out-sample data set |
| Benefit (saving time and money) | Benefit of hindsight | Simulates actual trading process—turn years of work to minutes; a money-saving tool |
| Confidence | Wish it would continue working | More likely working |
| Simplicity | Simple and easy | Time consuming, or need specially designed software |
Validation of Trading Strategies HFT is a logical way to validate the ongoing recalibration process as well as system performance. Having the right procedure for recalibrating a system is every bit as important as the quality of the system itself, if not more. HFT is another major step toward scientifically proving a system’s results so that traders can build faith in long-term system performance. With faith comes the confidence and discipline required for long-term success.
Turn Years of Work into Minutes Some of our most advanced users have achieved great results by using “manual forward-testing techniques.” But the manual testing procedure was very time consuming and tedious. That is why AbleSys has devoted ongoing research and development effort to this issue, and why it is such a benefit to traders that we have now successfully automated this process! Some HFT routines take a 3-GHz CPU computer 60 minutes or more to run. Just imagine how long it would take you to do manual testing with different combinations of sampling data and out-of-sample data, and with different combinations of TSPC/DEV! It would be impractical to even attempt it. But now, thanks to our software developers, it is possible for traders to put this advanced information technology to use and replace their manual testing.
Money Saving Tool How much money do you need to validate a trading system in real-time trading? In addition to the money and time spent researching your system in the markets, you might face huge losses in your trading account if you trade real money during the experimental stage of developing your trading method. Trading simulation (HFT) offers the advantage of providing near real-time results without the expense.
The results are much more valuable than you would get with back-testing. The major difference between back-testing and HFT is that HFT is much closer to reality. People have lost hundreds of thousands of dollars trading without validation of their systems or methods. The trading system is your weapon in war, like a laser-guided missile. If the missile has not been tested or correctly recalibrated, how could you trust it and use it correctly in a war? The military has spent billions and billions of dollars on the testing and recalibration of instruments for their weapons. As a trader, do you have a plan to sharpen the effectiveness of your weapon?
Data Range and Frequency
One of the frequently asked questions for a mechanical trading system is how far the back-testing should go and how frequently we change the system settings. As we explained in Chapter 5, the ratio of back-testing days to forward using days is about 5:1 or 6:1. HFT studies can obtain the best ratio for each individual market. Here are two terms used in HFT.
1. Sample data period means sample data range, which represents a set of historical data. For example, if you want to use the past 300 days of data to get optimal input settings for the next 30 trading days, then 300 days is the sample data period.
2. Forward-testing period refers to how the system is to be recalibrated. Auto Select parameters are recalibrated every “xx” days, according to the schedule set by the user. This is an “Out-of-Sample Data” set, which represents the future-testing data, compared to the sample data. For example, if you want to use the past 30 trading days of data to recalibrate the system for the next five trading days, then this “xx” would be five.
After the first five days of the forward-testing period, the trading simulation routine will move forward to reset the sample data including the first five days of the forward-testing period. The software will repeat the recalibration and test procedures step by step to go through the whole data range.
AUTOSCAN
AutoScan is used to help you search for the best candidates in the markets you monitor. It allows you to save lists of symbols, and apply indicators like AbleTrend1, AbleTrend2, EMA, MACD, Volume, etc., to their charts.
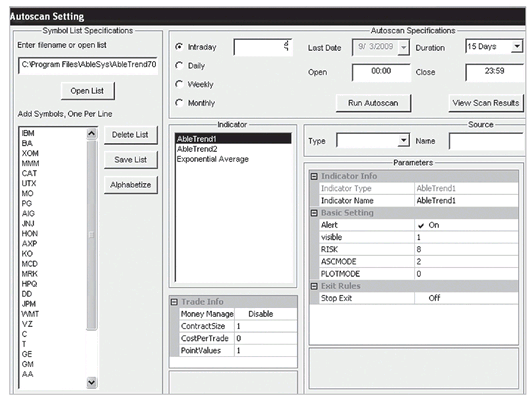
Figure 7.3 shows an example of AutoScan.
The classical trading method is to set up a chart with a trading system or indicators to monitor the markets. Traders have to wait for buy/sell/stop/exit signals to trade the specific market.
AutoScan is designed to allow another way to trade: You don’t wait for the optimal entry or exit points for a specific market. The software automatically scans many markets and alerts you to which ones have the best setup for entry or exit points. AutoScan for intraday real-time charts does an especially good job! For example, you may select 20 or 30 markets with 5-minute charts and run AutoScan once. As soon as AutoScan runs, it will “monitor” all the symbols in the custom data list in the background. Then, in real time, it will alert you if the buy/sell conditions are met. As soon as there is an alert for any market, AutoScan will send out visual, sound, or e-mail alerts. Compared to the classical trading method, you have many more choices given to you of markets that are presenting the best conditions to trade. You don’t have to wait for entries.
AutoScan can be done with daily, weekly, monthly, or intraday charts (such as 5-minute, 30-minute, etc.). Typical parameter settings of the AutoScan can be seen in
Figure 7.3.
THE PERCENT CHARTS
There is a big demand for comparisons of the tradability of different markets. For example:
• How does the Dow Jones industrial average (DJIA) index compare with the S&P 500 index and the NASDAQ index?
• How do EUD/USD, GBP/USD, and AUD/USD Forex markets compare with one another? Which one is the best for trading if you can select only one?
• How do you compare several tech stocks with each other, such as MSFT, INTC, and DELL? Which one is the best for trading if you can select only one?
The price scales of the markets just mentioned are different—very different—from one another, and therefore it is difficult to plot them on the same chart to compare them. However, if we may select a day, and assume the prices of that day as the corresponding market’s “unit,” we may convert all the historical data of the past to a percentage based on the units, and then compare them. Now we will have the same scale data sets with percentage units. They are called the “Percent Charts.” We may easily display and compare which market is moving faster within the same time period.
For example, on July 9, 2009, DJIA was 8,146.52, S&P 500 was 879.13, and NASDAQ was 1,756.03. We assume the 8,146.52 as the unit for DJIA, and we may then convert all the historical data of DJIA to a percentage. Following the same procedure, we set the 879.13 as a unit for S&P 500, and 1,756.03 as the unit for NASDAQ, and based on that, we then convert the S&P 500 and NASDAQ historical data to percentage data. Now we may display the three markets on the same scale chart. We can then easily know that as we are looking at the charts in 2009, NASDAQ has the best performance, followed by S&P 500, and finally DJIA. If you can choose only one market to trade, you might choose the NASDAQ based on the comparisons of the percent charts of three markets.
Using the same procedure, we may plot the percent charts of EUR/USD, GBP/USD, and AUD/USD to the same chart. We might use the bottom of the March 2, 2009, closing prices of these symbols as the unit. After doing this, it is easy to see that AUD/USD moved up 123.54 percent, GBP/USD moved up 115.37 percent, and EUR/USD moved up 110.76 percent in four months. Trading profits are made from the market movements. For traders, if a market can move in a larger range within the same time, it is a better trading vehicle. Therefore, we would select to trade AUD/USD in the example.
Using this same approach, we may compare crude oil and gold futures, DJIA and $VIX, INTC and DELL stocks, and so forth. Looking at normal bar charts, your eyes cannot easily see the relationships between markets. With percent charts, relationships are visually displayed. For example, you might notice that the top of the $VIX line is the bottom of the DJIA line. You may get useful information from percent chart comparisons that give visual hints for our trading.
THE GUIDANCE CHARTS
In Chapter 5, we mentioned it can be helpful to use the trend direction on daily charts to guide our trading with intraday charts. Here the daily chart is used as the so-called guidance chart. Of course, you may also use the 60-minute chart as guidance to trade the 5-minute chart, etc. Our back-testing reports clearly show that this method can significantly improve results. If the guidance chart is trending, the winning rate could be up to 80 percent or more. If the guidance chart is choppy, of course, you may have losing trades. However, since you trade only one direction the same as the guidance chart, your losing trades would be cut in half.
There are three ways to set up a guidance chart:
1. Classical Guidance Charts: A classical guidance chart is set up side by side with the trading chart. If you use a 30-minute chart as the trading chart, you may set up a daily chart next to that chart for use as the guidance chart. Add the T1 and T2 indicators to both charts. If the daily chart is blue, indicating an uptrend, then you should take only the long trade signals of your trading chart; and vice versa for the downtrend, where you would take only the short trade signals. Some traders like to set up a few guidance charts, such as the daily, 120-minute, and 60-minute charts as guidance charts. There are pros and cons to doing this. The pro is that you have stronger confirmation of a trend if all the guidance charts are in the same direction. The con is that you may experience confusion if the guidance charts are in contradiction to each other. If this kind of confusion occurs, we suggest using the longer time interval chart (i.e., in this instance the daily chart) as your guide.
2. Overlapping Guidance Charts: Overlapping guidance charts are normally set up below your trading chart. The guidance chart is added to the same trading chart window, but in the subgraph. The time scale of both the trading chart and guidance chart will exactly line up. Add the T1 and T2 indicators to both charts. Following this method will give you a clear picture of the guidance direction. You may format the guidance chart as a line on close. If you see a blue line in the guidance chart, it means you should take the long trade only; if you see a red line, take the short trade only. Most other charting software programs are simple, and they may or may not have this ability to plot overlapping charts. If your trading software has the capability, then we suggest you try using it.
3. Hidden Guidance Charts: A hidden guidance chart is a guidance chart added to the same window as your trading chart, but it is hidden—you cannot see it. Add the T1 and T2 indicators to the trading chart and T2 to the guidance chart. The signals of the T2 indicator of the guidance chart will be displayed on the trading chart. This setting will create a magic effect on the trading chart. You may clearly view the trading signals and guidance on the same chart. You may see the guidance T2 colored dots and their values on the trading chart. This built-in capability for hidden charts in the AbleTrend software has become one of the favorite features of AbleTrend users.
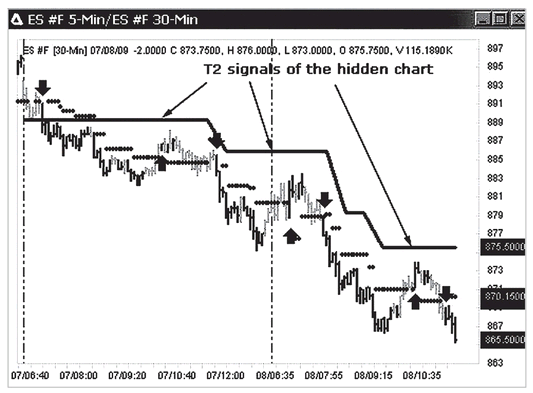
FIGURE 7.4 Hidden guidance chart. The trading chart is a 5-minute chart of E-mini S&P 500 futures. The hidden guidance chart is a 30-minute chart of the market. The T2 signal style is a colored line. The line above the bars is the guidance, which shows the trend direction is downtrend and indicates the key resistance levels on the 30-minute chart. Thanks to the guidance chart, we can take the short trades only, and avoid the long signals.
The example in
Figure 7.4 shows the effect of the T2 signals on a hidden guidance chart. The trading chart is a 5-minute chart of E-mini S&P 500 futures. The hidden guidance chart is a 30-minute chart of E-mini S&P 500 futures. The T2 signal style is a colored line. The line shows the trend direction and longer-term stop values.
STOCK SEARCH ENGINE—STOCK PICKS
There are over 10,000 stocks traded in the United States. One of the biggest differences between stock trading and futures or Forex trading is the stock-picking process. There are two issues to be faced in stock trading:
1. Which stocks should we trade?
2. How should we trade the stocks?
AutoScan of AbleTrend can be automatically linked with the WinTick stock-picking lists with a click. Doing this allows you to resolve both issues at the same time.
Stock picking is the first step in trading stocks and it is big business in itself. There are software programs, newsletters, TV programs, analyst rating services, online screen services, and so on, all of them claiming to offer stock picks with great profit potential. The goal in picking stocks is to be objective and determine good picks. However, it is important to realize that picking stocks for trading is totally different from picking stocks for investment. For making investments, using fundamental analysis to make our selection is basic. However, for trading purposes, we normally do not have any interest in fundamentals. We focus on technical analysis and whether a market is trending or choppy. Beware of stock-picking services that tell you what to trade, but do not provide back-testing reports. The stocks might be up 25 percent in two years, but they might go down 50 percent in one year, then move up, and so on. These services cannot tell you how to trade based on anything substantial.
What Is Wintick?
AbleSys’s WinTick, the industry’s first Web-based mechanical trading system with back-testing reports, is also a market search engine for hot stock picks. Using time-tested, award-winning AbleTrend technology, WinTick scans through more than 10,000 U.S. stocks and 43 futures markets at the end of day from a well-maintained database. WinTick provides extensive daily reports such as today’s hot picks, next day buy/sell target prices, back-testing performance results, performance comparison between WinTick and buy/hold, customized portfolio management, and much more. Online charting platform and end-of-day data are all included. AbleTrend1 and AbleTrend2 indicators are automatically plotted on the charts.
The Competitive Edge in Picking Stocks
Picking stocks can be an arduous task. Not only is the quantity of available stocks large (there are over 10,000 symbols to choose from), but also the characteristics of each symbol are changing constantly, and the rate of these changes keeps increasing. Without advanced technology, more information would only cause more confusion.
WinTick, the new innovation of AbleSys, offers people a competitive edge in picking symbols. No longer do you need to be tied up with the laborious task of viewing chart after chart. No longer do you need to download, review, or maintain huge databases. WinTick completely automates the search process. This fantastic feature liberates you. It gives you the power to search through a huge number of markets that you would otherwise not be able to approach. This power greatly enables you to diversify your investment portfolio.
Best of all, WinTick is based on time-proven AbleTrend technology, with no analyst’s bias involved. WinTick, which has won awards for 15 consecutive years since its release, allows traders to test the market without risking any money. The software allows traders to discover the most profitable symbols in today’s fast-moving markets before risking one penny trading. The major difference between WinTick and other stock-picking tools is its objectivity. It’s based on the 100 percent mechanical back-testing reports of AbleTrend, and therefore, its stock picks should work well with the AbleTrend trading system software. There are no other stock-picking tools or services that combine the picking process with a specific trading system.
Stock Lists of Wintick
• WinTick Top Rating Picks
• WinTick Today’s Hot Picks
• Search WinTick positions for individual stocks
• Your Portfolio WinTick Position Manager
• Stocks with the Best AbleTrend Back-Testing Results in Last 400 Days
• WinTick Major Indices
• WinTick Today’s Buy/Sell Signals: This is a list of stocks that WinTick gives position changes (from any BUY/SELL/SIDEWAY to any SELL/BUY/SIDEWAY) on the reporting date.
• WinTick Most Traded and Volume Leaders
• WinTick Today’s Winners and Losers
• WinTick Top Gainers in 1 Week
• WinTick Top Gainers in 3 Months
• WinTick Top Gainers in 6 Months
• WinTick Top Gainers in 12 Months
• WinTick 52-Week High and Low Stocks
• WinTick IPO Stocks
WinTick for Futures WinTick also covers 43 commonly traded futures markets in the United States. Daily reports for those major futures and commodities with today’s buy/sell signals and WinTick Portfolio Manager tool are also available.
VISUAL OR CHART TRADING
With the classical trading process, three steps are involved:
1. Collecting data.
2. Charting and identifying trading signals.
3. Order execution.
For order execution, there are three methods for placing orders:
1. Manual trading orders
2. Visual trading orders
3. Automated trading orders.
In recent years, visual or chart trading has become more and more popular in trading software. The major feature is not using the keyboard at all, using only the chart, graphic lines, and mouse.
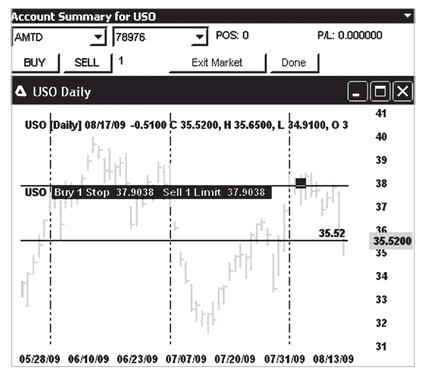
Visual order placement is built-in to AbleTrend software. The program allows you to click an icon labeled “Trade Mode”—TM to place a market, stop, or limit order directly from the chart with your mouse clicks (see
Figure 7.5). All you need is your mouse and a visual display line position on the chart. The position of your mouse on the chart will be your stop or limit order price. As soon as the orders are filled, the up- or down-arrows represent your open or close positions. The blue or red lines are your open protection stops or limit orders.
FIGURE 7.5 Chart trading mode. Market, stop, or limit order is just one click away. For example, the last price for stock USO is 35.52. When you put your mouse above the last price, you may click to place a “Sell Limit” order or “Buy Stop” order.
As soon as your order is placed, you will see a line or arrow representing the order or position on the chart. You may drag and move the line to change your stop or limit order, and you can exit or change the order with just one click. This allows you to visually see where your positions are in relation to the graph, and it works especially well with a visual trading system like ours, where support and resistance are plotted on the chart. Also the P/L will keep tracking the position’s profit/loss in real time.
AUTOMATED TRADING ORDERS
Auto Order Execution (AOE) is a feature built in to the AbleTrend software that is available to traders as an option. When you have Buy/Sell/Stop/Exit signals for certain symbols, the software will automatically fill in the Order Entry form. Users are one click away from being able to “Submit” their orders. Or, you may set up “fully auto mode” to submit your orders automatically without any human intervention. This will significantly increase the speed of order executions. The Auto Order Execution module works with Money Management strategies. It will automatically fill in the proper trading size according to your current account equity (balance). Order execution becomes just a click away, or it can be fully automated.
Advantages of Auto Order Execution (AOE):
• Electronic hands-free automated trading.
• Helps to significantly minimize slippage.
• Helps to reduce the influence of human emotions.
• Helps to reduce the influence of human emotions.
• Trading signals and market orders are simultaneously sent.
• Orders can be filled almost instantaneously.
• Best used with 24-hour markets.
• Appropriate for trading intervals of 30 minutes or above.
In case of emergency or power down: In trading, anything can go wrong. In the event of a power down, or the Internet going down, or the computer locking up, or other emergency situations, the trading software’s AOE cannot do anything at that time. Traders would have to call their broker to help take care of their trading positions in these situations. As soon as the computer and software come back on, the first thing the AOE module does is to automatically align your trading account positions with the charts’ positions.
OPTIONS TRADING
There are two kinds of options, calls and puts, for stock, futures, and commodity trading. Calls give options purchasers the “right” to buy the underlying market at a specific price (strike price) within a certain period of time (before exercise date or expiration). Puts give options purchasers the “right” to sell the underlying market at a specific price within a certain period of time (before exercise date or expiration).
Options are purchased for a set amount of money, known as the premium. The advantage of buying options is that traders have the right to buy or to sell the underlying market at certain prices, but their risk is limited to the premium paid. Only the simple options—buy calls or buy puts—can offer this advantage. Any strategies that involve sell calls or sell puts will expose the trader to unlimited risk.
There are six factors affecting options prices:
1. Underlying market price.
2. Strike price.
3. Volatility.
4. Time to expiration.
5. Interest rate.
6. Dividend.
Among these, the underlying market price is the king. Fortunately, AbleTrend only deals with the market price—the key element for options, and therefore AbleTrend is the most powerful tool for trading options.
What’s the Most Efficient Way to Trade Options?
Options trading has been getting more and more complicated in recent years due to the efforts of some “options universities” and “experts.” For example, I took a look at one course that offered over 30 options trading strategies. Eventually people seemed to forget why they were trading options in the first place.
AbleTrend sticks to the basics by providing core information concerning the market trend (its up or down direction). As mentioned earlier, the underlying market price is king. Our options strategies become simple and easy to implement if we know whether the market is rising, flat, or declining in direction. We may simply buy near-term in-the-money calls if the market is in an uptrend, or buy near-term in-the-money puts if the market is in a downtrend. This is the most efficient way to trade options.
What Is the Delta in Options Trading?
All the complicated options strategies that have been offered are for people who don’t know the market direction (trend) and are trying to protect themselves from possibly big losses if they choose a wrong direction. AbleTrend, however, provides the key market trend information for underlying price change so that traders may choose the simplest and most effective strategy—buying calls or buying puts according to the trend direction.
Traders will get the biggest Delta for such options, and are in a position to really make money from the market trend. Delta in options trading indicates how fast an options is changing in value relative to the price of the underlying stock or futures contract. Delta can range from 0 to 1 for call options, and from 0 to −1 for put options. The higher the Delta, the more the options increases in value relative to the futures price, and the more profitable the options is. For example, with a Delta of 1 (for a call options), the options price is increasing one to one with the underlying price. This would be the ideal condition.
With the simple Buy Calls or Buy Puts strategy that AbleTrend users employ, the Delta is an impressive 0.7 to 0.9 in most cases. This means that traders may have limited risk, while enjoying the biggest possible profits.
If the overall Delta is positive, it means you hold an overall long position. If the overall Delta is negative, it means you hold an overall short position. And the position should follow the AbleTrend direction.
SPREAD TRADING
We will now examine spread trading methods with respect to trend analysis. Futures spread trading is probably one of the most profitable, yet safest ways to trade the futures markets. Professional traders use spreads to optimize their profits. Trading spreads offers many advantages that make it an ideal trading instrument, especially for traders with small accounts (less than $10,000).
What Is a Futures Spread?
The terms “spread” and “straddle” are synonymous, and refer to the simultaneous purchase and sale of futures contracts. There are several different varieties of spreads:
• Inter-delivery—a spread on the same exchange, in the same commodity, in different delivery months.
• Inter-market—a spread in the same commodity, but on different exchanges. Inter-commodity—a spread between two different commodities having the same delivery month on the same exchange.
• Commodity product—a spread between a commodity and products derived from that commodity; for example the soybean crush and reverse crush spreads. A soybean crush spread combines long soybean futures with short soybean oil and soybean meal futures positions.
Traders should be aware that the spread position is not necessarily less risky than a simple long or short position.
Futures spread trading offers the following four advantages:
1. A better trend that is easy to trade.
2. Low margin requirement.
3. Higher return to margin.
4. Less time is involved.
Why Spread Offers a Better Trend
We will look more closely at the first advantage: why these trades offer a better trend.
Spread trades are allowed to trend without the interference and noise caused by computerized trading, scalpers, and market movers. Each market has so-called market noise produced by random market forces—for example, Joe wants to close his positions now due to a family emergency or a news release he read. When trading a spread, we subtract one market price from another, and the normal noise in the two markets tends to cancel each other out, leading to a significant reduction in noise. As a result, the real difference between the markets will show more clearly. If the markets are trending, the differences between those trends are much more visible.
PORTFOLIO TRADING
This is a conservative model through diversification: Position Trading with “Fixed” settings and daily charts (trading the mid-term trend).
Advantage of Diversification
There is a distinct advantage to creating a diversified portfolio of markets to trade using the AbleTrend 100 percent mechanical trading system. The fact is that total profits of the portfolio is the sum of profits of each individual market. Total overall maximum drawdown (MDD) is less than the MDD of each individual market. Therefore, we may see a much better reward/risk (R/R) ratio.
Here
R/R = Total Profits / Overall MDD
Based on our previous experiences, if R/R for an individual market is 2 to 3, then the overall R/R of a market portfolio could reach 10 or above.
Diversification spreads your risk across numerous financial instruments, reducing the impact that poor returns from any one investment is likely to have on your overall portfolio.
How Diversification Works
Diversification follows a simple logic:
• The prices of individual stocks and/or futures markets often do not rise and fall or trend in tandem. When one type of investment is trending, another may not (it may be exhibiting whipsaw or choppy price action).
• By trading in two or more types of financial instruments, you increase the possibility that when one is doing poorly, another might be doing well. Your winner’s good performance can offset your loser’s disappointing returns.
• The end result: Your portfolio’s overall performance is likely to be less volatile, that is, undergo less account equity fluctuation, than a portfolio invested in just one financial instrument. Put another way, your well-diversified portfolio will achieve higher returns for a given level of risk.
• Don’t put too many markets into one portfolio. Normally we build a trading portfolio with four to six markets. In recent years, people have tended to add a few ETFs to a portfolio, for example, SPY, QQQQ, etc. SPY alone is composed of 500 stocks, and QQQQ is composed of 100 stocks.
Keep in mind that although diversification can’t entirely eliminate market risk, it will generally have the effect of creating less overall risk, resulting in a smoother equity yield curve with more manageable drawdowns.
Ways to Diversify
The first and most conservative strategy is to create a diversified portfolio of traded markets using longer time interval bars such as the daily charts. We have already done the work to show you various combinations of fixed parameter settings (based on daily charts and mid-term trend) one could trade, along with recommended start-up amounts based upon historical drawdown and margin requirements.
Examples of Portfolio Trading Using Abletrend
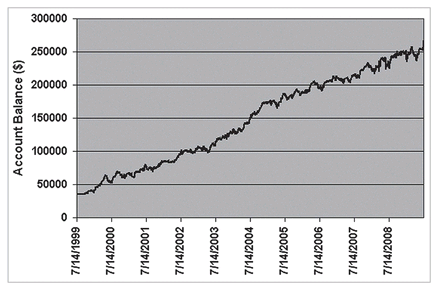
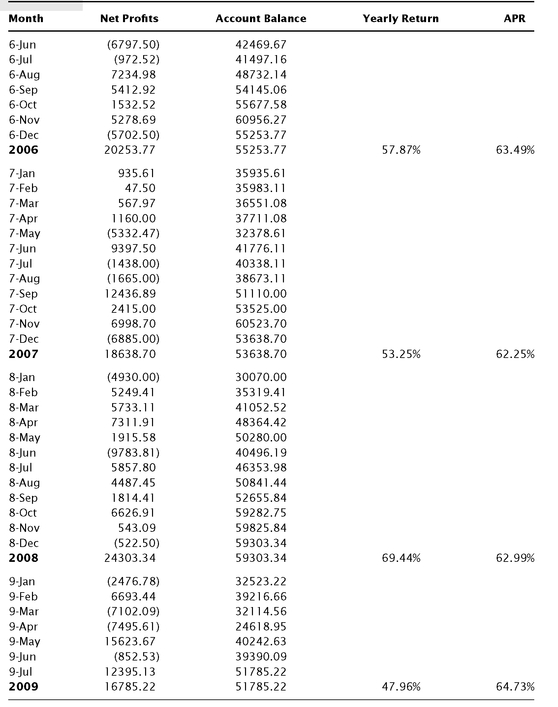
Futures Portfolio Using fixed parameter settings and back-testing for the last 10 years with four futures markets—US Dollar Index (DX), Crude Oil (CL), Soybean (S), and Treasury Bond (US)—the account equity line for the last 10 years for this portfolio with daily charts is plotted in
Figure 7.6. The overall testing results are summarized in
Table 7.2. Combined net profits, MDD, R/R, minimum account size, and percentage return are listed in the table.
Example of Futures Portfolio (10 Years):
Back-Testing 8/26/1998 to 1/5/2007
Forward-Testing 1/5/2007 to 7/10/2009
Portfolio: DX, CL, S, and US (daily charts)
FIGURE 7.6 Example of a portfolio equity line plotted in Microsoft Excel. AbleTrend software can output equity line to a text file. This equity line showed more smoothly with a portfolio, and parameters derived from a back test can be fixed and keep working for a long-term forward testing (two and a half years in this example).
• Initial Account Size: $35,000.
• Net Profit: $231,983. Each market trading 1 contract along the way.
• $75 cost per trade was deducted. Forward testing: all parameters were fixed on 1/5/2007.
• Use daily chart and EBC results (100 percent mechanical).
• Money Management routine was not used to compound the results. Also, at the beginning of each year, the account was reset to the initial size.
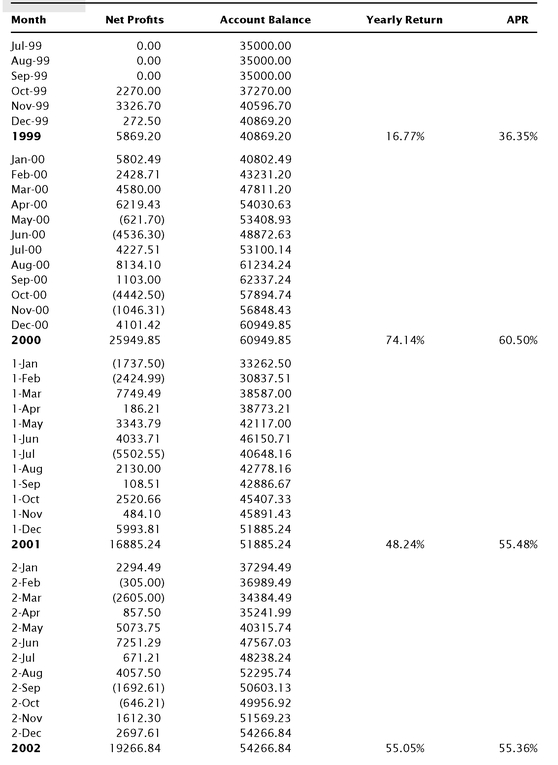
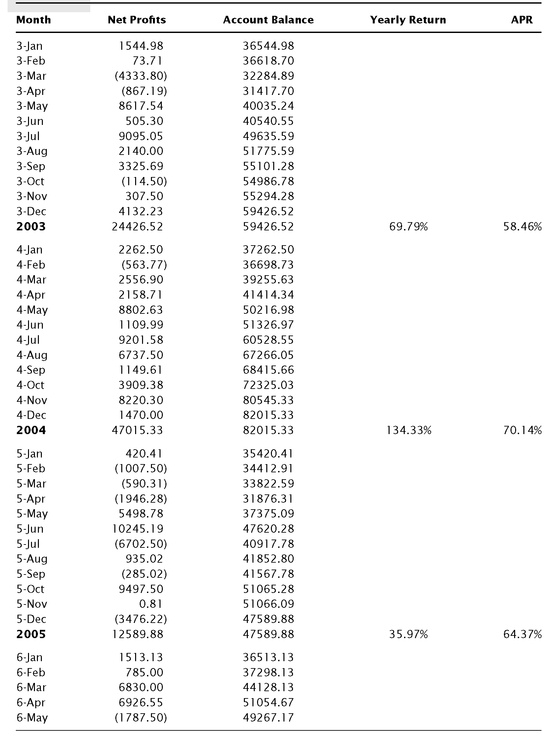
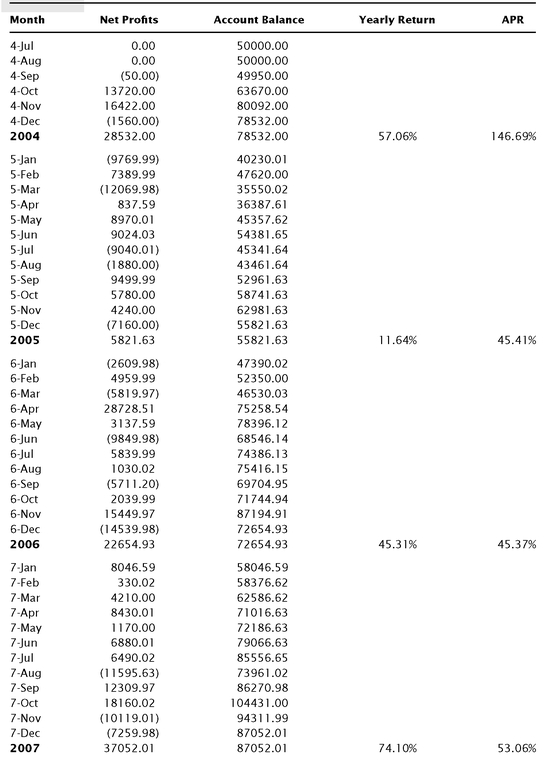
This example of futures portfolio trading showed a smoother account equity line. Reward/Risk (R/R) ratio could reach over 10 while individual market’s R/R had only 2 to 5. Both back-testing and forward testing worked well. The parameters derived from a back test can be fixed and keep working for a long-term forward testing. Month-by-month performance (the net profits) of the portfolio is summarized in
Table 7.3.
TABLE 7.3 Month-by-Month Report of Futures Portfolio
FIGURE 7.7 Example of a portfolio equity line plotted in Microsoft Excel. AbleTrend software can output equity line to a text file. This equity line showed more smoothly with a portfolio, and the equity line was up during the economic crisis from late 2008 to early 2009.
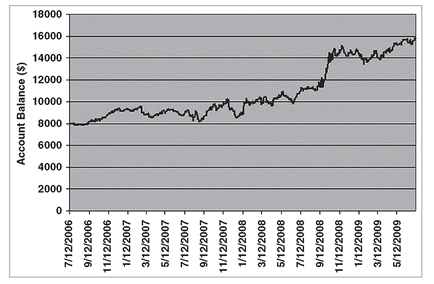
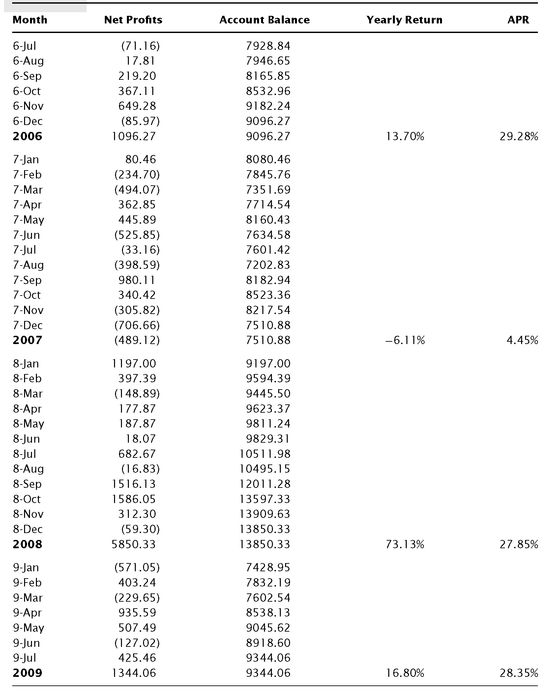
Stock Portfolio Using fixed parameter settings, an account equity line of back-testing for the last three years for DIA, QQQQ, EWH, XLE, XLB, and GLD daily chart is plotted in
Figure 7.7. The back-testing is from 7/10/2006 to 7/10/2009.
The back-testing results are summarized in
Table 7.4. Combined net profits, MDD, R/R, minimum account size, and percentage return are listed in the table.
• Initial Account Size: $8,000.
• Net Profit: $7,801.
• Select six stocks from ETFs.
• Each stock started trading with $1,000.
• $20 cost per trade was deducted.
• Use daily chart and EBC results (100 percent mechanical).
• Money Management routine was not used to compound the results. Also, at the beginning of each year, the account was reset to the initial size.
This example of ETF portfolio trading of the last three years showed a smoother account equity line. Back-testing worked well during the economic crisis from late 2008 to early 2009 while many portfolios dropped 40 percent in value. Each ETF market is a portfolio. Month-by-month performance (the net profits) of the portfolio is summarized in
Table 7.5.
TABLE 7.5 Month-by-Month Results of Stock Portfolio
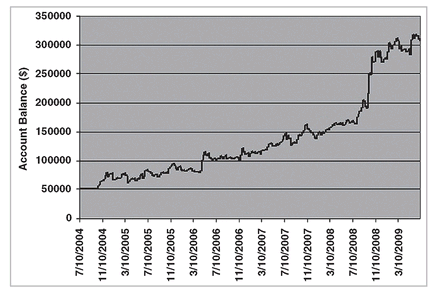
FIGURE 7.8 Example of a portfolio equity line plotted by Microsoft’s Excel software. AbleTrend software can output equity line to a text file. This equity line showed more smoothly with a portfolio, and fixed parameters can work well for Forex markets in a long term (five years in this example).
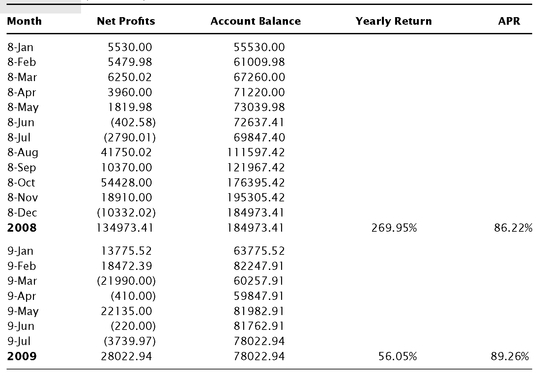
Forex Portfolio Using fixed parameter settings, this example of Forex portfolio back-testing is for AUD/USD, USD/CAD, USD/CHF, EUR/USD, GBP/USD, and USD/JPY markets for the last five years. An account equity line for the last five years for this portfolio with weekly charts is plotted in
Figure 7.8. The overall back-testing results are summarized in
Table 7.6. Combined net profits, MDD, R/R, minimum account size, and percentage return are listed in the table.
Example of Forex Portfolio
Back-testing with weekly charts of five years (7/10/2004 to 7/10/2009)
• Initial Account Size: $50,000. Net Profit: $257,057.
• Each market trading one contract along the way. $50 cost per trade was deducted.
• Use weekly charts and EBC results (100 percent mechanical).
• Money Management routine was not used to compound the results. Also, at the beginning of each year, the account was reset to the initial size.
TABLE 7.7 Month-by-Month Results of Forex Portfolio
This example of Forex portfolio trading of the last five years showed a smoother account equity line. Forex markets are the most trending markets. With the portfolio trading six markets, the Reward/Risk (R/R) ratio was above 9, indicating a very good performance. An APR of 89 percent showed Forex markets are very good trading instruments for trend-following methods. Month-by-month performance (the net profits) of the Forex portfolio is summarized in
Table 7.7.
SUMMARY
We briefly introduced here some advanced tools of today’s trading software, including AbleTrend or other software. We covered virtual paper trading (VPT), historical forward testing (HFT—trading simulation), AutoScan, percent charts, guidance charts, stock pick tools, visual or chart trading, automated trading orders, options trading, spread trading, and portfolio trading. Each of the topics could be written as a chapter or a book. However, this book focuses on trend analysis and trend trading methods; therefore, we keep our discussion brief.
We suggest that you review Chapter 2, our results of 15-year studies on the new concepts of trend, support and resistance, and trend-following principles.
The market is like a wide river. Market trends are like powerful currents. The market follows its own way. No one can stop it. It’s a law of nature: Water always flows down from high to low naturally. As Tao says, “The best of best methods is like that of water.” So don’t go upstream. In fact, the river is not your enemy. It doesn’t even know who you are. Water in the stream follows its own way and is guided by the natural laws that underlie its movement. You cannot change it and will likely pay the price for trying. But you may attune yourself with it. Go the way it’s going. First understand the trend; you will then understand how to trade it.
