SEVENTEEN
Presenting the Results
In most dissertations, the results of the data analyses are presented in a separate chapter—the fourth chapter. In some qualitative studies, the results are reported in detail in two or three chapters. Regardless of the number of chapters, there are certain strategies you can use.
PREPARE TO PRESENT THE RESULTS
Before turning to issues of organization and writing, you should take two preparatory steps. First, review the results carefully. If you used a statistical package for data analyses, repeat the analyses to verify the accuracy. Second, check the style guide for the format of tables and figures if you plan to present some of your data in these formats.
DECIDE ON THE CONTENTS AND FORMAT OF THE CHAPTER
In the initial planning process, review your data and decide the following content and format issues:
- What will be included in the appendix of the dissertation? These materials are typically included in the appendices: instructions to participants, questionnaires and survey forms, copies of instruments used, and letters of access and permission.
- What will be included in tables? In general, tables are used to present complex data in columns and rows. Tables are useful since they present multiple data in a form easy to understand. As the APA Publication Manual notes, however, they also have two disadvantages: too many tables distract the reader and complicate the processing of text.
- What figures will be needed? A figure is any illustration other than a table; the term figure includes graphs, photographs, and line drawings. Figures are especially useful in showing nonlinear relationships. A figure should be easy to read and should complement, not duplicate, the text.
In determining the contents of this chapter, you do not need to interpret the data—present only your analysis or analyses as well as any resulting statistical significance or nonsignificance if applicable. Your last chapter will typically include a summary and a discussion. In most dissertations the “discussion” section is the best place for interpretation. If you include interpretation in the “results” chapter, you will not have much new to say in the final chapter, which may be the more important chapter for the reader.
DETERMINE THE ORGANIZATION OF THE CHAPTER
Your decisions about content and format will simplify the development of your outline for the chapter. As with the methodology, you have several choices about the order to use:
- By hypotheses. If your study involves research or null hypotheses, you may decide to order by hypothesis: Hypothesis 1, Hypothesis 2, and so on.
- By research question. If your study involved two or more specific research questions, then ordering in terms of those questions would be useful: Question 1, Question 2, and so on.
- By research method. If you used multiple methods, grouping the results in relation to the methods may be helpful: interview results, survey results, and so on. By chronology. If the time order is important, then organize by chronology: entry, middle phase, and exiting. You can also use a chronological pattern in studies that relied chiefly on testing: pretest results, followed by posttest results.
- By variable. If the variables are critical to the study, then order by variable, such as age, self-concept, and achievement level.
Obviously several patterns can work. One way of deciding is to reflect in this manner: “I stated the problem in Chapter 1; I explained my methodology in Chapter 3; I will summarize in Chapter 5. How can I best take my reader from Chapter 3 to Chapter 5?” Also, keep in mind the advantages of consistency. If readers find three null hypotheses in Chapter 1, and then discover in Chapter 3 that the methodology was presented in relation to those three null hypotheses, they will expect to find the three null hypotheses governing the reporting of results. However, keep in mind that first-person personal pronouns should be avoided, especially in quantitative studies.
Submit your outline to the dissertation chair and make any revisions necessary. Remember that you should always write from an approved outline; doing so will avoid much unnecessary revision.
DEVELOP THE TABLES AND FIGURES
Before you begin to write the text of the Results or Analysis/Analyses of Data chapter, create all the tables and figures that you will need. While it is possible to make the tables and figures as you write the text, you should find it simpler to make them first, since doing so will simplify the writing task. The APA Publication Manual (2010) offers several questions to help you make effective tables, paraphrased as follows:
- Is the table essential?
- Is the entire table double-spaced?
- Is the title brief but clear?
- Does every column have a column heading?
- Are all abbreviations and symbols explained?
- Are notes presented in proper form and order?
Figures also should meet specific criteria: They supplement without duplicating the text; they convey only the essential facts, omitting distracting information; they are easy to read and understand.
WRITE THE INTRODUCTORY PARAGRAPH
In writing the introductory paragraph of this chapter, you might find it useful to begin with a sentence that restates the problem, simply to remind the reader. Then follow with a sentence that provides an overview of the chapter. Here is an example:
As stated in Chapter 1, the study examined the problems encountered by teachers as they developed and used performance assessments in their planning and teaching. This chapter is organized in terms of the three null hypotheses presented in Chapter 1. The study first examined the problems teachers encountered in developing performance assessments; it then inspected the difficulties they experienced in using those assessments in their teaching. Finally, the need for training to use the results of such performance assessments was addressed.
WRITE THE FIRST SECTION
In general, you will find that this pattern works in writing each section. First, state a generalization that summarizes the results. Then refer to any table or figure that you have developed. Finally, provide the specific evidence. Here is an example, using the contrived table shown in Exhibit 17.1.
Note that the narrative text does not simply rehash the information presented in the table. Instead, it calls attention to the major findings. The writer assumes that the reader can locate in the table all the specific data needed.
In writing this and succeeding sections, remember the importance of objectivity. Report the results without interpreting them or using modifiers that imply a point of view.
WRITE THE REMAINING SECTIONS, USING APPROPRIATE HEADINGS
Use that same pattern in writing the remaining sections. Remember to use the appropriate levels of headings to clarify the organization of the chapter. When you have finished writing the main sections of the chapter, write a brief concluding paragraph that notes generally what you have discovered and points the reader to the following chapter. Here is an example:
The results presented above indicate clearly that the teachers in this study experienced greatest difficulty in using performance assessments as a basis for their teaching. A more detailed summary and a discussion of the findings are presented in the next chapter.
Exhibit 17.1
Primary Sources Used
Teachers in 2007 have changed in the primary source used in making long-term plans, compared with their counterparts in 1986. As indicated in Table 1, more of the 2007 teachers are using the state test as a guide, and fewer are relying upon the textbook and their own knowledge of students. (See Table 1.)
Example of Table
Table 1 Primary Source Used for Developing Long-Term Plans for Instruction
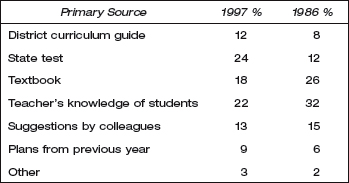
Note: Totals do not equal 100 because of rounding.
REVISE THE CHAPTER AND SUBMIT IT FOR REVIEW
In revising the chapter, keep in mind the criteria listed in Exhibit 17.2. They will remind you of the key characteristics desired in this chapter. When you have finished your own revision, submit it to your dissertation chair for his or her review.
Exhibit 17.2 Criteria: Presentation of Results
Does the presentation of results …
- Use an appropriate organizational pattern and make that pattern clear to the reader?
- Report results accurately and objectively?
- Effectively integrate text with tables and figures, without unnecessary repetition?
- Use format for tables and figures as specified by the style manual?
- Emphasize results, without excessive interpretation and discussion?
TECHNOLOGY TECHNIQUE: USING SOFTWARE TO CREATE FIGURES AND TABLES
For formal papers such as dissertations and theses, tables and figures are a necessity. Tables and figures are an easy approach to presenting information in a format that is easily understood by the reader. For the author, tables and figures can be a nightmare to create and format. With today’s software—both word processing and spreadsheet—the creation of tables is simpler. But the author needs to be familiar with the software and the “ins and outs” of such software to use it effectively and efficiently. Otherwise, the author may experience extreme frustration with the software. Both word processing and spreadsheet software allow the creation of tables; consequently, the author must decide which one is the optimum for his or her use.
To use this option, the author needs to know the number of columns and rows in a table. Thus, prior to creating the table using the word processing or spreadsheet software, a “hard copy, paper, draft” version of the table needs to be prepared. At some point in the process, the title for the table should be considered because the number of lines used for the title impacts the creation of the table. For example, the sixth edition of the Publication Manual of the American Psychological Association (APA, 2010, p. 129) specifies at least two lines for the table title: Table Number and Table Title. By generating a hard copy draft version, the author easily can determine the number of columns and rows needed for the title block as well as the entire table. When determining the number of rows, any footnote lines need to be considered.
Word processing software, such as Microsoft Word, has a “Table” option; this option may be found as a separate menu item or it may be a submenu. The location of the Table option in Microsoft Word depends on the version of the software. In Microsoft Word 2010, the Table menu item is found as a submenu under the Insert tab on the ribbon at the top of the screen. When examining the submenu for “Tables,” an author may see several options. The available options may be used, but their use should be limited if the author is not familiar with the capability of the option choices. It is in the best interest of the author to revise the table format prior to creating the table in the word processing software.
Spreadsheet software, such as Microsoft Excel, is a giant table composed of rows and columns; spreadsheet software is ideal for those users who are comfortable with creating a table at the computer. The author inputs the information for the table and uses the insert line or column feature to add rows or columns when needed for data that were not considered earlier. When the table is finished, use the spreadsheet software’s “cut and paste” or “copy and paste” features to move the table from the spreadsheet document to the word processing document. A word of caution: Be certain that the font and point size are the same in both the word processing and spreadsheet software; if you do not, reformatting for the font and point size will be necessary.
Thus, the author should base his or her use of the Table alternatives in either the word processing or spreadsheet software on his or her knowledge of the software and his or her comfort level with using such technology. Otherwise, entering the information into the word processing software to create the table will be challenging and create unneeded frustration. The end result is a usable table when either word processing or spreadsheet software is used. The process used to create the table is not important—the readability and understanding of the information contained within the table is the critical element: Focus more on the information than the process!