Stories act as a ‘pidgin language,’ where both sides (users and developers) can agree enough to work together effectively.
—Bill Wake, co-inventor of Extreme Programming
Stories are short descriptions of a small piece of desired functionality, written in the user’s language. Agile Teams implement small, vertical slices of system functionality and are sized so they can be completed in a single Iteration.
Stories are the primary artifact used to define system behavior in Agile. They’re not requirements, but rather short, simple descriptions of functionality usually told from the user’s perspective and written in the user’s language. Each story is intended to enable the implementation of a small, vertical slice of system behavior that supports incremental development.
Stories provide just enough information for the intent to be understood by both business and technical people. Details are deferred until the story is ready to be implemented. Through acceptance criteria, stories get more specific, helping to ensure system quality.
User stories deliver functionality directly to the end user. Enabler stories bring visibility to the work items needed to support exploration, architecture, infrastructure, and compliance.
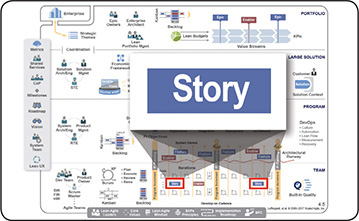
SAFe describes a four-tier hierarchy of artifacts that outline functional system behavior: Epic, Capability, Feature, and story. Along with Nonfunctional Requirements (NFRs), these Agile backlog items define the system and Solution Intent, model system behavior, and build up the Architectural Runway.
Epics, capabilities, features, and enablers are used to describe the larger intended behavior. In contrast, the detailed implementation work is described through stories, which make up the Team Backlog. Most stories emerge from business and enabler features in the Program Backlog, but others come from the team’s local context.
Each story is a small, independent behavior that can be implemented incrementally and provides some value to the user or the Solution. It comprises a vertical (rather than horizontal) slice of functionality to ensure that every iteration delivers new value. Stories are split into smaller ones so they can be completed in a single iteration (see the Splitting Stories section).
Often, stories are first written on an index card or sticky note. The physical nature of the card creates a tangible relationship between the team, the story, and the user: It helps engage the entire team in story writing. Sticky notes offer other benefits as well: They help visualize work and can be readily placed on a wall or table, rearranged in sequence, and even passed off when necessary. Stories allow improved understanding of the scope and progress:
“Wow, look at all these stories I’m about to sign up for.” (scope)
“Look at all the stories we accomplished in this iteration.” (progress)
While anyone can write stories, approving them for entry into the team backlog and accepting them into the system baseline are the responsibility of the Product Owner. Of course, stickies don’t scale well across the Enterprise, so stories often move quickly into Agile project management tooling.
There are two types of stories in SAFe: user stories and enabler stories.
Stories are typically driven by splitting business and enabler features, as Figure 1 illustrates.
User stories are the primary means of expressing needed functionality. They largely replace the traditional requirements specification. (In some cases, they serve to explain and develop system behavior that’s later recorded to support compliance, traceability, or other needs.)
Because they focus on the user, rather than the system, as the subject of interest, user stories are value-centric. To support this perspective, the recommended form of expression is the user-voice form, as follows:
As a (user role), I want to (activity) so that (business value).
By using this format, teams are guided to understand who is using the system, what they are doing with it, and why they are doing it. Applying the ‘user voice’ format routinely tends to increase the team’s domain competence; team members come to better understand the real business needs of the user. Figure 2 provides an example.
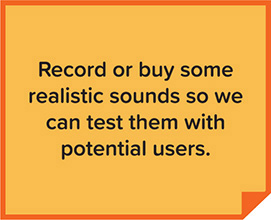
While the user story voice is the common case, not every system interacts with an end user. Sometimes the ‘user’ is a device (e.g., printer) or a system (e.g., transaction server). In these cases, the story can take on the form shown in Figure 3.
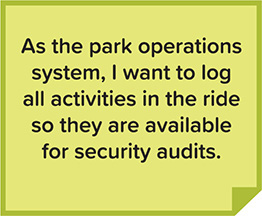
Teams may need to develop the architecture or infrastructure to implement some user stories or support components of the system. In this case, the story may not directly touch any end user. Such enabler stories can support exploration, architecture, or infrastructure, just like all other enablers. In these cases, the story can be expressed in technical rather than user-centric language, as shown in Figure 4.
Enabler stories may include any of the following:
Refactoring and Spikes (as traditionally defined in Extreme Programming [XP])
Building or improving development/deployment infrastructure
Running jobs that require human interaction (e.g., index one million web pages)
Creating required product or component configurations for different purposes
Verification of system qualities (e.g., performance and vulnerability testing)
Enabler stories are demonstrated just like user stories, typically by showing the artifacts produced or via the user interface, stub, or mock-up.
Ron Jeffries, one of the inventors of XP, is credited with describing the 3Cs of a story:
Card – Captures the statement of intent of the user story on an index card, sticky note, or tool. The use of index cards provides a physical relationship between the team and the story. The card size physically limits story length and premature suggestions for the specificity of system behavior. Cards also help the team ‘feel’ upcoming scope, as there is something materially different about holding ten cards in one’s hand versus looking at ten lines on a spreadsheet.
Conversation – Represents a “promise for a conversation” about the story between the team, Customer/user, PO, and other stakeholders. Such discussion is necessary to determine more detailed behavior required to implement the intent. The conversation may spawn additional specificity in the form of attachments to the user story (e.g., mock-up, prototype, spreadsheet, algorithm, timing diagram). The conversation spans all steps in the story life cycle:
- Backlog refinement
- Planning
- Implementation
- Demo
These discussions provide a shared understanding of scope that formal documentation does not provide. Specification by example replaces overly detailed documentation of functionality. Conversations also help uncover gaps in user scenarios and NFRs. Some teams use the confirmation section of the story card to write down what they will demo.
Confirmation – Consists of acceptance criteria that provide the information needed to ensure that the story is implemented correctly and covers the relevant functional and NFRs. Figure 5 provides an example.
Agile teams automate acceptance tests wherever possible, often in business-readable, domain-specific language. Automation creates an executable specification to validate and verify the solution. Automation also provides the ability to quickly regression-test the system, thereby enhancing Continuous Integration, refactoring, and maintenance.
To remind themselves of the elements of a good story, teams often use the INVEST model, developed by Bill Wake [1, 2]:
Independent (among other stories)
Negotiable (a flexible statement of intent, not a contract)
Valuable (providing a valuable vertical slice to the customer)
Estimable (small and negotiable)
Small (fits within an iteration)
Testable (understood enough to know how to test it)
Agile teams use story points and ‘estimating poker’ to value their work [2, 3]. A story point is a singular number that represents a combination of qualities:
Volume – How much is there?
Complexity – How hard is it?
Knowledge – What’s known?
Uncertainty – What’s unknown?
Story points are relative, without a connection to any specific unit of measure. The size (effort) of each story is estimated relative to the smallest story, which is assigned a size of ‘1.’ A modified Fibonacci sequence (1, 2, 3, 5, 8, 13, 20, 40, 100) is applied that reflects the inherent uncertainty in estimating, especially when large numbers (e.g., 20, 40, 100) are involved [2].
Agile teams often use estimating poker, which combines expert opinion, analogy, and disaggregation to create quick but reliable estimates. Disaggregation refers to the process of splitting a story or features into smaller, easier-to-estimate pieces. A number of other methods are used as well.
The rules of estimating poker are as follows:
Participants include all team members.
Each estimator is given a deck of cards with 1, 2, 3, 5, 8, 13, 20, 40, 100, ∞, and ?.
The PO participates but does not estimate.
The Scrum Master participates but does not estimate, unless this person is doing actual development work.
For each backlog item to be estimated, the PO reads the description of the story.
Questions are asked and answered.
Each estimator privately selects an estimating card representing his or her estimate.
All cards are turned over at the same time to avoid bias and to make all estimates visible.
High and low estimators explain their estimates.
After a discussion, each estimator provides a new estimate by selecting either a different card or the same one as in the previous estimate.
The estimates will likely converge. If not, the process is repeated.
Although some amount of preliminary design discussion is appropriate, spending too much time on design discussions is often wasted effort. The real value of estimating poker is to come to an agreement on the scope of a story. It’s also fun!
The team’s capacity for an iteration is equal to the sum of the points for all the completed stories that met their Definition of Done (DoD). Knowing the velocity assists with planning and helps limit Work in Process (WIP), as teams don’t take on more stories than their prior velocity would allow. This measure is also used to estimate how long it will take to deliver epics, features, capabilities, and enablers, which are also forecasted using story points.
In standard Scrum, each team’s story point estimating—and the resulting velocity—is a local and independent concern. In contrast, in SAFe, story point velocity must share the same starting baseline, so that estimates for features or epics that require the support of many teams can be understood.
SAFe uses a starting baseline where one story point is defined roughly the same way across all teams. This means that work can be prioritized based on converting story points to costs. Of course, adjustments may be needed to account for the different average labor costs across geographies (e.g., United States, China, India, Europe). After all, there’s no way to determine the potential return on investment (ROI) if there is no common ‘currency.’ Normalized story points provide a method for getting to an agreed starting baseline for stories and velocity as follows:
Give every developer-tester on the team ‘8’ points (adjust for part-timers).
Subtract one point for every team member vacation day and holiday.
Find a small story that would take about a half-day to code and a half-day to test and validate. Call it a ‘1.’
Estimate every other story relative to that ‘1.’
As an example, assume there is a six-person team composed of three developers, two testers, and one PO, with no vacations or holidays on the team calendar. In this case, the estimated initial velocity = 5 × 8 points = 40 points/iteration. Note that it may be necessary to lower this estimate a bit if one of the developers and testers is also the Scrum Master.
In this way, story points are somewhat comparable to an ideal developer day, and all teams create estimates using the same method. Management can easily determine the cost for a story point for people in a specific geographic region, which in turn provides a meaningful way to figure out the cost estimate for an upcoming feature or epic.
Note: There is no need to recalibrate team estimation or velocity after that point. It is just a starting baseline.
While teams tend to increase their velocity over time—and that’s a good thing—the number usually remains fairly stable. A team’s velocity is far more affected by changing team size and technical context than by productivity variations. If necessary, financial planners can adjust the cost per story point a bit. Experience shows that this is a minor concern, versus the wildly differing velocities that teams of comparable size may demonstrate if they don’t set a common starting baseline. That kind of variation simply doesn’t work at enterprise scale, making it difficult to make economic decisions.
Smaller stories allow faster, more reliable implementation, since small things go through a system faster, reducing variability and managing risk. Splitting bigger stories into smaller ones is, therefore, a mandatory survival skill for every Agile team. It’s both the art and the science of incremental development. Ten ways to split stories are described in Leffingwell’s Agile Software Requirements [1]. A summary of these techniques follows:
Workflow steps
Business rule variations
Major effort
Simple/complex
Variations in data
Data entry methods
Deferred system qualities
Operations (ex., Create, Read, Update, Delete [CRUD])
Use-case scenarios
Break-out spike
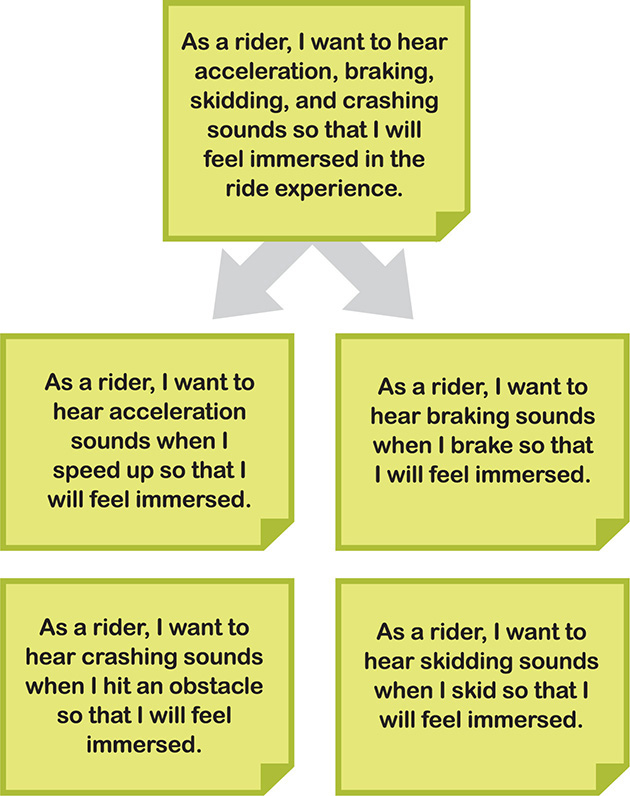
Figure 6 illustrates an example of splitting by use-case scenarios.
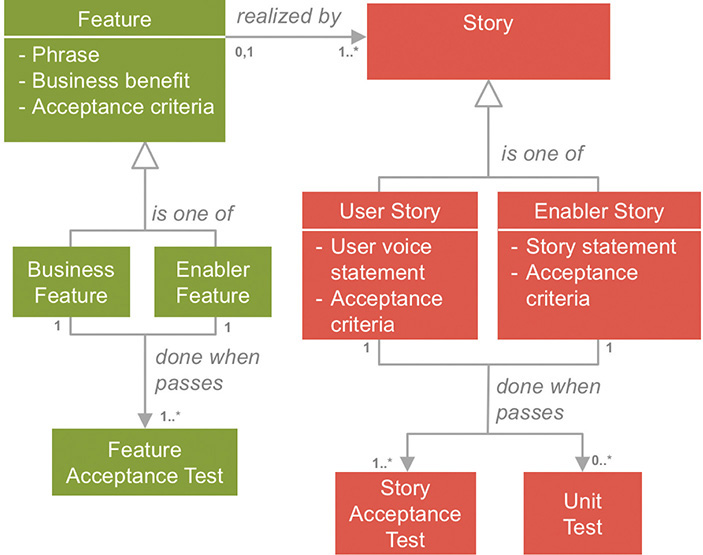
As described in the SAFe Requirements Model chapter in Part 9, the Framework applies an extensive set of artifacts and relationships to manage the definition and testing of complex systems in a Lean and Agile fashion. Figure 7 illustrates the role of stories in this larger picture.
Note that this figure uses Unified Modeling Language (UML) notation to represent the relationships between the objects: zero to many (0..*), one to many (1..*), one to one (1), and so on.
As shown in Figure 7, stories are often (but not always) created by new features and each has a story acceptance test. Further, each story should have a unit test. Unit tests primarily serve to ensure that the technical implementation of the story is correct. Also, this is a critical starting point for test automation, as unit tests are readily automated, as described in the Test-First chapter in Part 9.
LEARN MORE
[1] Leffingwell, Dean. Agile Software Requirements: Lean Requirements Practices for Teams, Programs, and the Enterprise. Addison-Wesley, 2011.
[2] Cohn, Mike. User Stories Applied: For Agile Software Development. Addison-Wesley, 2004.