12 Cyclical labor shares under Keynesian and neoliberal regimes1
Raford Boddy
Introduction
It has become increasingly accepted by heterodox economists that in the era of the Keynesian compromise, the depletion of the reserve army increased labor share, reduced the rate of profit and directly or through its impact on policy served as an integral cause of the cyclical downturns. In the era of neoliberalism, do the economic and political weaknesses of labor mean that nexus no longer operates?
In this chapter I provide a framework to understand cyclical labor shares based on reserve army theory and the influence of capacity utilization on the ability of firms to markup or pass along unit labor costs increases as price increases. While it builds on the work of colleagues it better handles the shift of labor shares from early expansion to late expansion and comes closer to a unified theory of labor share over the cycle. I then use this model to explore how the shift from the Keynesian compromise to neoliberalism has changed the relationship of cyclical labor share to the underlying determinants of capacity utilization and unemployment.
It will be no surprise that the relationship of labor share to capacity utilization and unemployment has shifted between the two regimes. What may be more surprising is that the functional forms linking labor share to capacity utilization and unemployment have remained largely intact.
Modeling cyclical labor share
The typical decomposition shows labor share as WL/PQ, where W is the nominal wage; L is labor paid for; P is an implicit deflator; Q is a real index of value added. Labor share can be written as:
WL/PQ = (W/P) (Q/L)–1(1)
Within the business cycle, the implicit deflator of a sector’s product, P, is likely to differ from the CPI for urban workers. Correspondingly, the product real wage W/P will diverge from the purchasing power real wage W/CPI.
The inverse of labor share can be written as the mark up of the nominal price P to unit labor cost WL/Q.
PQ/WL = P/(WL/Q)(2)
When the emphasis is on the relationship of the two broad classes of capital and labor the determination of the labor share is often expressed through Equation 1 as the outcome of bilateral negotiation (class struggle) between capital and labor over the product real wage given labor productivity. Where product market mediation is primary, the markup model in Equation 2 comes to the fore and the struggle or bargaining between labor and capital is brought in indirectly. Since it is strictly a matter of algebraic decomposition it does not really matter if the explanation of labor share is framed as the result of bilateral negotiation or the inverse of labor share is explained as the markup over unit labor costs.
I begin with three well-known explanations of labor share or its inverse. The overhead labor-wages lag hypothesis long identified with Sherman (1972, 1997) makes labor share a function of capacity utilization. The depletion of the reserve army theory hypothesis closely identified with Boddy and Crotty (1975) makes labor share a function of unemployment. The markup theories of Goldstein (1986, 1996) make the inverse of labor share a function of unemployment and capacity utilization. Since Goldstein’s views on the impact of unemployment are along the lines of Boddy and Crotty, it is his theory on the impact of capacity utilization that is of concern here. I begin with Boddy and Crotty on the role of unemployment and then turn to the contributions of Goldstein and Sherman on the role of capacity utilization.
Unemployment and the strength of labor
Boddy and Crotty focused on the increase in labor share in the second part of the expansion as the outcome of the rising strength of labor. Declining rates of unemployment increase labor share by increasing product real wages for given levels of labor productivity. According to Boddy and Crotty the depletion of the reserve army can also directly affect labor productivity.
Although Boddy and Crotty (1975) carried out the analysis in the Burns—Mitchell NBER cyclical stages framework and not with econometrics, we argued—presciently for my purposes in the present chapter—that the confidence of labor would depend both on the level of unemployment and on the change of unemployment. Most workers are not directly affected by bouts of unemployment. Their confidence should be high when the rate of unemployment is low but confidence should also be affected positively if the rate of unemployment is decreasing. Based on the above arguments, I assume that the change in labor share depends on both the rate of change of unemployment and its level. It is crucial to understand the implications of the inclusion of the level of unemployment as a determinant of the change in labor share. Suppose that the rate of unemployment is extremely low but unchanging. In the absence of the level of unemployment the prediction would be that labor share would remain constant. With the inclusion of the level of unemployment the prediction becomes that labor share would continue to rise.
Capacity utilization and the strength of capital
Goldstein (1996) argues that the degree of product market competition falls as the level of capacity utilization rises. The robustness of the economy reduces cut-throat competition. If capacity utilization changes the markup of price to marginal cost at all, it makes sense that the markup would increase as capacity utilization increases. With domestic production high relative to capacity, buyers have less demand substitutes. Assuming short-run constant returns to scale the markup ratio is also the ratio of revenue to average variable costs.
Because markups and product price elasticities of demand are framed for gross revenue it will be important to understand their implications for value added. Assume that materials inputs are proportionate to real output and the degree of monopoly is the same for final goods and the intermediate inputs. The markup of value added over labor cost will be the same as price over full unit costs. Hall (1986) shows that in general the value added markup overstates the gross output markup with the overstatement increasing in the ratio of materials cost to total revenue. The goal here is not to ascertain the gross output markup but to ascertain how business conditions affect labor share of value added. Goldstein’s markup theory implies that the inverse of labor share will increase as capacity utilization increases. Labor share as a proportion of value added will fall as capacity utilization increases.
The overhead labor-wages lag hypothesis of Sherman (1997) also links declining labor share to increasing capacity utilization. Causation runs initially from a collapse in aggregate demand to a collapse in capacity utilization to a collapse in labor productivity due to overhead or hoarded labor, and finally to an increase in labor share in the face of a lag in real wages. In the ensuing recovery demand increases, capacity utilization increases, labor productivity increases, real wages remain relatively quiescent and labor share decreases. With overhead labor this decrease in labor share can occur in the presence of a constant markup over variable production labor costs. In the absence of overhead labor, labor share will only decrease if the markup increases as capacity utilization increases. In either case the change in labor share depends negatively on the change in capacity utilization. The markup hypothesis of Goldstein and the overhead labor—wages lag theory of Sherman have exactly the same implications. The change in labor share depends negatively on the change in capacity utilization.
According to Boddy and Crotty the change in labor share is a function of both the change and the level of the rate of unemployment. According to Goldstein and Sherman the change in labor share is a function of the change in capacity utilization. The two conditioning variables—unemployment and capacity utilization—enter in an asymmetric fashion. The model is then
∆st = α1∆ct + β1∆ut–1 + β2(ut–1–U) + vt(3)
where, st is labor share; ct is capacity utilization rate; ut is the rate of unemployment; U is the unemployment threshold and vt is a random error term.
Instead of positing a generalized lag structure, I have chosen to illustrate the empirically determined lag found in this study. The specific lags shown in Equation 3 are not part of the hypothesis.
The threshold U enters as an unknown parameter in Equation 3. Separating and collecting the terms involving the threshold, the regression becomes,
∆st = S + α1∆ct + β1∆ut–1 + β2ut–1 + vt(4)
where the intercept S = –(β2U). The point estimate of the threshold U = –S/β2.
In Equation 3 and therefore Equation 4 labor share is expressed directly in terms of its determinant variables. An alternative approach is to explain product real wage and labor productivity as a function of capacity utilization and unemployment and then combine the two explanations into an explanation of labor share. From Equation 1:
dlog (WL/PQ) = dlog (W/P)–dlog (Q/L)(5)
Boddy and Crotty hypothesized that labor productivity depended on the unemployment rate. Perhaps labor productivity depends only on capacity utilization. From Equation 5, it is clear that in explaining labor share it does not matter if the determining variable works through labor productivity or through the product real wage. The resulting equation comparable to Equation 4 for the same determining variables is:
dlog st = £ + α1dlog ct + β1dlogut–1 + β2ut–1 + vt(6)
I have made estimates of Equation 4 and Equation 6. Because the variables have little or no trend, the goodness of fit for the arithmetic differences of Equation 4 and the log differences of Equation 6 are very similar. Because it is easier to interpret the arithmetic changes, the estimates for the two regimes presented in this chapter are based on Equation 4.
Estimates for Keynesian and neoliberal regimes
The estimates of this chapter are for labor share out of gross value added in the nonfinancial corporate business sector (NFC). Others such as Weisskopf (1979) have worked with the labor share out of NFC net value added. The labor share out of net value added fits better in Weisskopf’s framework for the decomposition of the rate of profit on net capital stocks. I believe that cyclically the labor share out of gross valued added is a better measure of what is “up for grabs” in bilateral bargaining and that profits gross of depreciation allowances are a better measure cyclically of what is important to capital.
I present in Table 12.1 estimates of the labor share for an interval of the Keynesian compromise, for a connecting transition period, and for an interval of the still continuing neoliberal era. Two key elements of the Keynesian compromise were the active use of Keynesian policy and the fixed exchange rates of Bretton Woods. Both of these were unraveling by 1972. For the neoliberal era two key elements have been flexible exchange rates and the adoption of a monetary policy predicated on inflation stability. The monetary policy was not in place until the appointment of Volcker as Chair of the Fed in August 1979. In Table 12.1 each regime and the intervening transition are dated from trough quarter to trough quarter. Of the nine complete cycles starting in 1949:4, cycles I—IV fall in the Keynesian period, cycles V and VI in the transition interval, and cycles VII—IX in the neoliberal period. Bakir and Campbell (2006) suggest a somewhat similar demarcation of the regimes. They date the economic regime change beginning in the early 1970s and “full neoliberalism” commencing with cycle VIII in 1982:4.
The estimates in column (1) for the Keynesian regime show as hypothesized by Goldstein (1996) and Sherman (1997) that changes in capacity utilization negatively affect the change in labor share. As hypothesized by Boddy and Crotty (1975) both the change in unemployment and the level of unemployment here lagged one period negatively affect the change in labor share. Decreases in unemployment and low unemployment both increase labor share. All three variables are significant at the usual levels. Turning to the column (3) estimates for the neoliberal regime we find the same pattern as for the Keynesian compromise. Although the coefficients have fallen roughly by half for both the change in capacity utilization and the level of unemployment they remain significant. The coefficient for change in the rate of unemployment falls precipitously and is non-significant. What really falls between the two regimes is the adjusted R-square. Whether one is a proponent of the reserve army hypothesis or the overhead labor-wages lag (markup) hypothesis or both, the outcome of the policies of the neoliberal regime has been to diminish the combined effects. The functional form has remained intact. As we shall see the functional form with its diminished values has implications for both the length of the business cycle and what brings the cycle to its end in the neoliberal era.
As shown in Equation 3 the impact of the level of lagged unemployment operates through its deviation from threshold unemployment U. When the level of unemployment is below threshold it drives labor share up. For the Keynesian regime the point estimate of the unemployment threshold U is 5.2 percent. For the neoliberal regime it is 6.0 percent. The relative gap between the thresholds for the two regimes is in the expected direction but one should not read very much into the individual threshold magnitudes. The threshold U = –S/β2 is a non-linear function of the regression coefficients of Equation 4. Staiger et al. (1997) note that confidence intervals for such threshold variables require Monte Carlo techniques and the confidence intervals can be quite wide. In the comparison of the two regimes it is the response of the change in labor share to the level of unemployment and the other two variables that is most important and not “confidence” in the individual unemployment threshold values.
The estimates of Table 12.1 are by ordinary least squares (OLS). For unbiased estimates OLS requires that the error terms are not correlated with the independent explanatory variables. There are two reasons that it is not likely to be the case. In the specification of a larger model contemporaneous changes in capacity utilization would be an endogenous variable. Also, the measure of capacity utilization has manufacturing output in its numerator. At the same level of aggregation, output per unit of capacity explains output per worker which in turn partly explains labor share. The explanatory variable is correlated with the disturbance term. Typically one tries to obtain consistent estimates by choosing instrumental variables correlated with the explanatory variables but not correlated with the disturbance term. Although military expenditure is a good instrument for the Keynesian period, I have found no instruments that work over both regimes. As Moore (1977) states, business cycles are “Partly Exogenous, Mostly Endogenous.” Strong instrumental variables for this model may be hard to come by.
How do the estimates of Table 12.1 compare to the estimates of other colleagues? The most directly comparable estimates are those of Hahnel and Sherman (1982) and Sherman and Kolk (1996). Both of these studies assume that the level of labor share depends on the level of capacity utilization and the level of unemployment. Hahnel and Sherman work in first differences to eliminate trends in variables. Sherman and Kolk do not. In first differences their model is a subset of Equation 4 which underlies the estimates of Table 12.1. The estimates of Table 12.1 imply that their model is a misspecification of Equation 4. The misspecification is fundamental. Their model makes little differentiation between what happens in the early part of the expansion and the later part of the expansion. So long as capacity utilization is increasing and unemployment is falling it makes no difference in their model if we are in the early part of the recovery or the last part of the expansion. The model behind Table 12.1 implies a fundamental change in the relationship between labor share, capacity and unemployment between the early expansion and the late expansion. As evidenced by the estimates for the Keynesian regime, high and stable levels of capacity utilization and low unemployment not only meant a high labor share it meant an increasing labor share. In the neoliberal regime that implication is certainly less strong, but it remains.
Having included them, I will make a brief comment on the estimates of column (2) of Table 12.1 for the transition period. On the surface they too make a case for the importance of capacity utilization and unemployment—measured by R-square seemingly the best case of all. I think that case is spurious. Lucas (1976) is generally correct that coefficients which record the responses of economic agents are influenced by the policies faced by those agents. This should especially be, and has been the case as shown in Table 12.1, when the policy changes are so large as to constitute regime change. When the policies are generally coherent as they were in the Keynesian regime and are now once again in the neoliberal regime there can be a coherent interpretation of the coefficients. My sense is that was not the case for the transition period. The transitional decade was a period of inconsistent and incoherent policies. That is why it is correctly treated as a transition period.
Labor productivity and real wages in the neoliberal era
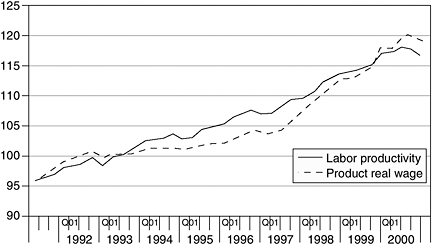
The Bureau of Labor Statistics (BLS) publishes a quarterly series on labor productivity (1992 = 100) for NFC that is consistent with the NFC series on labor share out of gross value added that has been used in this chapter. Knowing labor share and labor productivity it is straightforward through Equation 1 to derive a quarterly series of the implied product real wage for NFC (1992 = 100). I show, in Figures 12.1 and 12.2, the relative movements of the product real wage and labor productivity for the two major neoliberal expansions. For each expansion, the beginning value of labor productivity is “normed” to be equal to the beginning value of the product real wage. (The actual gaps between the two indexes at the beginning of each expansion are quite small.) The scale on the vertical axis is the index of the product real wage (1992 = 100).
In addition to tracing out the movements of labor productivity and product real wage one can also read the movements of labor share in Figures 12.1 and 12.2. To compare the labor share at a particular quarter to the beginning labor share one takes the ratio of the product real wage to labor productivity. When the product real wage is below labor productivity the corresponding labor share is below the labor share at the beginning of the expansion. When the normed indexes of labor productivity and product real wage converge, the labor share is again equal to the labor share at the beginning of that expansion. Within each expansion the spatial gap between the two lines is a good representation of the movements in labor share. Since the vertical axis in Figure 12.2 is compressed almost twice as much as in Figure 12.1, it is not the case that a larger spatial gap in Figure 12.1 compared to the spatial gap in Figure 12.2 translates to a larger change in labor share. The maximum change in labor share in the 1990s is roughly twice the maximum change in the 1980s.
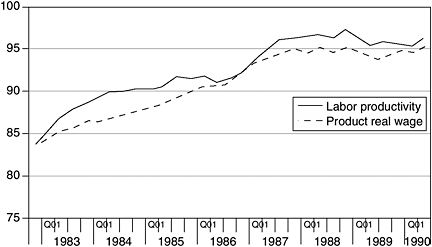
For the expansion beginning 1982:4 labor productivity flattens out by 1986 and then grows until two years before the end of the expansion. For the expansion as a whole the average annual exponential rate of growth of labor productivity is 1.7 percent. From its cyclical nadir in 1984:2 labor share increased from 65 percent to 67 percent in 1986:2. From 1986:2 to the end of the expansion it falls to 66 percent. Starting at an unemployment rate of 10.7 percent at the beginning of the expansion, the rate of unemployment does not go below 6 percent until the third quarter of 1987. The rate of capacity utilization does not go above 80 until the first quarter of 1987. This cycle ended more from Greenspan’s concern about the impact of the large increase in debt related to the savings and loan debacle on the stability of the monetary system than it did from any push by labor.
For the expansion of the 1990s, labor productivity increased to the second quarter before the end of the expansion. For the expansion as a whole labor productivity increased at 2.2 percent per year. Labor share fell until 1997:2 only to recover to its initial share value before the end of the expansion. From its low of 64 percent, labor share increased to 68 percent. This turnaround in labor share implies a 9 percent decline in profit share. Unlike in the expansion of the 1980s where unemployment never fell below 5 percent for more than one quarter, unemployment was below 5 percent from the second quarter of 1997 and averaged below 4 percent for the last year of the expansion, 2000. Unemployment had not been below 4 percent in the past 30 years. Capacity utilization, however, was held in check in the period after 1997 by imports of finished goods. The NFC firms had no pricing power. From 1997 to 2000 the NFC gross value added deflator increased less than three-quarters of 1 percent per year. The idea that flexible exchange rates make it possible for firms to pass on unit labor cost and thereby maintain share is clearly not supported by the movement in labor share from 1997–2000.
What happened? There appears to be several things that interacted to mislead the neoliberal policy-makers—particularly the Fed. From 1997:1 to 2000:1 the average annual increase in the implicit GDP deflator was less than 1.5 percent. In the absence of significant inflation, there was an understandable pressure from a Democratic president to increase output and decrease unemployment. Even though it was known that money wages were rising, price movements which were held down by imports did not appear to justify a contractionary monetary response. Greenspan also appeared to hesitate to sop up asset bubble inflation. The low unemployment and the increasing labor share materially reduced profits and did much more to contribute to the break of the bubble than any belated actions of Greenspan. One difference from the expansions of the Keynesian period, and it is an important one, is that the expansion meandered along at a snail’s pace in terms of real GDP growth for a much longer time before the neoliberal policy-makers mistakenly laid the foundation for the large increase in labor share and the drop in the profit rate. It’s a mistake that they appear in no hurry to repeat.
What happened to the real wage, particularly for the crucial period 1997–2000 when labor share strongly squeezed the profit share? The real wage and the product real wage are linked by the identity
W/CPI = (P/CPI) (W/P)(7)
where the CPI is for urban workers.
On a year over year basis from 1997–2000 the product real wage for the NFC increased 4.3 percent per year. The NFC value added deflator increased only 0.5 percent per year. The CPI increased 2.2 percent per year. The implied real wage for the NFC therefore increased 2.6 percent per year. A comparable calculation for the nonfarm business sector shows a real wage increase of 3.0 percent per year over the same period. Over the average cycle we can expect labor productivity and the real wage in the business sector as a whole to grow at approximately the same rate. For a narrower sector such as the NFC, the labor productivity of the sector affects the real wage only insofar as it affects the product real wage in Equation 7. And that takes us back to the key role of labor share.
Conclusion
A properly specified model linking labor share to capacity utilization and unemployment helps to explain the complex movements of labor share over the cycle—especially the shift from early expansion to late expansion. When applied to the Keynesian and neoliberal regimes, it shows that labor share was much more responsive to capacity utilization and unemployment in the Keynesian period than it has been in the neoliberal period. Still the functional form has remained intact. Based on that functional form and the movements of labor productivity and product real wage we can conclude that unemployment in the 1980s never got sufficiently low to play anything more than a minor role in the end of that long expansion. During the expansion of the 1990s the decrease in unemployment, and its low level, contributed integrally to the decline in the rate of profit and the end of that expansion.
Note
1 I am grateful for discussions with my colleague Tia Hilmer on cointegrated processes. My colleague Bill Carter has shared his insights as to what was happening in the second halves of the two long neoliberal expansions of the 1980s and 1990s.
References
Bakir, E. and Campbell, A. (2006) “The Effect of Neoliberalism on the Fall in the Rate of Profit in Business Cycles,” Review of Radical Political Economics, 38(3): 365–73.
Boddy, R. and Crotty, J. (1975) “Class Conflict and Macro-Policy: The Political Business Cycle,” Review of Radical Political Economics, 7(Spring): 1–19.
Goldstein, J. P. (1986) “Mark-up Pricing over the Business Cycle: The Microfoundations of the Variable Mark-up,” Southern Economics Journal, 53(1): 233–46.
——(1996) “The Empirical Relevance of the Cyclical Profit Squeeze: A Reassertion,” Review of Radical Political Economics, 28(4): 55–92.
Hahnel, R. and Sherman, H. J. (1982) “Income Distribution and the Business Cycle: Three Competing Hypotheses,” Journal of Economic Issues, XVI(1): 49–73.
Hall, R. (1986) “Market Structure and Macroeconomic Fluctuations,” Brookings Papers on Economic Activity, 2: 285–322.
Lucas, R. E. Jr. (1976) “Econometric Policy Evaluation: A Critique,” Carnegie Rochester Conference Series on Public Policy, Amsterdam: North-Holland: 19–46.
Moore, G. H. (1977) “Business Cycles: Partly Exogenous, Mostly Endogenous,” Social Science Quarterly, 58(1): 96–103.
Sherman, H. (1972) Radical Political Economy. New York: Basic Books.
——(1997) “Theories of Cyclical Profit Squeeze,” Review of Radical Political Economics, 29(1): 139–46.
Sherman, H. and Kolk, D. X. (1996) Business Cycles and Forecasting. Boston: Addison Wesley.
Staiger, D., Stock, J. H. and Watson, M. W. (1997) “The NAIRU, Unemployment and Monetary Policy,” Journal of Economic Perspectives, 11(1): 33–49.
Weisskopf, T. E. (1979) “Marxian Crisis Theory and the Rate of Profit in the Postwar U.S. Economy,” Cambridge Journal of Economics, 3(4): 341–78.