13 Economic crises and institutional structures
A comparison of regulated and neoliberal capitalism in the USA
David M. Kotz
Introduction1
Several analysts have suggested that the dominant cause of capitalist economic crises depends on the institutional structure of capitalism at a particular time and place (Wright, 1979; Wolfson, 2003; Kotz, 2008). Some have suggested that the highly regulated form of capitalism in the post-World War II decades was particularly vulnerable to the reserve army (or profit squeeze) crisis tendency, while in today’s neoliberal form of capitalism over-production relative to demand is the main cause of periodic economic crises (Wolfson, 2003; Kotz, 2008).
In the reserve army crisis tendency, economic expansion drives the unemployment rate to a low level, increasing workers’ bargaining power so that the real wage rises faster than labor productivity, resulting in a decline in the profit share and the rate of profit, setting off an economic crisis (Marx, 1967: Chapter 25; Sweezy, 1942: Chapter 9). This crisis tendency may be associated with regulated capitalism because its institutions tend to promote workers’ bargaining power.2 By contrast, under neoliberal capitalism workers have little bargaining power, making that crisis scenario unlikely. Instead, various features of neoliberal capitalism should produce expansions in which production outruns demand (Crotty, 2000; Wolfson, 2003; Kotz, 2008).
The literature cited above makes a strong theoretical case for such a connection between crisis tendencies and institutional structures. However, those claims have not been subjected to a comparative empirical analysis for the regulated and neoliberal institutional forms of capitalism. This chapter offers such an empirical analysis. The second section develops a methodology for identifying which crisis tendency or tendencies are responsible for an economic crisis (or recession). The third section applies that methodology to data for the US economy in the eras of regulated and neoliberal capitalism. The final section offers concluding comments.
Empirical identification of crisis tendencies
The reserve army crisis tendency, and its expected connection to regulated capitalism, is relatively straightforward. However, both the problem of over- production, and its connection to neoliberal capitalism, are more complex. We can identify three possible sources of over-production in a neoliberal institutional structure.
The first is known as underconsumption, a crisis tendency associated with capital having the upper hand in wage bargaining. Because of the limited bargaining power of labor in neoliberal capitalism, real wages tend to increase very slowly or even decline during economic expansions. If the real wage stagnates or declines while labor productivity increases during an expansion, the share of profit in total income should rise, creating a potential realization problem. Unless accumulation or some type of unproductive spending (such as state spending or capitalist consumption) rises rapidly to absorb the rapidly rising profit-component of the value of output, production will outrun demand, leading to a crisis.3
A second type of over-production crisis tendency, called over-investment, can be associated with a neoliberal institutional structure, stemming from the nature of competition. In contrast to the co-respective behavior toward one another by large corporations in the regulated capitalist era, in the neoliberal era capital—capital relations are characterized by unrestrained competition including frequent price-cutting. Some analysts have argued that the unrestrained competition of neoliberal capitalism leads to excessive investment, as rival firms battle for survival by trying to raise their market share. This in turn leads to excessive creation of productive capacity, resulting in underuse of capacity.4 Growing idle capacity eventually causes a downturn in investment, which sets off the crisis.
A third type of over-production crisis tendency in neoliberal capitalism stems from asset bubbles. Economic expansions in neoliberal capitalism tend to produce asset bubbles.5 This happens because rapidly rising profits, and rapidly rising personal income of wealthy households, create a pool of funds seeking investment that exceeds the available profitable productive investment opportunities. As a result, the excess investable funds find their way into the purchase of assets, which tends to raise asset prices, eventually setting off a speculative rise in asset prices—that is, an asset bubble. As paper wealth increases, both consumption and investment are stimulated, tending to rise at a rate out of line with increases in ordinary income. Investment may be so overstimulated that productive capacity rises faster than demand, as the euphoria and elevated expectations induced by the bubble affect corporate decision-makers who form an exaggerated estimate of future returns to investment. Once the bubble bursts, and consumption and investment return to levels in line with ordinary income, a large overhang of excess productive capacity is revealed, which may depress the incentive to invest for a lengthy period.
How can the above four crisis tendencies be empirically identified? Weisskopf (1979) developed a methodology in which the average rate of profit is expressed as the product of several factors, each of which is interpreted as reflecting a particular crisis tendency. He used this approach to determine which of several possible crisis tendencies, including the reserve army effect and underconsumption, was the operative one in the US economy from 1949–75. This chapter follows an approach similar to that of Weisskopf (1979), although with some differences.6
Most Marxist analysts have considered the rate of profit to be the key factor in economic crises.7 In the typical economic expansion, the rate of profit reaches a peak and then declines prior to the crisis, as will be shown in the following section. This pattern is consistent with the view that a declining profit rate eventually sets off the crisis. The central role of the profit rate is due to its impact on capital accumulation, which is believed to be sensitive to changes in the rate of profit. In the US national income and product accounts, investment is the closest approximation to the Marxist concept of capital accumulation. In the nine recessions since 1949 in the USA, real gross private domestic investment declined in the first year of each one, by an average of 7.6 percent (US Bureau of Economic Analysis, 2006).
Since we are interested in the rate of profit as a determinant of business investment, we use the following narrow definition of the rate of profit:

where r = rate of profit; R = after-tax profit (after payment of interest); NW = net worth (at market value). The rate of profit is for the nonfinancial corporate business sector of the US economy.8
The rate of profit as defined above can be expressed as the product of four variables:
 (1)
(1)where Y is net output or income; TA is tangible assets (at market value); A is total assets (at market value).
The first ratio in Equation 1, R/Y, is the profit share of income. The second, Y/TA, is the ratio of output to tangible assets, whose variation over short periods of time indicates mainly changes in the degree of utilization of the stock of means of production.9 The third and fourth ratios in Equation 1, TA/A and A/NW, can be shown to reflect the share of financial assets in total assets and the degree of leverage respectively. Since these two variables were not found to play a significant role in our analysis of movements of the rate of profit during the period under study, they have been omitted from the analysis in this chapter.10
This kind of analysis of the determinants of the rate of profit is based on an identity, which cannot explain causation. However, it can be used for a kind of accounting procedure. The sum of the percentage changes in the four right-hand variables must add up approximately to the percentage decline in r.11 Suppose the rate of profit declines by 10 percent over a period. If R/Y declined by 5 percent over that period, one can say that the decline in R/Y directly accounted for half of the decline in r.
The first ratio above, R/Y, can be further analyzed as follows:
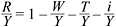 (2)
(2)where W = employee compensation (including employer-paid benefits); T = taxes on profits plus indirect taxes; i = interest paid. Like Equation 1, Equation 2 is an identity, since total output is divided up on the income side among profits, wages, taxes and interest.12
The relation expressed in Equation 2 is an additive identity rather than a multiplicative identity. For an additive identity, the sum of the absolute changes in the right-side variables over a period exactly equals the absolute change in the left-side variable. Hence, the most useful way to analyze the change in the profit share is using the concept of “contribution,” where the contribution to the change in the profit share of each variable on the right side of Equation 2 is the absolute change in that variable over the period divided by the absolute change in the profit share, expressed as a percentage. The sum of the contributions of the rightside variables is exactly 100 percent, apart from rounding errors, since there are no interaction terms for additive equations.
Since Equation 2 is an identity, strictly speaking the contribution of each right-side variable to the change in the profit share represents a kind of accounting rather than necessarily a cause. If the change in the wage share contributes 80 percent of the change in the profit share over a period, that means that, had the wage share remained unchanged over that period while the other right-side variables had changed as they actually did, then the change in the profit share would have been smaller by 80 percent over that period.
The wage share can be expressed as a function of three underlying variables: the real wage, output per worker and the ratio of the consumer price index to the output price deflator:
 (3)
(3)where wR = real wage per worker (nominal employee compensation per worker deflated by the CPI); CPI = consumer price index; Py = price index for the output of the nonfinancial corporate business sector; YR = real output of the non-financial corporate business sector (deflated by Py); N = number of full-time equivalent workers.
Equation 3, which is also an identity, shows that the relation between the real wage and output per worker does not uniquely account for the change in the wage share. The wage share can rise even if the real wage rises no faster than output per worker, if the ratio CPI/Py is rising. The ratio CPI/Py enters Equation 3 to reflect the assumption that workers are concerned with their real wage (their money wage deflated by the CPI), not their product wage (their money wage deflated by Py), since they do not consume a representative basket of goods drawn from the output of the nonfinancial business sector. The goods covered by the two price indexes, CPI and Py, differ in a number of ways including that consumers purchase imported consumer goods, which are not in the basket for computing the output price index, and they do not purchase capital goods, which are in the basket for computing the output price index.13
How can the four crisis tendencies cited above be identified in the movement of the determinants of the profit rate? Consider the relation between capital and labor as they struggle over wages and profits. We assume that labor is concerned, first of all, with its real wage. The real wage depends on the movement of the money wage relative to the consumer price index. A rising real wage is made possible by rising real output per worker (or, as it is often called, labor productivity). Some trade unions cite the rate of increase in labor productivity in setting a target for real wage growth, arguing that labor’s real reward should rise as fast as real output per worker. The extent of workers’ bargaining power might be indicated by the relation between real wage growth and labor productivity growth. If the real wage rises faster than productivity growth, labor is getting the upper hand over capital, while if the real wage rises more slowly than productivity growth, capital has the upper hand.
However, capital is concerned with the wage share, which directly affects the rate of profit. As Equation 3 shows, the wage share depends on a three-way relation between the real wage, real output per worker, and the ratio of the consumer price index to the output price index. The wage share is determined both by capital’s relation with labor, indicated by the relation between the real wage and real output per worker, and by capital’s pricing power, which affects the denominator of the price index ratio. Capital’s pricing power is affected by the adequacy of total demand in relation to output.
In light of the above considerations, we will identify the four crisis tendencies in relation to the movement of the determinants of the profit rate as follows:
- Reserve Army Effect: we will regard this crisis tendency as indicated by a decline in the profit rate prior to a recession that stems from a rise in the wage share which, in turn, results from the real wage rising faster than output per worker.
- Underconsumption: we will consider the underconsumption crisis tendency to be indicated by the joint occurrence of a declining Y/TA and a rising profit share prior to a recession. The concept of underconsumption is based on a rising profit share as the cause of the realization problem, so a rising profit share must be part of the evidence for underconsumption. The evidence that the rising profit share is causing a crisis due to underconsumption would be confirmed by a declining Y/TA. The crisis would be set off by the declining Y/TA outweighing the rising R/Y in Equation 1, causing r to fall.
- Over-Investment: we will consider the over-investment crisis tendency to be indicated by the following two movements in the profit rate determinants resulting in a decline in the rate of profit prior to a recession:
- a declining Y/TA;
- b declining R/Y due to a rising ratio CPI/Py while the real wage is rising no faster than output per worker.
- The former indicates reducing real output relative to capacity in response to a demand shortfall, while the latter indicates the effect of the demand shortfall being exhibited by an inability by capital to raise output prices fast enough to prevent the profit share from falling despite the lack of power by labor to increase the real wage faster than productivity growth. That is, we are assuming that the shortfall of demand relative to output resulting from over-investment would cause both a quantity effect and a price effect.
- Asset Bubble Effects: an asset bubble has two effects, described above, that are relevant here. First, the speculative bubble tends to cause exaggerated expectations of future profitability, which lead to excessive investment. This would produce the same movement of the determinants of the profit rate as are caused by the over-investment crisis tendency. Second, the prolonged elevated levels of both consumption and investment set off by an asset bubble are likely to cause, once the bubble bursts, a long-lasting decline in investment. Hence, the indication that this crisis tendency is the operative one is a combination of:
- the presence of an asset bubble during the expansion;
- the same profit rate determinant movements prior to the recession described under the over-investment crisis tendency above; and
- a prolonged decline in investment following the collapse of the bubble.
Table 13.1 summarizes the empirical identification of each of our four crisis tendencies, as described above.
Evidence about crisis tendencies during the two periods
We regard the regulated capitalist institutional structure in the USA as having been established by 1948 and lasting until 1973 (Kotz, 2003). After a period of transition involving intense class conflict and macroeconomic instability, the
neoliberal institutional structure was established by around the end of 1982 and continues through the present.
Figure 13.1 shows the movements of the profit rate in the USA during 1949–2005 in relation to the expansions and recessions of that period.14 There were nine complete expansions during this period: 1949–1953, 1954–1957, 1958–1960, 1961–1969, 1970–1973, 1975–1979, 1980–1981, 1982–1990 and 1991–2000.15 We will analyze the late-expansion profit rate declines for the five expansions during the regulated capitalist era (through 1973) and the two late expansions of the neoliberal era (1982–1990 and 1991–2000).
Figure 13.1 shows that, with two exceptions (1949–1953 and 1980–1981), the rate of profit rose in the early part of each expansion and fell in the later part of the expansion. In the 1949–1953 expansion the rate of profit fell continuously from the start of the expansion, due to effects of Korean War taxes (see below, p. 183). In the one-year-long expansion of 1980–1981, the profit rate rose up to the peak of the expansion, only falling after the peak. That brief expansion, which took place amidst the instability of the transition period, was cut short by the Fed’s shift to a very tight monetary policy.
Table 13.2 shows the movement of the first two determinants of the profit rate, based on equation (1), during the late-expansion profit rate declines for each of our seven cases. Column 1 shows the percentage change in the profit rate in each period. The late-expansion decline in the profit rate ranged from 9.99 percent in 1972–1973 to 46.49 percent in 1997–2000.
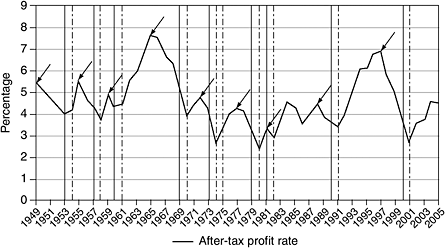
Figure 13.1 The after-tax rate of profit of the nonfinancial corporate business sector in relation to business cycle expansions and contractions, 1949–2005 (source: US Bureau of Economic Analysis, 2006, Table 1.14; US Federal Reserve System, 2006, Flow of Funds, Z.1 Statistical Release).
Key
Solid vertical line indicates last year of business expansion. Dotted vertical line indicates recession year. Arrow indicates peak of profit rate prior to its decline in late expansion.
Column 2 shows the percentage change in the profit share in each period. Note that a decline in the profit share directly accounts for all or most of the decline in the profit rate in every period. Column 3 shows the percentage change in the ratio of output to tangible assets, which is our measure of changes in capacity utilization. This variable contributed significantly to the decline in the rate of profit in three late expansions: 1955–1957 when it directly accounted for 37.9 percent of the profit rate decline; 1988–1990 when it directly accounted for 9.8 percent of the profit rate decline, and 1997–2000 when it directly accounted for 9.2 percent of the profit rate decline.
Table 13.3 shows the contributions to the decline in the profit share during the seven late expansions from changes in the shares of wages, taxes and interest payments, based on equation (2). A rise in the wage share contributed all, or most, of the profit share decline in every period. However, there are three expansions in which one or both of the other two variables made a significant contribution to the profit share decline. In 1949–1953 a rising tax share contributed almost half of the decline in the profit share, as special Korean War taxes cut into after-tax profits. In 1972–1973 rising taxes and rising interest payments together contributed almost one-third of the profit share decline. And in 1988–1990 the contribution of rising interest payments to the decline in the profit share was almost as great as that of the rising wage share.
Table 13.4 shows the changes in the real wage, output per worker and the price ratio CPI/Py for each of the periods, based on Equation 3. Table 13.4 shows that the real wage rose faster than output per worker in every late expansion of the regulated capitalist era. During that period the ratio CPI/Py rose in four out of five late expansions but at less than 1 percent per year in each case. For the two late expansions of the neoliberal era, output per worker rose faster (or fell more slowly) than the real wage. The rising wage share in 1988–1990 and 1997–2000 was entirely due to an approximately 2 percent per year increase in CPI/Py in each case.16
Table 13.5 summarizes our findings. The five late expansions during the regulated capitalist period all fit the characteristics of the reserve army crisis tendency, with one minor qualification: the 1970–1973 expansion was followed by a long depression in investment.17 In all five late expansions the real wage rose faster than labor productivity, leading to a rising wage share, a falling profit share and a falling rate of profit. Thus, our expectation regarding which crisis tendency would be acting in the regulated capitalist era has been substantially confirmed by the data.
In the two late expansions of the neoliberal era, labor productivity rose faster than the real wage. Hence, neither of these expansions fits the requirements for the reserve army crisis tendency. Also, in neither of these expansions are the data consistent with the underconsumption crisis tendency. In neither case did declining capacity use outweigh a rising profit share, resulting in a declining profit rate.
Both of the late expansions of the neoliberal era show the characteristics associated with the over-investment crisis tendency. That is, the rate of profit and the profit share declined, capacity use declined, the wage share rose and labor productivity rose faster than the real wage (with the rise in the ratio CPI/Py accounting for all of the increase in the wage share).
In addition, the expansion of 1991–2000 shows the features of the asset bubble effects crisis tendency. There was a huge asset bubble in the stock market during 1995–2000, which burst in the late summer of 2000. There followed a large and long-lasting depression in nonresidential fixed investment following the business cycle peak. It is also noteworthy that our measure of capacity use, Y/TA, declined every year during the three-year long period of profit rate decline.18
Concluding comments
We found that all five economic expansions during the regulated capitalist era in the USA showed evidence of the reserve army crisis tendency. The two expansions of the neoliberal era both showed evidence of the over-investment crisis tendency, while the second expansion of that era also showed evidence of the asset bubble effects crisis tendency.19
Thus, this study suggests that the operative crisis tendency, or tendencies, are affected by the institutional structure of capitalism in a given period. When the institutional structure undergoes a major change, as has happened periodically in capitalist history, the dominant crisis tendency also changes.
A caution about the methodology of this study is in order. The crisis tendencies under consideration in this chapter all derive from an analysis of capitalism at a relatively high level of abstraction. Some important features of an actual capitalist system are omitted from the theoretical analysis, including specific interventions by the state in the economy. However, the empirical data used in the chapter are undoubtedly affected by state interventions as well as by underlying crisis tendencies. Thus, the inferences from the data presented in this chapter must be treated cautiously, with awareness that it is possible that factors left out of the analysis might have affected the data and the inferences from the data.
Notes
1 Research assistance was provided by Hwok-Aun Lee.
2 Boddy and Crotty (1975) present a case that this crisis mechanism played an important role in the US economy, with data from the era of regulated capitalism. Weisskopf (1979) found this crisis mechanism to be the main one operating in that period.
3 Sweezy (1942: Chapter 10) and Wright (1979) present models of the underconsumption crisis tendency.
4 See Crotty (2000). Brenner (1999) presents a theory of competition-driven over investment as a general crisis tendency of capitalism rather than one specific to its neoliberal form.
5 The 1980s expansion produced a bubble in commercial buildings in some sections of the USA, the 1990s expansion gave rise to the great stock market bubble of 1995–2000, and the expansion since 2001 produced a massive housing bubble (Kotz, 2008). The 1920s, which was the last period prior to the New Deal in which the USA had a liberal institutional structure, also saw huge bubbles in both real estate and securities.
6 Bakir and Campbell (2006) extended Weisskopf’s (1979) methodology to 2001. Their results have some similarities to the findings in this chapter, although differences in definitions and data sources from those used in this chapter led to some differences in results.
7 Some advocates of the underconsumption crisis tendency do not emphasize the role of a decline in the profit rate in setting off a crisis. An example is Sweezy (1942).
8 Weisskopf (1979) also used data on the nonfinancial corporate business sector. The reasons for using data on the nonfinancial corporate business sector, along with other technical details, are given in an appendix available from the author, at dmkotz@ econs.umass.edu.
9 The ratio Y/TA is also affected by changes in the organic composition of capital, since Y/TA is equal to Y/W times W/TA where W is aggregate wages. W/TA is a measure of the reciprocal of the organic composition of capital although using US national income account data rather than labor value data. However, the organic composition of capital is unlikely to vary much during the short periods of time that we will be analyzing.
10 A longer version of this chapter, which includes the variables TA/A and A/NW, is available from the author on request at dmkotz@econs.umass.edu.
11 In general the sum will not be exactly equal to the percentage change in r because changes in the interaction terms among the right-hand variables also contribute to the change in r.
12 The variable W includes compensation of all employees, not just production workers. One component of nonfinancial corporate sector income is omitted here, namely business transfer payments. These are very small relative to total output (around 1 percent).
13 There are also technical differences between the two price indexes.
14 The variables in Figure 13.1 and in all the tables are based on annual data. This figure starts with 1949 since our interest is in the profit dynamics during the economic expansions of the two eras, and the first expansion of the regulated capitalist era started following the 1949 recession.
15 Business Cycle turning points are from the National Bureau of Economic Research (2006).
16 Bakir and Campbell (2006) found a similar, although not identical, pattern to that found in Table 13.4.
17 The macroeconomic instability after 1973, following the demise of regulated capitalism, is the likely explanation for the long depression in investment after 1973.
18 During the transition period, the 1977–1979 late expansion fit the characteristics of the over-investment crisis tendency, while none of the four crisis tendencies was found in the 1980–1981 expansion (which appeared to end as a result of very tight monetary policy).
19 It is too soon to evaluate the expansion that began in 2002, which is continuing at this time. However, it has been strongly influenced by an asset bubble in housing (Kotz, 2008).
References
Bakir, E. and Campbell, A. (2006) “The Effect of Neoliberalism on the Fall in the Rate of Profit in Business Cycles,” Review of Radical Political Economics, 38(3) Summer: 365–73.
Boddy, R. and Crotty, J. R. (1975) “Class Conflict and Macro-Policy: The Political Business Cycle,” Review of Radical Political Economics, 7(1): 1–19.
Brenner, R. (1999). Turbulence in the World Economy. London: Verso Press.
Crotty, James. R. (2000) “Structural Contradictions of the Global Neoliberal Regime,” Review of Radical Political Economics, 32(3) summer: 361–8.
Kotz, D. M. (2003) “Neoliberalism and the Social Structure of Accumulation Theory of Long-Run Capital Accumulation,” Review of Radical Political Economics, 35(3) Summer: 263–70.
——(2008) “Contradictions of Economic Growth in the Neoliberal Era: Accumulation and Crisis in the Contemporary U.S. Economy,” Review of Radical Political Economics, 40(2) Spring: 174–88
Marx, K. (1967) Capital, volume I. New York: International Publishers.
National Bureau of Economic Research (2006) U.S. Business Cycle Expansions and Contractions. Available at www.nber.org/cycles.html (last accessed December 2, 2006).
Sweezy, P. M. (1942) Theory of Capitalist Development. New York: Monthly Review Press.
U.S. Bureau of Economic Analysis (2006) National Income and Product Accounts. Available at www.bea.gov/bea/dn/nipaweb/index.asp (last accessed November 16, 2006).
U.S. Bureau of Labor Statistics (2006) Consumer Price Index. Available at www.bls.gov/cpi/home.htm (last accessed November 29, 2006).
U.S. Federal Reserve System (2006) Available at www.federalreserve.gov/datadownload/ (last accessed November 20, 2006).
Weisskopf, T. E. (1979) “Marxian Crisis Theory and the Rate of Profit in the Postwar U.S. Economy,” Cambridge Journal of Economics, 3(4) December: 341–78.
Wolfson, M. (2003) “Neoliberalism and the Social Structure of Accumulation,” Review of Radical Political Economics, 35(3) Summer: 255–62.
Wright, E. O. (1979) “Historical Transformations of Capitalist Crisis Tendencies,” in Class, Crisis and the State. London: New Left Books.