Sorting and Filtering
The DataView object also gives you the opportunity
to apply sorting and filtering logic that customizes how data will
appear without modifying the underlying data itself.
Sorting with the DataView
To apply a sort
to bound data, you simply set the DataView.Sort
property with a string with the corresponding sort information.
ADO.NET sorting uses the same syntax as the ORDER BY clause in a SQL
query. For example, you might use the following SQL statement to
order results by country:
SELECT * FROM Customers ORDER BY Country ASC
The equivalent ADO.NET code is shown here:
ds.Tables["Customers"].DefaultView.Sort = "Country ASC";

dataGrid1.DataSource = ds.Tables["Customers"];
The sort is according to the sort order of the data type of the
column. For example, string columns are sorted alphanumerically
without regard to case (assuming the
DataTable.CaseSensitive property is
false). Numeric columns are ordered using a
numeric sort. Columns that contain binary data can’t
be sorted. Add ASC after a column name for an ascending sort (with
smallest values first) or DESC for a descending sort.
Keep in mind that if you want to bind a control to the full
DataSet, setting the
DataView.Sort property will have no effect because
the default DataView isn’t used.
Instead, you must modify the DataViewSetting.Sort
property exposed through the DataViewManager:
ds.DefaultViewManager.DataViewSettings["Customers"].Sort = "Country ASC";

dataGrid1.DataSource = ds;
Tip
DataGrid binding is dynamic and updateable. If you
change a value that affects the sort order, the affected row is
automatically repositioned. Similarly, if you programmatically modify
a DataView while it is in use (or the underlying
data), the linked controls update themselves immediately.
You can also use nested sorts. To sort using multiple columns, just add a comma between each sort specification. For example, the following code sorts first by country and then orders all rows that have the same country by city:
ds.Tables["Customers"].DefaultView.Sort = "Country ASC, City ASC";

dataGrid1.DataSource = ds.Tables["Customers"];
Alternatively, instead of setting the
DataView.Sort property, you can set the
DataView.ApplyDefaultSort property to
true. In this case, ADO.NET automatically creates
a sort order in ascending order based on the primary key column of
the DataTable. ApplyDefaultSort
applies only when the Sort property is a
null reference or an empty string, and when the
table has a defined primary key.
Filtering by Column
To filter a DataView,
you set a filter expression in the
DataView.RowFilter property. Filtering by
column works similarly to the SQL
WHERE
clause: it allows you to select rows that match the filter criteria.
For example, consider the following SQL query, which filters rows
based on two column values:
SELECT * FROM Customers WHERE Country='Argentina' AND City='Buenos Aires'
This translates into the ADO.NET code shown here:
ds.Tables["Customers"].DefaultView.RowFilter =

    "Country='Argentina' AND City='Buenos Aires'";

dataGrid1.DataSource = ds.Tables["Customers"];
If you use this code with the Northwind table, you receive three
rows. The other rows are still present in the underlying
DataTable, but they are hidden from view.
Filter operators
Like the
WHERE clause, the
RowFilter
property allows a wide range of
operators and functions for both numeric and string data types.
Consider some of the following examples:
// Find all the rows that match one of the three specified countries.

ds.Tables["Customers"].DefaultView.RowFilter =

    "Country IN ('Argentina', 'Canada', 'Japan')";


// Find all the rows where a Country isn't specified.

ds.Tables["Customers"].DefaultView.RowFilter = "Country IS NULL";


// Use alphabetic comparison to find all the rows where the Country

// starts with S or any letter after it in the alphabet

// (including Switzerland, USA, UK, Venezuela, and so on).

ds.Tables["Customers"].DefaultView.RowFilter = "Country > 'S'";
Tip
After you apply a sort, you can read the
DataView.Count property to determine how many rows
meet the criteria and will be displayed in data bound controls.
With numeric values, you can use ranges or mathematical
operators to filter rows. For example, here are some filters for the
Products table:
// Find all the rows where UnitPrice is greater than 10.

ds.Tables["Products"].DefaultView.RowFilter = "UnitPrice > 10";


// Find all the rows where UnitPrice is above 10 but below 15.

// This is an exclusive range.

ds.Tables["Products"].DefaultView.RowFilter =

    "UnitPrice > 10 AND UnitPrice < 15";


// Find all the rows where UnitPrice is anywhere from 10 to 15.

// This is an inclusive range.

ds.Tables["Products"].DefaultView.RowFilter =

    "UnitPrice BETWEEN 10 AND 15";


// Find all prodcuts where the total stock value is at least $1000.

ds.Tables["Products"].DefaultView.RowFilter =

    "UnitPrice * UnitsInStock > 1000";
Table 12-1 lists the most common filter operators.
Pattern-matching filters
The LIKE keyword performs pattern matching on strings. Pattern matching is akin to regular-expression syntax but is much less powerful. Unfortunately, the pattern matching provided by ADO.NET, while similar to that provided in SQL Server, lacks a few features. Notably, the _ character (which represents a single variable character) and the [ ] brackets (which specify a character from a range of allowed values) aren’t supported. However, you can use the % character to specify zero or more characters.
Here are two examples of pattern matching with ADO.NET:
// Use pattern matching to find all the countries that start with

// the letter "A" (includes Argentina, Austria, and so on.)

ds.Tables["Customers"].DefaultView.RowFilter = "Country LIKE 'A%';


// Matches contacts that contain the word "Manager"

// (includes Sales Manager, Marketing Manager, and so on).

ds.Tables["Customers"].DefaultView.RowFilter =

    "ContactTitle LIKE '%Manager%'";
Filter-supported functions
Finally, you can also use a few built-in SQL functions to further refine a column sort. These features (detailed in Table 12-2) allow you to perform comparisons that include null values, parse a portion of a string, or even perform an aggregate query on related child rows.
// Display records where the country name is longer than eight characters

// (includes Venezuela, Argentina, and Switzerland).

ds.Tables["Customers"].DefaultView.RowFilter =    "Len(Country) > 8";


// Display records where the second and third letter are "ra"

// (includes Brazil and France).

// Note that this expression uses 1-based counting.

ds.Tables["Customers"].DefaultView.RowFilter =

    "Substring(Country, 2, 2) = 'ra'";


// Display all the columns that have a region code of SP, or a null value.

ds.Tables["Customers"].DefaultView.RowFilter =

"IsNull(Region, 'SP') = 'SP'";Aggregate functions and relations in filters
You can also use aggregate functions to create a filter
that restricts related child rows. For example, you can look at all
customers that have total orders greater than a certain dollar
figure. You can also return all the region records that have at least
20 matching customers. In order to use this technique, however, you
need to create a DataRelation between the related
tables first.
The basic syntax is Child(RelationName).ColumnName
or Parent(RelationName).ColumnName. Here are a few
examples that use the Suppliers and
Products tables, which are linked on the
SuppliersID column using a relation named
Suppliers_Products:
// Only display products for a specific supplier.

ds.Tables["Products"].DefaultView.RowFilter =

    "Parent(Suppliers_Products).CompanyName='Tokyo Traders'";

dataGrid1.DataSource = ds.Tables["Products"];


// Display suppliers that have at least five related products.

ds.Tables["Suppliers"].DefaultView.RowFilter =

    "Count(Child(Suppliers_Products).SupplierID) >= 5";

dataGrid1.DataSource = ds.Tables["Suppliers"];


// Display suppliers that have at least one product with more than 50 units

// in stock.

ds.Tables["Suppliers"].DefaultView.RowFilter =

    "Max(Child(Suppliers_Products).UnitsInStock) > 50";

dataGrid1.DataSource = ds.Tables["Suppliers"];
Example 12-2 presents the full code needed to create
a relationship, add it to the DataSet, and then
use it with a relational filter expression.
private void RelationTest_Load(object sender, System.EventArgs e)

{

    string connectionString = "Data Source=localhost;" +

      "Initial Catalog=Northwind;Integrated Security=SSPI";


    string SQL = "SELECT * FROM Suppliers";


    // Create ADO.NET objects.

    SqlConnection con = new SqlConnection(connectionString);

    SqlCommand com = new SqlCommand(SQL, con);

    SqlDataAdapter adapter = new SqlDataAdapter(com);

    DataSet ds = new DataSet("Northwind");


    // Execute the command.

    try

    {

        con.Open();

        adapter.Fill(ds, "Suppliers");


        com.CommandText = "SELECT * FROM Products";

        adapter.Fill(ds, "Products");

    }

    catch (Exception err)

    {

        Console.WriteLine(err.ToString());

    }

    finally

    {

        con.Close();

    }


    // Create references to the parent and child columns.

    DataColumn parentCol = ds.Tables["Suppliers"].Columns["SupplierID"];

    DataColumn childCol = ds.Tables["Products"].Columns["SupplierID"];


    // Create the DataRelation object.

    DataRelation relation = new DataRelation("Suppliers_Products",

      parentCol, childCol);


    // Add the relation to the DataSet.

    ds.Relations.Add(relation);


    // Define the filter expression for the Suppliers table.

    ds.Tables["Suppliers"].DefaultView.RowFilter =

      "Count(Child(Suppliers_Products).SupplierID) > 3";


    // Display the table.

    dataGrid1.DataSource = ds.Tables["Suppliers"];

}
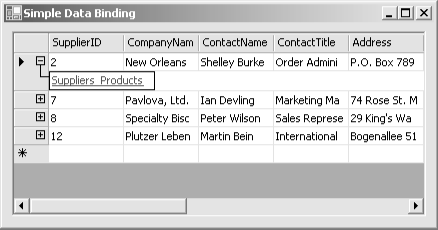
When you try this code, you’ll find that as a side
effect, the DataGrid automatically adds navigation
links that allow you to view the related child rows of a supplier.
These navigational links (shown in Figure 12-3) use
the name of the corresponding DataRelation.
Filtering by Row State
The
DataView.RowStateFilter
property allows you to hide or
show rows based on their state. Table 12-3 shows
the DataViewRowState enumeration values that set
the RowStateFilter. You can use any one of these
values or a bitwise combination of values.
// Show only deleted rows.

ds.Tables["Products"].DefaultView.RowStateFilter =

    DataViewRowState.Deleted;


// Show deleted and added rows.

ds.Tables["Products"].DefaultView.RowStateFilter =

    DataViewRowState.Deleted | DataViewRowState.Added;
By default, the RowStateFilter is set to
CurrentRows and shows everything except rows that
are scheduled for deletion.
Displaying Multiple Views
One of the most useful aspects of the
DataView is the
ability to create multiple DataView objects to
provide different representations of the same data. This technique is
quite straightforward and is shown in Example 12-3
with three separate DataGrid controls. Each
DataView applies a different SQL filter expression
using the RowFilter
property.
private void MultipleView_Load(object sender, System.EventArgs e)

{

    string connectionString = "Data Source=localhost;" +

      "Initial Catalog=Northwind;Integrated Security=SSPI";


    string SQL = "SELECT * FROM Customers";


    // Create ADO.NET objects.

    SqlConnection con = new SqlConnection(connectionString);

    SqlCommand com = new SqlCommand(SQL, con);

    SqlDataAdapter adapter = new SqlDataAdapter(com);

    DataSet ds = new DataSet("Northwind");


    // Execute the command.

    try

    {

        con.Open();

        adapter.Fill(ds, "Customers");

    }

    catch (Exception err)

    {

        Console.WriteLine(err.ToString());

    }

    finally

    {

        con.Close();

    }


    // Create views.

    DataView viewArgentina = new DataView(ds.Tables["Customers"]);

    DataView viewBrazil = new DataView(ds.Tables["Customers"]);


    // Filter views.

    viewArgentina.RowFilter = "Country = 'Argentina'";

    viewBrazil.RowFilter = "Country = 'Brazil'";


    // Perform data binding.

    gridArgentina.DataSource = viewArgentina;

    gridBrazil.DataSource = viewBrazil;

    gridAll.DataSource = ds.Tables["Customers"].DefaultView;

}
Notice that if you modify a row in one view, the changes appear
automatically in all other views. Remember, there is only one data
source—the linked DataTable.
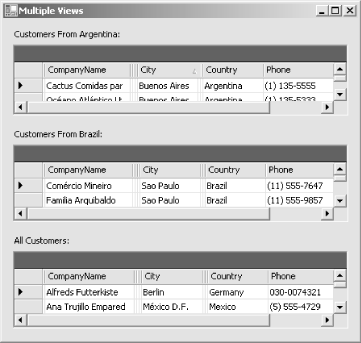
Figure 12-4 shows the three views, each of which
contains only a subset of the full data in the
DataTable.

