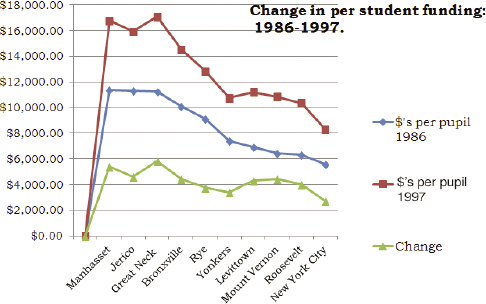
Figure 6.1 Monies spent per student per year were significantly lower from 1986 to 1997 when wealthier suburbs were compared with school funding in New York City. By author.
All of this becomes applicably exigent when ethical suppositions based on moral definitions (justice as equality, for example) are codified in laws that set standards of required practice. Their violation becomes a matter of distress—a distance between declared belief and observed reality—and, to the extent codified ethical injunctions are violated, legal judgment. This sense of violation, and consequent demands for redress, lay at the heart of the legal challenge first advanced in 1993 by a coalition of New York City parents and educators. They described the chronic underfunding of inner-city New York public schools compared to other area schools as a violation of moral definitions of equality enunciated in American laws. To make the case, they created the Campaign for Fiscal Equity (CFE) which launched what became a decade-long court battle.1
In effect, their suit claimed that demonstrable underfunding of inner-city schools unfairly denied poorer students opportunities available to those living in wealthier areas of metropolitan New York.2 If all students are equal and some are denied what others receive, then this inequality is unjust and must be remedied. Second, because the students adversely affected were largely African American, Haitian, and Latino, CFE proponents argued further the alleged inequalities violated Title VI of the 1975 Civil Rights Act.3 So the argument was twofold: first, that some New York City schools were unfairly and thus illegally underfunded relative to other area schools; and second, that there was a racial bias underlying the observed inequalities adversely impacting some students
If successful, the legal challenge would require both redress and a prohibition of the practices inhibiting equal opportunity in education. The US Constitution’s Fourteenth Amendment defines all citizens as equal, irrespective of color, removing race as a rationale for systemic inequalities. The CFE case thus became a constitutional justice case, and it was justice under the law (justice being a moral good in which fairness among claimants reigns) the CFE claimants argued was denied by the realities of unequal school-funding practices.
New York State Supreme Court Justice Leland DeGrasse found in 1995 that persistently inequitable funding levels did exist in a manner that denied inner-city New York students a legally mandated, roughly equal opportunity for a “sound basic education.”4 The nation’s legal code, and the moral declarations underlying it, thus was distressingly breached. The judgment was appealed and in 2006 upheld in a final, presumably definitive decision resulting in the promise of major changes in funding. The effect of changes as a result of those problems has been, at best, partial.
The situation described in CFE court documents was hardly unique. Before Justice DeGrasse’s 2006 ruling, nearly twenty other legal challenges had been brought elsewhere by coalitions similarly arguing against inequalities adversely affecting nonwhite students attending inner-city primary and secondary public schools.5 What made the CFE case so important was that its locus was New York City, a symbol of America’s energy, diversity, and, as a premier “global city,” America’s place in the world.
The case was thus from the start a heady mix of the economic, ethical, moral, legal, political, and social. In all its parts, it was profoundly geographic. New York City’s impoverished schools existed in what Saskia Sassen has described as a “ring of poverty that runs through northern Manhattan, the South Bronx, and much of northern Brooklyn.”6 Outside lie progressively wealthier communities with far better funded schools. W. J. Wilson described the residents of the poverty zone as people who, like Agee and Evans’s sharecroppers, lived with little hope of betterment.7 Poor education in poor communities meant, experts said, urban poverty without end.8Thus the CFE school challenge targeted the effect of systemic poverty on an education system that effectively denied children from poor families the tools they needed to advance out of poverty in the future.
Geographer and multiterm elected Vancouver school trustee Ken Denike and I built a simple graph to track funding differences over a ten-year period between poorer inner-city and wealthier suburban school districts.9 Our graph compared trend lines of funding per pupil from 1986 to 1987, published by Jonathan Kozol,10 with data available a decade later from the New York School Department when the CFE case was first argued in court.

Figure 6.1 Monies spent per student per year were significantly lower from 1986 to 1997 when wealthier suburbs were compared with school funding in New York City. By author.
Figure 6.1 clearly shows not only that New York City schools received less funding per pupil but that the inequalities persisted across a decade in which schools in wealthy suburban municipalities—Manhasset, Jericho, and Great Neck—consistently received more funding per student per year (in some cases double) than those in Levittown, Mount Vernon, Roosevelt, and New York City. To this we added a “change” line that showed while funding improved for all students across this decade (a defense claim in the CFE legal case), increases were smaller in the poorer school districts than in the wealthier. Funding disparities were persistent and real. But were they actionable, violating moral declarations of equality and justice for all? Was this truly distressful or injurious?
Nobody claimed local politicians or school trustees were rabid racists maliciously or self-consciously shortchanging poor students. Most proclaimed themselves distressed by the challenge that funding disparities presented. The problem was, they said, not intentional but the consequential result of a system in which local school financing was (and in many areas still is) based, in large part, on revenues from local property taxes. Poorer school districts received fewer monies because the value of local properties was less and therefore there was less tax money for schools than in school districts with expensive homes owned by wealthier citizens. Here was, by the way, a demonstrable effect of the 1930s redlining of neighborhoods (fig. 4.1) carried into the present.
State educational monies were dispersed primarily on the basis of the number of students in a school rather than on the needs of individual schools or school districts. That funding formula insisted on an equality defined as monies per number of students in a school irrespective of individual need or local circumstance. Equal means equal, irrespective of need. State educational subsidies were largely per-capital, money per student, irrespective of the specific needs of students in local schools.
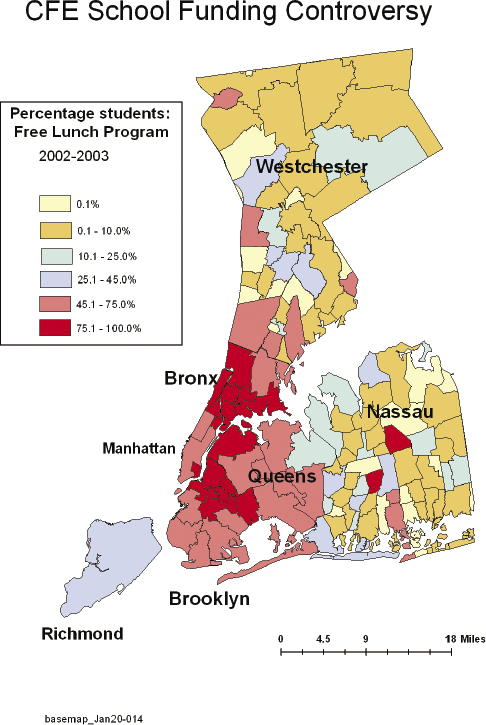
Figure 6.2 Choropleth map of New York City school districts based on the percentage of students participating in free lunch programs, one element of the SAIPE-calculated general poverty index.
We sought to place these facts in a landscape in which relative poverty or at least inequality could be seen. Figure 6.2 mapped the percentage of children in free lunch programs (a SAIPE category) in area school districts as a way of showing the broad relation between poverty and school funding. The map served two functions. First, it was an obvious and pertinent statement of relative poverty among schoolchildren in various area school districts. Second, assuming that child poverty (fig.5.5 is a function of familial poverty, mapping the free lunch program in school districts would roughly reflect school funding based on household incomes. What the map did not show, but in retrospect should have, was that the poorest schools with the greatest number of students in the free lunch program also had the largest number of nonwhite students. The best-funded schools, mostly in Westchester and Nassau counties, had not only the lowest enrollments in the federal lunch program but also the fewest nonwhite children. The worst-funded schools in New York City had almost total participation in the need-based free lunch program and almost no white students. All of this was what the CFE suit had argued.
The long-term result was demonstrable. Public records made clear that most students from the well-funded, overwhelmingly white schools (where few students required free lunches) graduated high school and went on to college or university. Those studying in the less well funded schools with high lunch program enrollments were less likely to graduate and, if they did, were less likely to go on to higher education. A New York Bar Association brief stated the end result in its description of city school graduation rates: “Since the late 1980s, approximately 30% of the approximately 60,000 students who entered ninth grade each year do not receive any type of diploma.”11
As late as 2012, the high school dropout rate in poorer New York City schools, mostly with large African American or Latino student populations, was 20 percent, and of those students who did graduate, only 18 percent received a full regent’s diploma. Other graduates received lesser certifications. Among those who did graduate from the poorest city schools, most still needed some remedial education before they could seek advanced job training. Here was a moral injury, one in which the failure to ethically embrace an ideal of equality had an injurious effect.
The reasons for this were made clear in court documents. Funding per student was lower in school districts in poorer neighborhoods. Teachers in those neighborhoods were paid less because their schools received lower tax-based revenues per student. As a result, poorer schools had a higher percentage of inexperienced teachers as experienced teachers gravitated to better-funded schools elsewhere. Teachers in poorer schools had larger classes because there wasn’t enough money for additional teachers.
Those larger classes led by inexperienced teachers met in overcrowded classrooms housed in school buildings in disrepair. Because the schools as well as the students were poor, classrooms lacked a range of resources and educational programs common in affluent suburban New York school districts like Great Neck, Jericho, and Manhasset. And despite a higher percentage of immigrant students in the poorest school districts, desperately needed ESL training was beyond the budgets of many schools with populations requiring it.
“Everyone wants to think of education as an equalizer—the place where upward mobility gets started,” said Greg J. Duncan, an economist at the University of California, Irvine.12 “But on virtually every measure we have, the gaps between high- and low-income kids are widening. It’s very disheartening.” The resulting gap in turn predicted a pattern of decreased relative future earnings and projected lower lifetime earnings for those without high school degrees.
The result has been a large and growing population of “disconnected youth” without careers, jobs (beyond the always precarious, low paid, and part-time), or real hope for personal betterment.13 These young adults are not surprisingly concentrated in city districts where poverty was most evident in our map of free lunch programs, the school districts with the lowest funding per student.
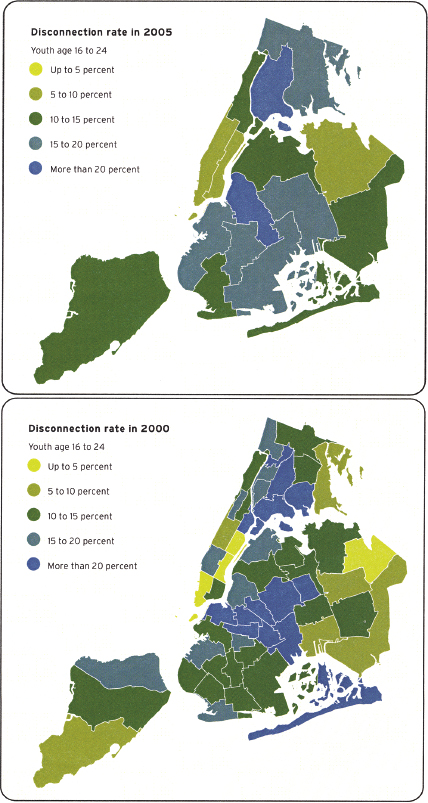
Figure 6.3 Maps of New York City’s “disconnected youth”—those not in school and out of work—correlate with poverty rates and school lunch program rates in New York City. Courtesy Community Service Society of New York and United Way of New York City.
The Community Service Society of New York, in association with the United Way of New York City, mapped first poverty and then the resulting percentage of disconnected youth (those neither attending school nor working) in 2000 and again in 2005 (fig. 6.3). The construction of a class of disconnected, disenfranchised young adults resulting largely from the failure of the educational system, was, Justice DeGrasse wrote in his court opinion, an injurious assault on democracy itself. Society suffers when generations of students are denied an “opportunity for a meaningful high school education, one which prepares [children] to function productively as civic participants.”14 Individuals who lack the tools for civil participation cannot serve as full members of a participatory democratic society (and economy). And so if democracy is a declared moral value, and if it requires an educated and engaged citizenry, then democracy itself is damaged by the funding inequalities evidenced in the maps.
This moral injury in its original sense—an injury to society—was a modern version of the “liberty” arguments advanced by reformers in the nineteenth-century British health-care debates. There, as recounted in chapter 5, the argument had been that health was a requirement if people were to be free to work as equal (taxpaying) citizens. In this case, the argument was that because the government failed to provide young people in New York’s impoverished public schools an adequate education, they were similarly denied equal opportunities and thus equal liberties.
Others described the so-called prosperity gap between rich and poor student education funding as economically ruinous rather than morally untenable and dangerous to the national weal. The “yawning educational achievement gap between the poorest and wealthiest children in America” costs the United States trillions of dollars each year in lost productivity and social services, one study reported.15
In 2015, the United States ranked twenty-eighth among thirty-three nations in math and science scores (behind Poland and Slovenia), in large part because of the failure to ensure suitable educational opportunities for all its children. Were the situation addressed, the cost of improved educational funding would be more than offset by a predicted increase in US gross domestic product of an estimated 6.7 percent and thus a cumulative increase of $10.6 trillion by 2050. Again, and not for the last time, what seemed morally appropriate and thus ethically dictated could be redefined as economically advantageous.
The New York school controversy presented an embarrassment of riches. Its focus was the largest school system in North America, with more than 1.1 million students in a complex mix of more than 1,700 charter, public, private, and religious schools. The New York school budget in 2012 was $24.8 billion. In addition to the court transcripts that detailed the CFE case, available data included a wealth of annual reports—state and federal—on education, income, health, and so on.
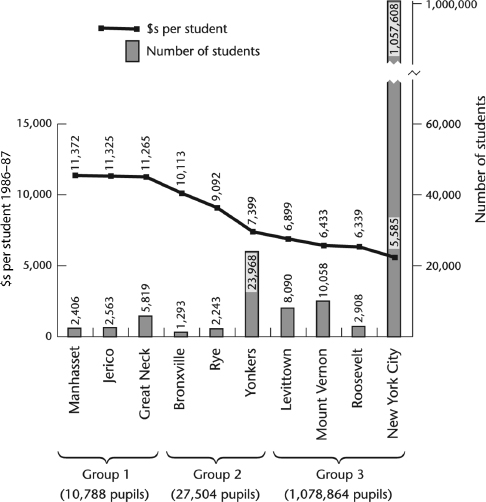
Figure 6.4 Using Jonathan Kozol’s figures, this chart organizes student populations by dollars per student and population. By author.
The New York State Education Department, for example, made a host of statistics on student performance available to the public. Almost any educational measure (dropout rates per school, graduation rates, scores on standardized education tests, etc.) could be summed to show an inverse correlation between local poverty and student performance.
Ken Denike and I summarized the general problem in a graph that seemed to distill evidence from all the maps that we drew, or considered drawing, and all the statistics we reviewed. Figure 6.4 charts the complex realities documented by several agencies. For convenience, we used Kozol’s data from 1986 to 1987 of dollars per student (fig. 6.1) for the varying school jurisdictions. The chart grouped school districts by dollars provided per student into three categories: high (group 1), medium (group 2), and low (group 3). To this we added the number of students in each of the areas for which we had funding data. We did not include a bar or line that would correlate the general data with student ethnicity. It seemed so obvious we thought it unnecessary to do so.
By 2016, partially in response to changes made by the successful court challenge, things had improved somewhat. In a study for the Social Science Research Council’s “Measure of America,” Kristen Lewis and Sarah Burd-Sharps found a 24 percent increase in on-time (i.e., in four years) graduation rates in New York City schools between 2005 and 2016.16 Despite that improvement, racial disparities reflecting economic barriers remained. While 85 percent of all Asian students and 82 percent of all white students graduated on time, the same could be said for just 65.4 percent of black students and 64 percent of Latino students who lived in the most-impoverished, least well serviced school districts. The number dropped to 40 percent for students with special needs, including “English language learners” who needed language training. Comparison of schools in the city, irrespective of greater distance from the suburban communities, made clear that students in poorer neighborhoods continued to be hugely disadvantaged compared to those in wealthier neighborhoods.
Table 6.1 presents the highest and lowest on-time (four-year) graduation rates for New York City public schools. Lowest figures are in the poorest school districts.
Table 6.1 Best and worst four-year graduation rates in New York City (N=59). Lowest figures are in the poorest school districts.

Source: Lewis and Burd-Sharps 2016, 4.
The geographies of school funding disparity exist along clear racial and economic divides, poor black and Latino communities on the one hand, richer white communities on the other.17 The result has been what the sociologist Jeremy E. Fiel described as a kind of racial “resegregation.”18 While the intentional segregation of citizens, including students, is prohibited by law, economic disparities create divisions whose result is segregation, what Jonathan Kozol in 2005 called a shameful “restoration of apartheid.” Simply, poorer schools are mostly black or Latino, while other (usually better-funded) schools are mostly white. The result is not maliciously racist but instead a consequence of the poverty considered in chapter 5. Regressive economic funding policies have traditionally advantaged the children of the well-to-do over those struggling unsuccessfully to overcome the barrier that systemic poverty presents. In most large cities, persons of color are, on average, poorer than white neighbors. Living in formerly redlined neighborhoods, they pay less property tax because they own fewer properties, and those they do own are relatively less expensive. And, tracking back, the poverty of those neighborhoods results from a history of poor educational opportunity and regressive policies affecting nonwhite populations over generations.
A problem this spatial, and one with such a wealth of available data (economic, geographic, and social), provided material for a series of charts, graphs, and maps in which we might have correlated race and ethnicity, poverty and race, family income and school monies with school performance (dropout rates, graduation rates, postsecondary attendance). To these we might have added consequential outcomes including resulting crime rates (higher in poorer communities), health status (Kozol writes about asthma epidemics in poor neighborhoods), health insurance disparities (the poor were less likely to have health insurance), mortality rates, unemployment statistics, and so on. We could have created an atlas. We faced, however, what was for us an insurmountable problem.
To accommodate its huge student population, New York has approximately 417 high schools of various types: charter, city, private, religious, and technical. Assessing outcome and performance data across this institutional mix would have been extremely difficult. As Canadians, we lacked the local knowledge required to navigate the labyrinth of New York’s local complexities. Moreover, posting individual school performance, or any other scholastic measure, onto New York’s dense geographies typically resulted in a map too dense to be read easily. To include high schools’ performance or nonperformance as extracted towers (each school’s height reflecting a performance attribute) resulted in what looked like a map of New York’s skyline (fig. 6.5).
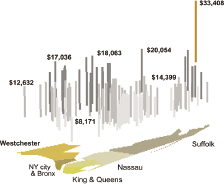
Figure 6.5 This map of New York education funding based on school catchments looks like a map of the city itself, confusing in its profusion of high-rises. Each column stands for per capita income at a single school. By author.
Another, less complex example was needed. Unfortunately, examples abound. It is still common in the United States to have school financing “that ties school budgets to the value of local property wealth” in a manner that concentrates educational dollars “within affluent school districts, and ensure[s] that low-income students are kept on the outside.”19 A national map of school funding (or rather, underfunding) looks almost exactly like the maps of SAIPE poverty presented in chapter 5. The only difference is that, in those maps, the metric is scaled to school districts rather than counties.
Pondering all of this, I was in my hometown of Buffalo, New York, when the local newspaper ran a front-page story on “failing schools.” “Some Buffalo high schools are set up to succeed,” wrote Sandra Tan. “Others aren’t.”20 Six of the city’s fifteen public high schools had graduation rates under 40 percent. As they had been in New York City, the “failing schools” were those with the highest percentages of students for whom English was at best a second language; the greatest number of students with disabilities; and, of course, the highest percentage of students living in poverty. Here, too, lower property tax valuations meant less per capita financial support for the schools. It thus was perhaps inevitable that the poorest schools with the lowest graduation rates persistently reported the lowest student scores on standardized English and math tests and higher dropout rates.
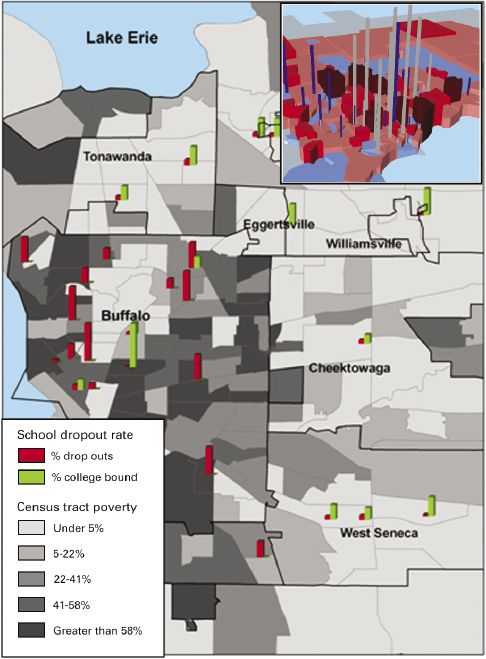
Figure 6.6 High school dropout rates for greater Buffalo, New York, on a landscape of relative poverty. “Failing” high schools are those in or near the areas of greatest poverty.
The result, one high school principal told Tan, was that the principal and her staff “work 20 times harder to mitigate the extreme disparities that exist from school to school without the resources her school needs.” The worst-performing high schools were, in Tan’s words, “the last stop on the dropout train.” They were the last stop because the best public high schools had admission criteria and tests that effectively barred most of the poorest students from transferring to them. Poor students who didn’t score well on entrance examples (because of educational limits) had nowhere else to go.
The New York State Education Department makes available a database detailing graduation and dropout rates for all New York State high schools.21 In addition, U.S. News and World Report provides an annual edition scoring all US high schools based on both demographics and performance criteria (like graduation rates).22 Those data served in the construction of the insert in figure 6.6. The green bars post the percentage of college-bound graduates of area high schools, and the red bars post the dropout rates. Both are presented in a landscape whose surface reflects relative poverty in census districts.
The map and its insert emphasize the degree to which local poverty affects both dropout and graduation rates, with areas of higher poverty clearly grounding the worst outcomes. Both describe a striking but not surprising urban-suburban divide in which less-affluent inner-city schools sited in poorer areas have far higher dropout rates and lower graduation rates than their more affluent suburban counterparts. The one exception is the tall green tower of City Honors, sitting on a central patch of census-defined poverty, a magnet high school for the city’s brightest students who, irrespective of home address, can pass its admissions test.
A simple graph based on the mapped data underscores the general relationship between poverty and performance. In figure 6.7 census-defined poverty and school dropout rates are correlated for the high schools mapped in the previous figures. Dropout rather than graduation rates were used because graduation rates are complicated by the welter of different degrees issued by area schools. They range from the statewide Regents diploma to local certifications. Dropouts who quit school without earning any degree or certification are a clearer indication of performance. These are the “disconnected” of the future, as New York’s United Way would call them, once-students with insufficient skills (in language, math, or anything else salable) to become engaged as positive, adult community members.
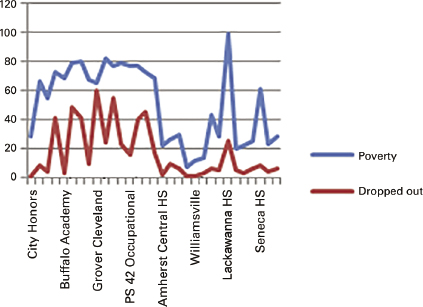
Figure 6.7 Graph of data from the previous map showing the correlation between poverty rates and dropout rates for students at Buffalo city and suburban high schools.
Were this a book about educational opportunities offered and withheld, the Buffalo case would be just one of a number of more or less similar cases demonstrating the effect on student performance of persistent poverty and racial inequality argued in the CFE court case. In 2016, a National Public Radio Education Team partnered with Education Week to present a national portrait of school funding disparities (fig. 6.8).23 Because most US public schools receive 45 percent of their funding from local monies (usually property tax revenues), 45 percent from state resources, and 10 percent from federal disbursements, the problem nationally was the same as it had been in New York City and Buffalo.

Figure 6.8 The National Public Radio Education Team mapped the differences in per student funding across the nation’s school districts. The disparities reflected the ongoing realities of disparities raised in the CFE court case. Courtesy National Public Radio.
The NPR/Education Week story also included, as an example, a focus on schools in the Chicago area where money per student ranged from $9,794 in an inner-city school to $28,639 in an affluent suburban school. Similar disparities—and consequentially similar performance results (higher dropout rates, larger classes, fewer resources)—could be found across the country. Buffalo, where child poverty rates in 2013 (51 percent) were the third highest among the nation’s seventy-five largest cities, remains an extreme case.24 Broken down by ethnicity, that dismal reality included 16.6 percent of all Caucasian students, 39.9 percent of African American students, and 46.1 percent of enrolled Latino students. Alas, that reality is hidden in the NPR map, its scale too small to permit the local to be seen.
The poverty of have-not school districts across the nation signifies a range of woes that reach far beyond educational opportunities offered or withheld. In Buffalo, for example, race and poverty correlate with a range of health disparities affecting student performance in poor communities. At D’Youville Porter (Elementary) School, to take only one example, air pollution resulting in respiratory problems was so common that “instruction at the school includes reading, writing and, for some pupils, how to use an inhaler.”25 Jonathan Kozol reported similar respiratory problems in New York City’s poorest schools.
Perhaps more alarming, lead poisoning was similarly epidemic in Buffalo’s inner city, a toxicity that can result in lifelong neurological deficits.26 The source, while environmental, was far greater in poorer neighborhoods where the money to replace lead-based house paints with new paint was often unavailable. The health problems that begin in elementary school have a cumulative effect on student abilities in high school and beyond.
Little of this can be blamed, as some Buffalonians suggested to me, on the influx of new immigrant families whose children “burdened” or “taxed” the system. Canadian studies have found not only that schools with strong immigrant populations recorded fewer behavioral problems, but also that significant immigrant populations often earned better scores in local schools than the general, nonimmigrant student population.27 In Canada, however, tax-generated education funds are typically distributed by local school boards on the basis of the needs of students in their respective schools. Those with high immigrant populations needing ESL training or other special resources are thus more likely to receive them. Teachers with adequate resources can offer lessons tailored to multiple learning styles and paces in poorer, more immigrant-based communities.28 In the same vein, Canada teachers often negotiate maximum classroom sizes in their contract talks with the government.
In recent years, academics have come to recognize that the issues of crime, education, employment, health, and housing are not separate but interrelated. As a result, they have begun to talk generally about “distressed communities” that lack the resources to provide equal opportunities in education, employment, and health. A study by the Economic Innovation Group (EIG) employed a series of seven indices, including percentage of the population over twenty-five years without a high school degree, median income, unemployment, poverty rate, and percentage change in jobs over time.29 Not surprisingly, the mapped data appeared similar to the maps of SAIPE poverty in 2008 (figs. 5.1, 5.2, 5.6).30 The extreme specificity of its resolution, distress by zip code, makes it even harder to read.
The study ordered cities based on the cumulative effect of the variables being studied. In figure 6.9, the now familiar map type of relative wealth and poverty is included as an insert to a map of the most distressed US cities. In it colored circles, whose size is based on population, present poverty's challenges in a way hard to perceive in zip code, county, or school district maps. The result makes bold the effects of poverty at the finer resolution.

Figure 6.9 This map of “distressed cities” based on seven separate indicators locates and particularizes data in the national map of distressed regions by zip code. Courtesy EIG Group.
At every scale or resolution, the point should be clear. The maps of poverty are maps of educational failure (one index) leading to unemployment (another index) and health problems. Poverty becomes the general category in which specific inequalities have adverse long-term consequences that limit individual opportunities and question the notion of a nation seeking “a more perfect union” for all. The government collects poverty-defining data to identify the disadvantaged areas of the nation requiring communal assistance. Help, however, is rarely forthcoming. In areas where the focus is education, Buffalo can expect little assistance from suburban Amherst, just as the Bronx can expect no help from its wealthier neighbors in Long Island. The ideas of national cohesion and regional cooperation are in this case just ideas, an ethical injunction rarely implemented.
There is certainly moral injury lodged in this congress of maps, charts, and tables and the realities they together present. The students whose education is limited by school poverty are injured when their opportunities for economic and social advancement are stymied. Their health is endangered by the poverty that diminishes their medical care as well as their educational opportunities. As one result, the likelihood of unemployment increases, and that of a prosperous future for those distressed is diminished. “Distressed communities” are the economically disastrous and at best ethically distasteful result (if we believe our moral declarations, then we should do more).
The nation is adversely affected by the many long-term effects of income inequality and systemic poverty adversely affecting education and thus collective futures. As Justice DeGrasse argued, the core ideal of American participatory democracy is injured through the creation of classes of disaffected, disconnected, and disenfranchised citizens without the education or the opportunity to fully engage in civil discussions and debates (remember fig. 6.3). The cost of even minimally maintaining those disenfranchised populations (from the criminal court system to the health needs that result and are treated pro bono in hospital emergency rooms) is vast.
Professionals who work in the education and health systems of distressed cities are morally stressed, and often distressed, to the extent they believe in their respective missions. Teachers cannot provide their students with the education they need, and physicians cannot provide patients with the treatment they require. Entering the system with ideals, young professionals (teachers, doctors, social workers, etc.) find those ideals impossible to realize. As a result, some leave their chosen fields or seek better-paying, less stressful opportunities among wealthier populations. “People think education is the means forward,” one New York State Board of Regents members said to me. “But no matter what we spend, it doesn’t matter. When it’s about poverty in general, no single specific will help.”
Mapping the correlates of poverty, its effects, and school performance (or health outcomes or anything else) creates a chain of evidence. Poverty leads to ill health and underfunded schools and thus to a failure of education and opportunity. The results are pervasive and create a kind of supply-chain ethics. Morally we declare our belief in human life and its worth. Because we believe that, we believe in the equality of all persons, and as a consequence, we believe all deserve an equal opportunity to thrive. Because we believe in those things, justice demands we treat each other fairly. Because we believe in fairness and justice, we insist on ethical programs that ensure an environment in which all should have the same opportunity to thrive. Each step in that chain of opportunity can be mapped in its relation to others within the morals that promote participatory democracy, which is our essential political covenant. And when the chain is broken, we see that, too.
It was this “supply-chain ethics” that lay at the heart of the 2015 US Supreme Court decision known as “Inclusive Communities.”31 In a five-to-four decision, the justices upheld and broadened the central thesis of the Fair Housing Act, passed in the week after Martin Luther King Jr.’s assassination on April 4, 1968. In that judgment, the justices declared that even where discrimination is not the intent, policies that result in discrimination are illegal under a doctrine of “disparate impact.”
To simplify the legalities, the Supreme Court thus ruled generally what Justice DeGrasse had argued specifically. The law sets ethical standards on the basis of moral suppositions (equality irrespective of race, e.g.) requiring specific actions and outcomes. Whatever the intent, when those ethical standards are violated, the result is unacceptable under the law. If we believe in equality of opportunity as a moral good, and freedom to prosper as a civil birthright, then programs that deny their enaction are wrong. As the justices put it, policies that “otherwise make unavailable” to some communities necessities that are freely available to others are or should be considered illegal in a nation whose moral presuppositions include ideals of fairness, freedom, and justice.32
As cartographers, graphic artists, reporters, and statisticians, we usually ignore the ethical supply chain that carries the links of cause and effect to individual outcomes or specific circumstances. We are hired to assess school performance. Our job is to document hospital room admissions. Professional ethics require nothing more than the completion of those tasks. If the data are not maliciously tampered with, the result is deemed “objective,” and we have done our jobs.
We are trained as professionals to ignore the consequential in favor of “the objective standpoint that constitutes the condition of good scholarship.”33 That permits and indeed demands a kind of tunnel vision that looks solely at the narrow outcome, not at its context or its potential effect. And so we collect, analyze, and map (chart or graph) the rate of educational dropouts, the location of students with lead poisoning, the poverty rates of communities, and so on; but unless we are ordered to do so, we never link one dataset to another. The result is at best only half the tale.
We may be disengaged, but that does not mean we are not affected. As citizens, we live with the policies our analyses advance. By not looking to the roots of school failure (or disease rates, etc.), we become complicit in the continuance of conditions that promote the things we chart, describe, or map. We thus promote through our inaction and perhaps willful blindness the uncivil society we then bemoan, the ethical violations of the morals we reflexively pronounce as good citizens.
The result is moral stress. Certainly in the mapping it was for me. I grew up in Buffalo and remember its economic and racial divides. I remember the 1960s, when the suburban schools were favored and city schools generally despised as, in the main, dead-end locations. Buffalonians I talked to in recent years blamed their schools’ poor performance on the parents of impoverished children, teachers “not doing their jobs,” or the school principals … anybody and anything but a funding system that enshrined inequalities and racial disparities evident from the red-lined 1930s into the present day. I blamed myself. I left Buffalo as a teenager and never looked back.
The point is not simply to lament the means by which we come to accept, as I was trained to do, inequality as normal. It is not enough to bemoan the piecemeal manner in which the studies we engage offer at best partial truths obscuring the motive causes of our distress. Instead the point is to insist on an understanding that “objectivity” is necessarily limited and always bounded by our choices. We all are trained to advance small truths that tell big lies. Ethically, the result is a set of false truths that are no truth at all. As the US Supreme Court argued, “intentions” do not matter when the results are disastrous. When that happens, our communal moral declarations are violated, and we are all complicit.