To understand the structure and design of Six Sigma, it's helpful to first understand the philosophy of Six Sigma. The philosophy behind Six Sigma could be summarized as "Deliver Quality." That capital Q in Quality is important. It implies a certain kind of quality, and that is what Six Sigma drives at, a very special definition of quality. Quality is not whatever happens to be the biggest, the strongest, the prettiest, the best, or the coolest. It is not what your organization says it is. It is not what your competition thinks it is. In the world of Six Sigma, quality is what your customer wants. That is all it is. The meaning of the word quality comes from that source and that source only. Nothing else matters. Everything else is irrelevant. GE calls this the Voice of the Customer (VOC).
That's the starting point: build what your customer wants. The next steps into Six Sigma move us into the realm of quantitative analysis. Let's begin with a simple formula:
You change them by collecting and analyzing performance data.
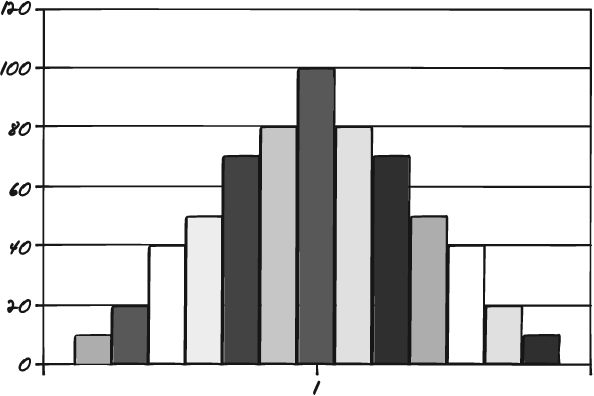
Six Sigma is all about the spread of variation in a set of data. In a normal distribution, data tends to spread out in a very predictable pattern. Most of the values fall around the middle. Some fall more or less to either side. If you plot the result, the figure will look like a bell. Let's move away from light bulbs. Think of another common example: people's height. If you measure the height of 100 18-year-old males, you'll end up with a range of heights. Some will measure 6'2". Some will measure 5'5". Some, 5'11½". Some 6' even. And so on and so on. But most of the 18 year olds will measure 5'9½". In theory, 18-year-old males can be any height. But in nature, the average height is 5'9½", and the natural distribution tapers off evenly on both sides of that number. It looks something like Figure 7-1.
A chart such as that illustrated in Figure 7-1 is called a normal distribution. It has the general shape of a bell, and we know from statistics that's a normal way that data like that should fall.
That brings us to Six Sigma. Six Sigma predicts that when you run a process, the way the performance varies over time will dance up and down around the center line, the average line—just like the range of heights in nature. (There are two caveats here, but don't worry about them right now. I'll look at them later.) But here is the key with Six Sigma: it wants you to put techniques in place to control what numbers (what data points) are going to most influence the average.
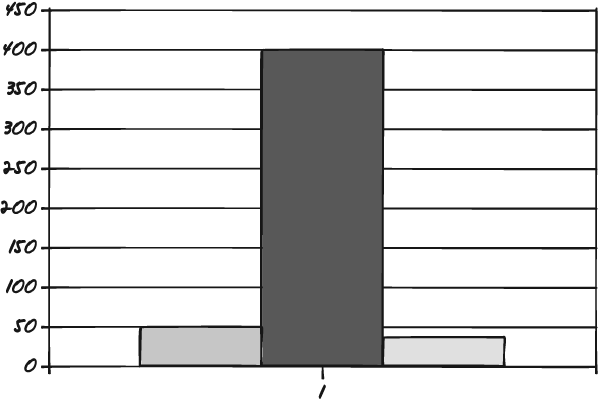
The common understanding of achieving Six Sigma performance is that for every 1,000,000 data points, only 3.4 will deviate from either side of the average. In a grossly exaggerated example, that might look more like Figure 7-2.
In Figure 7-2, we see hardly any variation. Everything is grouped right at the middle. In general, that's not a bad understanding. But the technical explanation is better, and it sheds more light on the purpose and design of Six Sigma. Let's get at this by looking at the name Six Sigma.
Sigma means the same thing as standard deviation. Standard deviation (SD) is a well-founded measure of the range of variation from the average for a group of measurements. In any set of data, 68 percent of all the measurements will fall within one standard deviation of the average. 95 percent of all the measurements will fall within two standard deviations of the average. By the time you're out to six standard deviations—six sigma—you've accounted for 99.9997 percent of the data. Practically nothing is out of those bounds.
At first blush, that might seem like the opposite of what Six Sigma promotes, conformance to the center. But now here's the push: Six Sigma is about good numbers and bad numbers. Good numbers are measures of performance you deem to be acceptable: the numbers you want to hit, the number range in which you want your process to perform. If you're an inventor out to clone The Average Male, you might decide that "good" heights for the clones would fall only between 5'9¼" and 5'9¾". Any other height would be deemed a failure. And so if you were to develop a cloning process performing at six sigma, you would find that 99.9997 percent of the 18-year-old males you turned out would stand between 5'9¼" and 5'9¾" tall. That's a very predictable process. That's a process under control. For every 1,000,000 transactions, that process would turn out only 3.2 defects, taller or shorter males.
So Six Sigma is about process control. The more you are able to control a process, the better you will be able to make it hit the performance numbers you want.
Six Sigma employs two basic methodologies to problem solving. The first is termed DMAIC. DMAIC is used to improve existing processes in an organization. The other methodology is DFSS. It is used when you want to design a new process and introduce it into an organization in a way that supports Six Sigma management techniques.

