
Ending the reliance on the budget variance
Key points
■ Understanding the cost management plan
■ Estimating project costs
■ Types of cost classifications
■ Estimating techniques for project costs
■ Estimating accuracy and confidence levels
■ Pulling the project budget together
■ Approaches to budgeting
■ Publishing the project cash flow
■ Comparing budget and actual results
■ Demonstrating budget control with EVA
■ Costs of crashing the project schedule
In practice
Cost managing is often thought of as cost controlling, although some also use the term ‘cost reporting’. Although used interchangeably, these words are very different in execution. Cost reporting is the act of summarising and communicating costs—after they have been incurred. That is, no control is allowed if you simply report costs—the money has already been spent and, more often than not, in a past time period. Your Visa card statement is a perfect example. At the end of each month, your statement arrives reporting your expenses for that month. The money has gone, the fun has been had, the purchases have been unwrapped and used. There is nothing to control here, is there? Just depressing (perhaps) news on your lifestyle and spending patterns. You can see what you spent and where you spent it.
On the other hand, cost control invites proactive attention to costs to ensure that the money is spent in line with budget projections, and that deviations from this are caught and corrected before too many cost revisions are required. A daily pre-approval check on your intended purchases and the resulting residual bank balance could be thought of as cost control. Radically different concepts, aren’t they? One seeks to report historical data; the other seeks to control present and future data.
It is often surprising—even disappointing—that so many project financial reports focus on the almost sacrosanct importance of the budget variance (budget costs less actual costs). Okay, so they throw in a percentage spent to-date figure, as if this will increase the rigour and decision-making capability of the report.
Knowing what you spent against what you have planned to spend is certainly worth knowing when managing the project budget and particularly important for ensuring you have enough in the budget to finish the project. You can’t really fault that logic. However, if the organisation does not know the value of the work the project has returned (earned), then they are missing the second part of the equation. Earned value analysis will be discussed further later in this chapter.
Chapter overview
Cost management is the process of planning, estimating, budgeting, financing, funding, managing and controlling costs to enable the project to be completed within budget (PMBOK, 2013).
Cost is a four-letter word that should never be under-estimated. Given that some project budgets are often set before the true cost of the project is known, and that money will be spent along the schedule timeline, policing this expenditure requires more than just paying contractor claims and invoices. Stakeholders don’t just want to incur costs; they want a real return on that investment.
Starting with a cost management plan that governs (or at least establishes the protocol for) the funding, distribution, management and control of the money, the challenges for the project manager and team lie in estimating the true costs of the project, finalising a budget that covers the planned expenses and being able to measure, report and control costs throughout the project. With a raft of varied resource types comprising the prime ingredient of costs as they are allocated to project activities, stakeholders need to ensure that the project is not over-funded (potentially encouraging waste, scope creep, inflated accounts or unrealistic expectations). Nor should it be under-funded (potentially encouraging poor quality work, schedule delays, scope omissions, technical non-conformance or contract breaches). So somewhere between these two outliers is where the project budget needs to fall in meeting the costs of delivering the project.
Just as there will be scope variations and schedule variations, the project will also experience cost variations. Estimating costs, determining the budget and controlling the spending pattern will never be absolutely determined and driven by precise calculations, accounting codes, contract conditions and performance management (despite all best intentions). It will ultimately be determined by the expectations the project stakeholders have, which we know are subject to change. When they change, cost control provides the necessary guidance and direction for assessing the implications of the change and any subsequent decisions (not just financial decisions) taken.
By now you should be getting used to the notion that PMBOK is very big on having some sort of plan or document that outlines the approach taken to manage the different knowledge areas of project management (scope, time, cost and so on). While all are vital in outlining (formally or informally) the required management approach, the cost management plan occupies a special place, as it considers the stakeholder requirements for managing costs.
In other words, it is the planning process that establishes the policies, procedures and documentation for planning, managing, expending and controlling project costs (PMBOK, 2013). Not only will different stakeholders contribute different amounts of funding to the project; they will also measure costs in different ways, report costs in different ways and control costs at different times.
In guiding and directing how costs are dealt with, the cost management plan should reference the following information:
■ the source of funds (and associated access)
■ details of the reporting formats, frequency and distribution
■ internal organisational finance protocols and the accounting system
■ identification of percentage variation thresholds triggering action
■ provision for contingency funding (and associated access)
■ approval procedures
■ an accepted level of accuracy in determining realistic cost estimates
■ known units of measurement defined for each resource
■ the degree of precision required
■ a specified performance measurement technique.
As with any plan, the cost management plan establishes the framework to ensure that all of the cost estimation, budgeting and cost-controlling processes are designed into the project and performed as required.
Clearly, the cost management plan provides an agreed pathway for spending. It removes any potential ambiguity (as it should) regarding what the rules of financial engagement are throughout the project. Given such glowing credentials, will it always be created by the project manager and team? Possibly not. The reasons why would include the time taken to prepare it, the constraints set by the project organisation’s internal finance and accounting departments, and the primacy and dominance of some key stakeholders. In some projects, money is simply found and disbursed without too much fanfare, transparency and accountability; in others, the true costs at any point in time throughout the schedule are not known accurately. In yet others, contractor invoices are authorised and paid without referencing the necessary facts, contract clauses or substantiation.
Critical reflection 6.1
PMBOK is full of planning activities in each of the ten knowledge areas as a precursor to the subsequent activities it endorses.
■ Do you engage in discrete cost management (planning) activities for your projects or simply adopt or adapt standard operating procedures?
■ What are the particular differences that planning and managing project costs have over operational methods?
■ Can you see how a sense of shared responsibility might be important in project costing, just as it was in both scope management and time management?
Once the resources have been identified, these costs (they could be dollars or hours) will need to be charged against the project. Cost estimates will include people, materials, equipment, facilities, services, space and/or technology.
In order to begin the process of understanding project costs, a wide range of obvious information is available to the project manager and the team (or estimator), with each offering a further piece of the puzzle necessary to ultimately aggregate the project budget. Let’s first examine the large amount of financial (and related) information required by the project manager and other relevant stakeholders when making important and timely cost decisions. Consider the following examples to begin with (adapted from PMBOK, 2013):
■ project proposal, citing not just the scope inclusions but, equally importantly, the underlying assumptions, acceptance criteria, inspection regime, perceived risks and other constraints impacting the project (limited budget, fixed completion dates, internal policies and procedures, etc.)
■ work breakdown structure (WBS), deconstructing the project activities level by level
■ contractual conditions, prescribing specific work, health and safety, security, policy, performance, intellectual property rights, licences and permits
■ project schedule, reflecting the planned activity sequencing
■ chart of accounts, to track all cash outflows and inflows
■ required quality standards and special conditions
■ asset registers, reflecting whole-of-life costing
■ costs associated with mitigating risk exposure
■ historical documents, identifying where cost overruns and/or savings occurred
■ market conditions, flagging terms and conditions for accessing certain resources
■ quantities and rates of allocated resources (people, equipment and materials)
■ organisational policies, and their compatibility with controlling financial data
■ lessons learned from previous project cash flows and budget measures
■ performance reports, which link performance with progress payments
■ revised cost estimates and budget updates.
Sadly, no one piece of information will contain all the relevant cost information across the project. In fact, in many cases the ‘true’ costs of the project may never be known, tracked or reported—for example, when an operational salary gets transferred to the project overhead. Always remember that the information that is acted upon is only as good as the integrity of the financial system, process and documentation used to capture, report and control that information—another excellent reason for keeping complete, timely and accurate project cost records.
To further assist the cost debate regarding what is and isn’t included, it might be worthwhile to revisit some of the more common cost terms used across organisations and projects. Needless to say, there is no one right term, although I would strongly advocate that more common understanding and application of any of the following terms be adopted early in the life of the project so no subsequent classifying errors could occur. Building on from Kloppenborg (2015), costs could be classified in the following manner:
■ fixed: remain constant as volume varies
■ variable: varying directly with volume
■ direct: associated with a specific project
■ indirect: not associated with a specific project, but required to keep the project functioning
■ recurring: repeat as the project progresses
■ non-recurring: paid once
■ regular: incurred during normal working hours
■ expedited: incurred outside of normal working hours
■ internal: incurred within the project
■ external: incurred outside the project
■ lease: incurred to have access to an asset
■ purchase: incurred in acquiring ownership
■ labour: human resources required for the project
■ material: physical resources required by the project
■ estimate: quantified assessment of the cost
■ reserve: costs allocated to deal with accepted risks.
And as with estimating activity durations, estimating costs brings similar challenges if you have little knowledge of the resource expertise and rate, the activity itself, prior experience and/or knowledge of various different estimating techniques. For some, a process of progressive elaboration works best where you have access to more accurate and detailed designs, technical specifications or quality requirements. As these inputs change themselves, the cost estimate can in turn be revised progressively with increased accuracy.
It is worth noting that estimation outcomes may subsequently create legally binding contractual obligations between the principal (owner) and contractor (supplier) once the project is underway.
As with time estimation, a number of accepted cost estimation techniques are available, including the following:
■ pre-determined: the estimate is announced by senior management (often in isolation from the other variables/constraints)
■ expert judgement: relying on expertise from individuals or groups with specialised knowledge (or training)
■ analogous: accessing historical data from a similar activity that serves as a frame of reference
■ group decision-making: an interactive approach involving team members brainstorming emerging and iterative estimates with increased accuracy and commitment
■ unit rates: commercial rates where the discrete unit of work can be defined accurately
■ published commercial data: subscription services providing access to current unit costs, production rates and other rates for labour, materials and equipment
■ parametric estimating: statistically combining historical information and other project variables (per square metre, per litre, per hour, etc.)
■ value engineering: efforts to reduce project (life-cycle) costs, save time, increase profits and/or improve quality
■ life-cycle costing: inclusion of both the creation costs of the project and its result over its useful life
■ vendor bid analysis: relying on the market through expression of interest (EOI), request for tender (RFT) and other market invitations
■ reserve analysis: a contingency reserve to account for schedule uncertainty and risk (‘known unknowns’)
■ three-point estimation (wide band Delphi): a weighted average requiring optimistic (best case), pessimistic (worst case) and most likely (probable case) estimates that define a range for the expected duration. Two formulae are available for this calculation:
□ tE = (tO + tM + tP)/3 (triangular distribution)
□ tE = (tO + 4tM + tP)/6 (beta distribution).
Figures 6.1 and 6.2 illustrate this concept.
As we saw in Chapter 5, depending on what stage of the project life-cycle you are in, the accuracy behind the estimates might be very low (e.g. ±70 per cent), particularly if the team has limited experience of the specific type of project. In these cases, the accuracy level you have in the estimate might be very low. To further make this point, consider the example in Table 6.1.
Clearly, given the high variability in the cost range in the concept stage, from $1.50 down to $0.50, the project manager and their team might spend more time revising this estimate, or acknowledge that further revisions are required in the planning stage to increase the accuracy of the required estimate. Many greenfield projects start with cost estimates that are marginally confident at best, and for some reason many of these get ‘locked in’, with little room to move as the project reality kicks in. As we saw in Chapter 5, accuracy is very much a progressive concept, as Figure 6.3 illustrates.
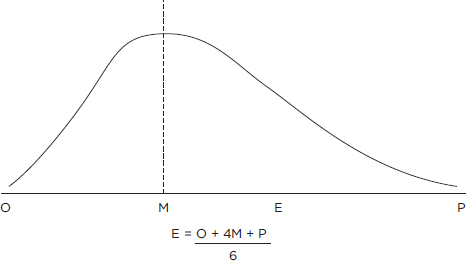
Figure 6.1 The three-point estimation method
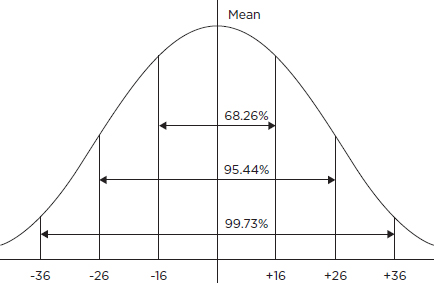
Figure 6.2 The bell curve and standard deviation
Regardless of the estimation technique used, it is important to remember that estimation is not an exact science (despite what some senior management and clients might expect). Given the constant influence that uncertainty and risk have throughout the project, consider the following ‘guidelines’ whenever you are asked to provide an estimate for the activity cost (and similarly with duration):
Table 6.1 Refining the cost estimate accuracy throughout the life-cycle
| Concept | Plan | Execute | Close | |
|---|---|---|---|---|
| Estimate | $1 | $1 | $1 | $1 |
| Confidence +/– | 50% | 25% | 10% | 5% |
| Best case | $0.50 | $0.75 | $0.90 | $0.95 |
| Worst case | $1.50 | $1.25 | $1.10 | $1.05 |
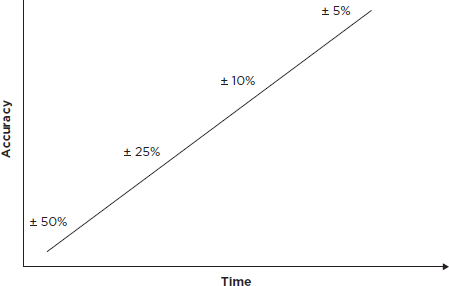
Figure 6.3 Estimating accuracy
■ Record your confidence level (+/– where appropriate).
■ Record how the calculation was determined.
■ Record the broad, provisional or absolute nature.
■ Record all underlying assumptions.
■ Record all impacting constraints.
■ Record any contingency amounts.
■ Record an optimistic, pessimistic and likely range.
■ Record all source data.
■ Record details of all stakeholders involved.
In the early iterations of these estimates, try to resist the temptation (or demand) to get your estimates to perfectly match those from the proposal (where indicative, provisional or initial estimates were made). After all, you now have the activity detail, the subject-matter experts (SMEs) and the time (one would hope) to more accurately estimate what costs are required. It is far better to have two different project windows in this stage, leaving you room to further negotiate, as opposed to trying to fit all the costs into someone else’s unrealistic and out-of-date expectations.
This is not to say that the estimates will not finally have to match those already determined for you by others. The point is that you should have more confidence (and negotiating power), given that the cost estimates have been driven by the technical nature of the work required and the resource capability, and less by potentially extraneous, artificial constraints set by others (for reasons known only to them).
With each project resource assignment, there will be project costs, including both fixed (leasing, management fees) and variable (materials and other consumables) costs. The aim of project cost management is to complete the project within the approved budget. After all, in many cases the budget allocation is a finite resource—although you might be lucky enough to have factored in a contingency or reserve fund, which can help to offset unexpected and unplanned variances.
The role of budgets in cost management
The planning of future activities for your project in financial terms is what budgeting is all about. From a project perspective, budgeting involves setting a target which, in financial terms, reflects how much money you need in order to fund the project and how to control what is spent, when it is spent and why it was spent. It also provides a benchmark to work towards by helping to coordinate and control all the resources and their activities. Finally, budgeting is a financial planning and control process that enhances management credibility with the various stakeholders and outside interests (banks, investors, shareholders and other stakeholders).
Despite these glowing endorsements, not every project has a finite (or, for that matter, a known) budget. In some cases (as with time constraints), budgets will be locked in prior to fully understanding the final scope. Grants and residual funding in some government departments—as the end of the financial year approaches, for example—are examples of this practice, where the belief is that the budget pool will fund exactly what the organisation needs to achieve through the delivery of the project (perhaps they have a crystal ball).
Yes, budgets (known as the authorised cost baseline too) can establish a financial target (or constraint). However, as depicted in Table 6.2, they also come with a range of advantages and disadvantages that should influence the decision-making behind the budgeting process.
Table 6.2 Budgets: Compelling reasons for and against
| Advantages | Disadvantages |
|---|---|
| Improves decision-making | Reduces decision-making to costs only |
| Provides initial cost baseline | Limits innovation, flexibility and change |
| Enables cost control | Lacks provision for contingencies |
| Incorporates operational procedures | Relies on internal financial procedures |
| Accesses expert judgement | Uses historical out-of-date information |
| Improves management credibility | Involves a high degree of uncertainty |
| Targets long-term objectives | Ignores cyclical fluctuations |
| Identifies and diagnoses problems | Communicates unrealistic targets |
| Requires constructive input | Based on ‘guestimates’ and unreliable estimates |
| Enables tracking of cost variances | Fails to set cost thresholds |
Approaches to budgets
There is no perfect way to prepare project budgets. It seems that the stakeholders of each project often stick to what they know and feel comfortable with, despite there being a broad range of budgeting formats they could use, including the following:
■ Traditional: the previous year’s level of performance is the foundation for next year’s figures.
■ Zero based: ignores previous results as each activity and outlay is justified; each activity is recorded with zero spending to begin with.
■ Program: activities are grouped together for projecting costs generated by each program or major activity.
■ Top down: based on pooling the knowledge of senior managers and past results. Project costs are estimated and then passed to lower-level managers, who continue the breakdown into further estimates.
■ Bottom up: individual task budgets are estimated in detail by the people directly responsible for doing or managing the work. Estimates are aggregated to give the total project cost.
Critical reflection 6.2
Many would argue that budgeting apparently improves management credibility while at the same time restricting decision-making mostly to cost-only factors. What other cost contradictions exist in your projects?
■ Do your operational budgeting processes map across to your project budgeting processes (seamlessly or otherwise)?
■ How do budgeting activities help or hinder your ability to plan and manage your projects?
■ Can your budgeting activities be improved in any way to mitigate any potential limitations?
Publishing your budget in the cash flow
Budgets can look pretty good in spreadsheets: nice format, great formula, advanced calculations and bolded totals with underlining for emphasis. So what?
Unfortunately budgets are not spent in columns (though they may well be tracked in columns). In a project, costs are incurred over time, so it is important to see exactly how much money is required at any given point in time throughout the project schedule.
In a strict accounting sense, a cash-flow forecast predicts what money will flow in and out of an organisation over different time periods (day by day, week by week or month by month). Why would a project be any different? Often called time-phased budgeting, the project needs to convert the budget into meaningful time periods when the funds will be required throughout the project, period by period (payroll, material, invoices, travel expenses, etc.).
With Gido and Clements (2015) reminding us that funding coming from the client should be controlled by the terms of payment specified in the contract (or agreement), you will need to ensure that you have money coming in faster than it is going out. The reason for this is simple: if you don’t have sufficient money, you will need to borrow the required amount to cover your expenses and then claim it back from the client (who will hopefully pay). So the earlier you receive the money from the client, the earlier you can deliver that portion of the project with the client’s money. You will also need to read very carefully the terms of trade the client has with you regarding when they pay invoices—and it won’t be within seven days; most probably 30 days or longer.
While project management software is capable of overlaying schedules and cash flow figures automatically, let’s wind the technology back and look at a simple example. Table 6.3 maps out the budgeted cost of a number of activities over five time periods along with the total budgeted cost (TBC) in doing the work.
Table 6.3 Time-phased budgeting
| Phase | Week 1 | Week 2 | Week 3 | Week 4 | TBC |
|---|---|---|---|---|---|
| Design | 3 | 5 | 2 | 10 | |
| Construct | 12 | 20 | 35 | 67 | |
| Total | 3 | 17 | 22 | 35 | 77 |
| Cumulative | 3 | 20 | 42 | 77 | |
So what does the table reveal? Consider the following questions:
■ What information do you now have about the amount of money the project requires each week?
■ How does this information assist you to deliver the project?
■ How do you account for the sudden spike in costs in weeks 2, 3 and 4?
■ At the end of week 2, if you had only spent $15, what inferences could you make about the cause and potential impact of this under-budget expenditure?
Would the reality of week 2 have any ramification for completing the project by the end of week 4?
Critical reflection 6.3
For some project organisations and financial standard operating procedures, being able to visualise cash flow for the project over time (merging schedules and budgets) hasn’t been seen as a priority.
■ Imagine being able to overlay this table format with a Gantt chart (or similar) and being able to see exactly how much money is required to fund the scheduled activities throughout the project. What benefit would this formatting bring to your ability to both plan and manage the project?
■ Can you see any difficulty in getting this format standardised? If so, how would you overcome any challenges?
Comparison of budgets with actual results
A budget offers little meaning if the cost of the planned activities is not compared with the actual results achieved and reported. When the actual result corresponds with the budgeted figure (and can be verified as accurate), financial performance can be considered to be in line with projections or the baseline costs. If there is a significant difference between the two results, the difference or variance may need to be investigated and action taken to correct the cause where possible and/or if required, subject to what upper (over-budget) and lower (under-budget) threshold levels have been set.
Any number of ‘valid’ reasons could explain the variances, including:
■ original estimates not being revised
■ changes in market and/or vendor prices
■ mathematical errors in calculating costs
■ tasks requiring rework
■ cost differentials between replacement resources
■ higher than expected inspection and testing costs
■ revisions to the specification (up or down)
■ rescheduling work outside normal work hours (overtime, penalty rates, etc.).
Perhaps it might be timely to review some of the ‘rules of thumb’ cited earlier for estimating time or costs. Always state the assumptions underlying your estimates, show the level of tolerance stakeholders will accept, state the key factors that affect the validity of your estimates and, finally, indicate how the estimates were derived. This way, your figures can be defended. Regardless of the actual budget format used, the following information could be included to really frame your budgeting development, reporting, analysis and control activities. Yes, everything could be achieved in the one document or spreadsheet, taking the project through the concept, planning, execution and close-out (and/or evaluation) stages (Table 6.4).
While the table may look quite extensive and valuable, like most budgets relied on in project management, it has a fatal flaw. Yes, it tracks what the project is budgeted to spend (the planned value) and what is actually spent (actual cost) in completing the activities up to the status report date, then it in turn calculates a variance. Great—so what is missing? Is project cost management just about tracking and reporting the money? The answer lies with the concept of earned value management (EVM).
Table 6.4 Sample project budget
| Suggested inclusions | Description |
|---|---|
| Budget cost | The original approved cost |
| Estimation technique | How was the budget determined? |
| Confidence level | The degree of confidence and/or accuracy in the estimate |
| Assumptions | The things believed to be true that have not been confirmed (adequate funding available, suppliers will have the capability, etc.) |
| Constraints | The limitations that may impact the estimates (foreign exchange rate, valid for 30 days only, etc.) |
| Contingency reserve | The amount of additional reserve funding, source and approvals required |
| % work complete | The amount of work actually completed to date |
| Actual cost | The reported cost in performing the activities to date |
| % actual cost | The percentage of money spent against the budget |
| Variance percentage | The difference between the budget and the actual costs |
| Acceptable tolerance | The acceptable difference between budget and actual that will not trigger corrective action |
| Corrective action | The required actions to get the budget back into the ‘black’ |
| Budget remaining | The amount of the budget remaining to complete the project |
Controlling project costs
When the Bureau of Meteorology tells us what the daily temperatures will be, it is making a prediction based on historical weather patterns and current conditions. So it is only reporting temperature information; it is not attempting to control the temperature. As we saw both in scope and time management, reporting what the current scope expectations of the stakeholders are (scope baseline), along with the schedule baseline, does little—if anything—to control what subsequent changes will occur (apart from an initial baseline for comparative purposes). In allegedly controlling project costs, the traditional allegiance to reporting budget to actual costs fails to effectively control costs, let alone project performance.
Okay, so it tells us what we have budgeted for, what we have spent and what is left in the budget. But does it tell us what value (in dollar terms of schedule performance) we got for the outlay? No—and this is the missing link in controlling project costs. Table 6.5 shows sample values for the traditional approach taken to control project costs through the budget.
Table 6.5 Traditional project budget analysis
| Budgeted cost | $500 |
| Actual cost | $600 |
| Analysis | $100 over budget |
In this example, if the project was finished, then the budget went over by $100. More importantly, it could be argued that if the project was only 20 per cent complete, for example, the project would appear to be in financial trouble with actual costs exceeding the budgeted amount. Clearly, if this trend were to continue, some questions would need to be asked prior to rushing off and getting contingency funds, including:
■ How accurate were the budget baseline figures?
■ How accurate is the reporting of actual costs?
■ Have there been any approved scope revisions?
■ Has there been any unauthorised scope creep?
■ Were early payments required for mobilisation, deposits, bulk buying or other conditions?
■ Is this nothing more than a temporary blip?
■ What is the acceptable variation threshold, and does this difference trigger corrective action?
■ Does the budget have funds to cover this excess?
Knowing what you planned to spend and what you have spent is, of course, important. But in the example above, we do not know the earned value of the work completed. Figure 6.4 highlights the situation many projects operating under traditional budgeting practices will find themselves in more often than not. Obviously the figure reveals what we planned to spend and what was actually spent (in percentage terms) up to a given time period in which a budget report was required—pretty standard stuff.
If you now add in the vitally important piece of project-relevant cost information—what the money bought in terms of project performance (completed work)—you can infer that the project is behind schedule, but costing more. Try to get that analysis from a variance report. While there may be any number of valid reasons for these apparent discrepancies, detailed cost and time analysis is certainly warranted to mitigate a worsening of the situation. Yes, past trends don’t necessarily predict future trends; however, history does have a habit of repeating itself, so stay alert whenever money is being spent on a project. Always ask yourself: What did it buy in terms of schedule performance to plan?

Figure 6.4 Revealing the missing cost in project budgets
Critical reflection 6.4
The argument that budget, actual and variance reporting fails to provide a meaningful analysis of the project’s performance continues to be disputed (if not rejected) by some financial people working on projects.
■ Obviously budget, actual and variance reporting communicates meaningful information, since it is an iron clad cornerstone of financial management. So what is the information it communicates?
■ How relevant is this same information to you in measuring and reporting your project’s performance?
■ Perhaps the question should be: What are you actually trying to measure in terms of your project’s performance? And what would your answer be?
■ Think more about the four project constraints—scope, time, cost and resources—and ask yourself how traditional budgeting measures and reports each of these.
■ Can you appreciate that just concentrating on how much you have and how much you spent (without knowing what it actually bought you in terms of schedule progression and performance) is a seriously narrow and incomplete report on performance.
■ Now read the section on earned value and see whether you agree with my comments about traditional budgeting.
Earned value management
Over and above the important aspect of traditionally reporting just budget to actual, a true measure of cost control is the practice of EVM. The PMBOK Guide (2013 states that EVM is a methodology that combines scope, schedule and resource measurements to assess both project progress and performance. In other words, earned value is a measure of performance (progress) in terms of scope, schedule and budget metrics (and their implications). With reference to the scope baseline, schedule baseline and cost baseline, progress and performance are constantly measured (in cost, not in units of time), assessed and controlled against these three independent variables.
One of the compelling reasons for using EVA is the misplaced reliance on simply comparing actual costs against budgeted costs. In this scenario, there is no measurement of the work actually completed for the money spent in the time elapsed. In other words, what did the money spent actually buy, performance-wise? Imagine if someone reported the project as 90 per cent spent. This might imply that the budget was still in the black, with 10 per cent of the funds remaining. What if you then found out that only 25 per cent of the work had actually been completed, and that this had cost you 90 per cent of your budget? How would you feel? Might there still be a budget surplus at the end of this project? Or might you require additional funding (and also a new career)?
The calculations underlying EVM begin with the following three metrics:
1 Planned value (PV) is the estimated cost of the scheduled work:
□ Each activity will have its own planned value.
□ It defines the physical activities that should have been completed at any point in time throughout the project and at any status date.
□ The summation of all the planned values throughout the project gives the budget at completion (BAC).
2 Earned value (EV) is the value of the work performed to date, indicating what amount of the budget has been ‘earned’:
□ It requires a progress measurement to be determined reflecting the reported component of work completed as at the status date.
□ It assesses the progress measurement in terms of the budget authorised for that amount of work.
3 Actual costs (AC) are the invoiced costs incurred in performing the completed work to date. They measure costs incurred in delivering the amount of completed work.
Table 6.6 updates the earlier ‘traditional’ example with some meaningful earned value terminology and sample analysis.
Clearly, both the traditional budget versus actual example (Table 6.5) and the EV example in Table 6.6 demonstrate attempts by management to report and control their scope, schedule and costs. However, with the addition of the EV, management can now see the value of the work performed at the status date. Figure 6.5 presents these three measures plotted over time (with the AC exceeding both the PV and the EV), reflecting both schedule and cost data.
Table 6.6 Earned value scenarios
| Planned value | $500 (budget cost) |
| Earned value | $300 (at a status date, $300 worth of earned value gets reported) |
| Actual cost | $600 |
| Analysis | Not only is the project clearly over budget by $100; the project has only delivered scope to the tune of $300 measured against the planned value of $500—the project is behind schedule to the tune of $200 worth of scope. |
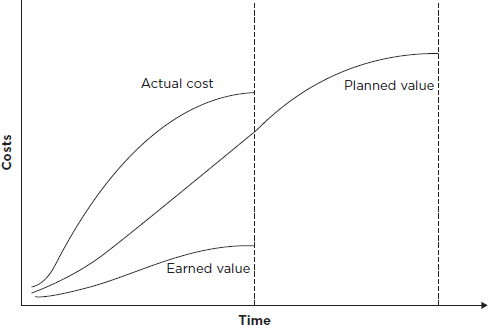
Figure 6.5 Planned value, earned value and actual costs
This analysis replicates the earlier over-budget reality, and highlights the fact that the project is behind schedule. Someone has serious questions to answer:
■ Why hasn’t all the PV (budgeted scope) been delivered?
■ How accurate is the reporting of work completed (percentage complete)?
■ Have there been any unauthorised scope changes?
■ Has all the work completed to date met the technical and quality standards required?
■ Has the schedule been extended so that the scope baseline and schedule baseline are no longer accurate?
■ Have there been supplier issues (out-of-stock, freight delays, etc.)?
Consideration also needs to be given to what the earning rules will be for each activity reported (at each status date). One way to address this is to have a nominated percentage of EV assigned to parts of the activity, enabling the reporting of the EV once the portion is complete. Therefore, an earning rule could be based on a 35/65, 25/75 or 20/80 calculation, effectively signalling work in progress. Alternatively, the 0/100 rule reflects no earnings until the scheduled activity finishes, or the 50/50 rule which allocates a 50 per cent earning value when the activity commences, with the remaining 50 per cent allocated once the activity had been completed. Equally, hours of work performed could also be the appropriate measure instead of the percentile model.
Additionally, percentage complete or spent calculations could include:
■ percentage complete of plan = EV × 100/BAC
■ percentage spent of plan = AC × 100/BAC
■ percentage spent of estimate at completion = AC × 100/EAC.
Let’s now return to the earlier calculations. From these three initial values (PV, EV and AC), two variances can be calculated. The schedule variance (SV) measures the schedule performance (at a point in time or cumulatively) as the difference between the EV and the PV, to assess whether the project is ahead or behind the agreed schedule. The cost variance (CV) measures the cost performance as the difference between the EV and the AC incurred, and reveals either a budget surplus or deficit. Table 6.7 records these calculations, while Figure 6.6 shows an example of how these variances could be graphed and the analysis each could generate over time.
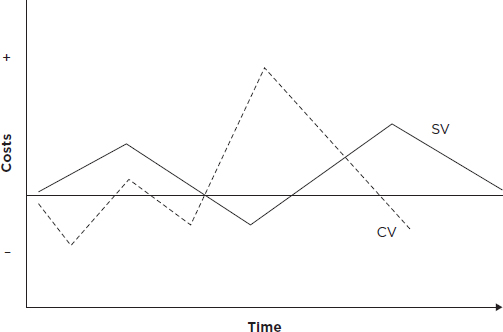
Figure 6.6 Schedule and cost variances
Table 6.7 Schedule and cost variance calculations
| Schedule variance | SV = EV – PV |
| Cost variance | CV = EV – AC |
Table 6.8 Increasing the earned value analysis
| Planned value | $500 worth of planned value (PV) |
| Earned value | $300 worth of earned value (EV) |
| Actual cost | $600 worth of actual cost (AC) |
| Schedule variance (SV) | –$200 worth of progress behind schedule (– indicates behind schedule, + indicates ahead of schedule) |
| Cost variance (CV) | –$300 worth of cost over budget (– indicates over budget, + indicates under budget) |
Referring back to our earlier budget example data, we now have the EVM information, as presented in Table 6.8.
We can now also extend our analysis to look at both schedule-efficiency and cost-efficiency ratios. These ratios (known as performance indices) provide valuable insight into how well the project manager and team are using their time, and how well the money is being spent to complete the work. Perhaps think in terms of the following: for every one day of scheduled performance, how many days are being completed? And for every dollar spent, how much value is being returned? (Both should be expressed as ratios.) Table 6.9 shows how these are calculated.
Table 6.9 Schedule and cost performance index
| Schedule performance index (SPI) | SPI = EV/PV |
| Cost performance index (CPI) | CPI = EV/AC |
Clearly, these indices provide information used not only to determine the project status but, more importantly, to provide a basis for forecasting any project’s final schedule and cost outcome (as shown below for the earlier budget example data). Figure 6.7 shows an example of how these indices could be graphed and of the analysis each could generate over time.
■ Schedule performance index (SPI) = EV/PV(300/500) = 0.6:
□ Values less than 1 indicate that less work was completed than planned.
□ Values greater than 1 indicate that more work was completed than planned.
■ Cost performance index (CPI) = EV/AC(300/600) = 0.5:
□ Values less than 1 indicate that cost overruns for the work completed.
□ Values greater than 1 indicate that cost under-runs for completed work.
Again, the analysis now confirms that neither time nor money is being used efficiently in this sample project. This result could now be used comparatively with other projects in which the organisation has invested, in order to assess the efficiency of these projects within their project register or portfolio, enabling critical decisions to be made on the management of their scope, scheduling and cost baselines.
A few more calculations and we are done. Recall the acronym BAC. By adding up all the PV amounts through the project, you get the budget at completion (BAC) value—the total budget for the project. From our earlier budget example data, we will use the same $500 value:
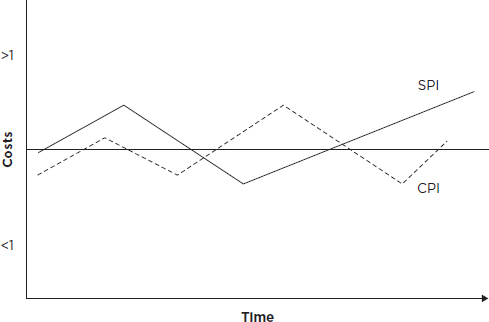
Figure 6.7 Schedule and cost performance index
■ Budget at completion (BAC) = $500.
■ Estimate at completion (EAC) = AC + (BAC – EV) = 600 + (500 – 300) = $800.
■ Variance at completion (VAC) = BAC – EAC = 500 – 800 = –$300 (over budget).
■ Estimate to complete (ETC simple) = EAC – AC = 800 – 600 = $200 (to finish the project).
So what is the result from this analysis? Based on what we have spent to date, the revised budget estimate is likely to be at least $800 should the rate of spending continue, instead of the original $500. We will also need an additional $200 on top of what we have actually spent to complete the project (which, as we know, was based on a single time period in the earlier example, which realistically may now necessitate an extension of time (EOT) to allow for the outstanding work to be completed). Additionally, EV calculations allow for determining the work and funds remaining, along with two additional performance indexes further revealing the issues faced by this project (again, notably because it was based on a single time period):
■ Work remaining = BAC – EV.
■ Funds remaining = BAC – AC.
■ To-complete performance index (TCPI) = BAC – EV / BAC – AC (using a target budget) = 500– 300/500 – 600 = 200/–100 = –2.00.
■ TCPI = BAC – EV/EAC – AC (using a target estimate) = 500 – 300/800 – 600 = 200/200 = 1.00.
This means that the project would have to proceed at a budget efficiency of $2 of scope for every $1 invested to restore the original budget—clearly impossible. The new estimate to complete (of $800) results in a finding that, so long as the CPI is kept at 1.0, the project could be completed within the new estimate. This assumes no further variations will occur to the scope or AC.
As a uniform and aggregate measure of project schedule and cost performance, EV actually adds value itself by radically improving the opportunity to analyse schedule and cost performance data discretely or cumulatively throughout the project. It is important to measure and report on money spent. So is the performance that the money actually bought along the way in terms of achievement, productivity and resource usage – in line with what was planned.
Effective project management requires the ability (and the processes) to measure project performance and then make the appropriate management decisions and interventions. Its integration as the cost-control mechanism will ultimately enable:
■ limiting or preventing scope creep
■ modelling objective communication among stakeholders
■ promoting proactive risk management
■ supporting performance reviews for future cost and schedule outcomes
■ encouraging ongoing transparency and accountability
■ tracking of periodic performance against the scope and schedule baselines
■ applying a single management control system that integrates work, schedule and cost using a WBS
■ allowing non-cost data to measure performance (e.g. hours worked).
EVA is not only an important tool for helping with status reports; it also enables calculations for future work along with predictions in terms of scope, schedule and cost performance.
EV does have its detractors, however—particularly given its reliance on historical information that is then used to forecast revised completion estimates and budget outlays. It places a solid administrative burden on a project, which is dependent on how accurate the work package tracking and reporting needs to be.
As with any statistical measurement, threshold levels really need to be set to flag any major deviations triggering corrective action. So can EVA be promoted as the panacea (magic pill) replacing the need for proactive management and leadership throughout all processes within the project (notably scope, schedule and cost)—not excluding quality, human resources, risk, communication, stakeholders and procurement functions? Finally, EV has no provision to identify and measure project quality or other qualitative performance issues, so there are no guarantees that clients will ultimately accept projects where either schedules or budgets have moved.
Critical reflection 6.5
Much has been made of EVA here, but does it suit every project, big or small, simple or complex?
■ Think about whether EV is appropriate for your current project and justify its inclusion or omission.
■ Given that past performance is embedded in the calculations that end up predicting completion information, how accurate is EV, and is it over-rated?
All too often, the client will decrease or compress the duration of the project (or task). In these cases, they will want exactly the same amount of work performed—albeit in less time and, more often than not, with no increase in costs. So what comes to mind—cancelling some of the work, downgrading the quality, taking some shortcuts?
Another (more positive) way to try to accommodate this schedule revision is through assigning additional resources. These may be more expensive than the normal resources—for example, overtime or weekend working, hiring of subcontractors and the use of more powerful plant are all likely to be more expensive per unit of work done. By way of example, let us assume that an activity’s duration can be reduced by assigning more resources (recall that this was referred to earlier as ‘resource-driven’ scheduling). As a result of this reduction in duration, the costs driving the project will increase. In this scenario, there are four time and cost variables that must be assessed:
1 normal duration: the expected schedule duration that was originally agreed
2 crash duration: the revised (read compressed) time nominated
3 normal cost: the agreed cost for the original schedule duration
4 crash cost: the revised cost to resource the schedule compression.
In Figure 6.8, the cost slope is calculated by the following formula, which calculates a figure (in dollars) for each specified unit of time compressed or crashed:
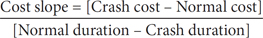
By applying the cost-slope formula and examining the project schedule, it is possible to calculate the cost of reducing the project by one day, two days and so on, in line with the revised expectation. This is known as ‘crashing’—or perhaps accelerating—the delivery date. There is, of course, a limit below which the project duration cannot be reduced without impacting other aspects—such as quality, specifications and resource availability. If the administrative and opportunity costs are known with reasonable accuracy, and the costs per day of reducing the project time are known, then a minimum total cost will occur when the marginal cost of reducing the project by one day is equal to the duration cost. This will also give the optimum project duration if costs are to be minimised.
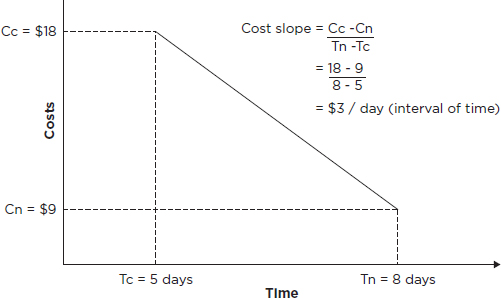
Figure 6.8 Time and cost under normal and crash conditions
However, while this crash cost appears attractive, also consider the ‘dangers’:
■ Not every project can be crashed (let alone without dramatic consequences).
■ It is often extremely difficult to obtain accurate figures for the changes in cost resulting from changes in duration time.
■ The relationship between time and cost tends to be a stepped function rather than a linear or curvilinear one.
■ The crash costs are not always paid for by the sponsor/client and will need to be absorbed. Clearly, margins will be impacted.
■ Accelerated delivery brings with it additional complexity, not to mention anguish, frustration and (perhaps) unrealistic expectations.
Clearly, in attempting to control costs, any number of techniques are available. The earlier you make those discoveries and practise cost control, the less costs will be outlaid in later stages of the project, as demonstrated in Figure 6.9.
So, while crashing the schedule will possibly lead to increased cost and increased risk, what would be the impact of fast-tracking the schedule if this pressure were applied? Not only will you need to consider changing the dependencies between some tasks to shorten the project duration by changing the path to parallel (where technically able); you may also incur more rework, increased costs and greater risk (among other impacts).
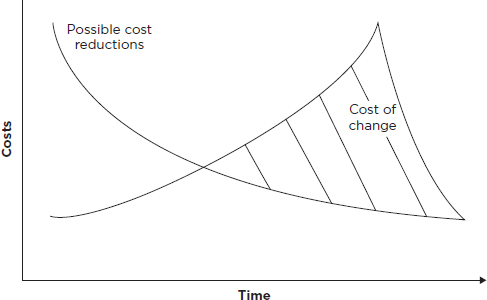
Figure 6.9 The cost of change exceeding original costs
6.1 How would a cost management plan address the challenges of managing project costs within the internal financial procedures and accounting codes of the organisation?
6.2 What are some of the challenges involved in estimating project (resource) costs, and how can these be overcome?
6.3 What benefits do budgeting processes bring to projects, and what weaknesses do they possess?
6.4 What does traditional budgeting fail to report and control in project management?
6.5 How does EVM provide for schedule and cost performance reporting, analysis and forecasting?
Helen loved the spreadsheet she had inherited. Her predecessor had developed it over many months as the finance officer for the company. Not only did it track all the operational costs; it also showed the original estimates, monthly actual-to-date (and percentages) and consolidated year-to-date.
She thought the best parts were the graphs that brought to life rows and columns of fairly boring numbers that filled each page. Colour-coded legends and labels all combined to display either an-over budget, under-budget or on-budget result. As she pored over the file, Helen was confident that she wouldn’t be asked to make any changes in her role as project finance officer—after all, projects spent money, just like the operational side of the business.
At the first project kick-in meeting, her project manager, Ron, asked Helen how she would track all the project costs. Helen was ready for this question and quickly put up her PowerPoint display of the spreadsheet. Thinking Ron would share her enthusiasm, she was shell-shocked to discover that he wasn’t happy at all and she clearly wasn’t comfortable with the barrage of questions she was now getting about measuring the project’s performance over time (whatever that meant), not just the money budgeted and spent.
 Ron knew he needed to adjust Helen’s spreadsheet to build in the missing project-specific financial information and that he would need to educate the team on the calculations, analysis and application of the information.
Ron had worked on previous projects where he had encountered considerable delays and cost overruns. While it was important to know what money was available and how much was spent at any given point in time, Ron had come to appreciate the importance of also knowing what the money spent ‘actually’ bought in terms of project delivery. And while this type of information was historical (as it was based on previous performance up to the reporting date), Ron also realised the value of a window of performance forecasting to help him get the project from the reporting date up to the scheduled finish date.
As the meeting progressed, Ron knew he needed to adjust Helen’s spreadsheet to build in the missing project-specific financial information and that he would need to educate the team on the calculations, analysis and application of the information.
The longer the meeting went on, Ron came to realise that his team also had a history of relying heavily on historical data when estimating with little effort made to contextualise and update the estimates for each project’s cost baseline. And with the accepted practice of always using top-down budgeting to get the project up and running, Ron quickly understood the endemic fixation his team had with its reliance on traditional budget tracking and analysis in their projects.
With a team comprising staff from both the public and private sectors, Ron became increasingly bemused as he listened to the feedback and arguments he received during his presentation. Some of his team had only ever been measured on what they spent—as any part of their budget not fully accounted for was likely to be reduced in the following year. Others had little, if any, experience of bringing a project in on time or on budget, as both extra time and additional money were always found in the end. Others were worried about the increased transparency of having to track, report and control both costs and the schedule from start to finish.
It was clear to Ron that the concepts of scope, schedule and cost, and the intricate interdependencies between all three, had largely escaped his project team. As he took over the meeting again, Ron flagged the following key points:
■ Cost management is more than merely reporting money spent.
■ Reporting formats needed to be agreed.
■ EV would become the cost-control standard for the project.
Ron also knew he would have another battle outside of this meeting, as he would need to convince the finance department that this project and future projects would need a different cost-management procedure and tools over and above what already existed operationally.
Questions
1 Why is Ron convinced that cost management is different from managing operational costs?
2 What additional estimating techniques would Ron like explored and why?
3 What are the major weaknesses in simply comparing budget to AC at each reporting date?
4 What is behind Ron wanting to know the SV and CV?
5 Is EV the panacea for replacing proactive schedule and cost management? If not, why not?