Principles of Pharmacodynamics and Toxicodynamics
Duncan C. Ferguson, University of Illinois at Urbana-Champaign, Urbana, IL, United States
Abstract
Pharmacodynamics (PD) and toxicodynamics relate doses of an agent to the characteristics, quantity, and time course of its biological effect. Together with pharmacokinetic (PK) considerations, the mechanism of action is a key determinant of effect and toxicity. This chapter reviews the terminology, theory, and graphical representation of receptor occupancy by a drug/toxin (Scatchard, sigmoidal log–dose response), and then compares them with graded dose–effect relationships. A brief review of signal transduction mechanisms introduces a more detailed discussion of receptor agonism and antagonism using the reversible two-state receptor theory. Dynamic receptor phenomena leading to hyporeactivity and hyperreactivity are explained through signal transduction and other physiological mechanisms. Finally, methods of estimating drug selectivity and safety (therapeutic index) are summarized. The increasing importance of nonmonotonic dose–effect curves, such those characterized by endocrine disruption, is highlighted. Finally, principles of PK/PD modeling are outlined as a way of improving clinical trial design.
Keywords
Receptor; agonist; antagonist; efficacy; potency; transduction; hyporeactivity; hyperreactivity; selectivity; modeling
Introduction: Pharmacodynamics and Toxicodynamics Defined
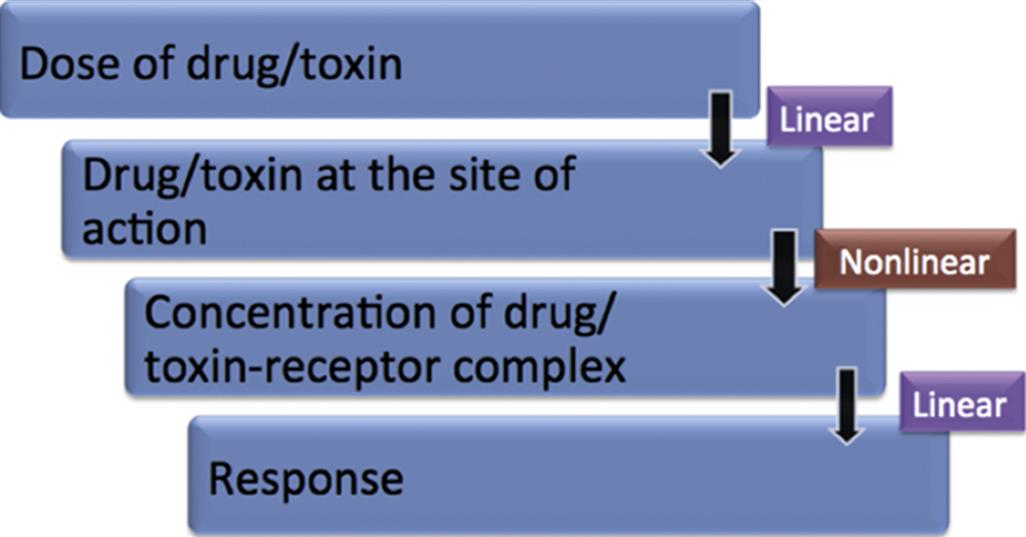
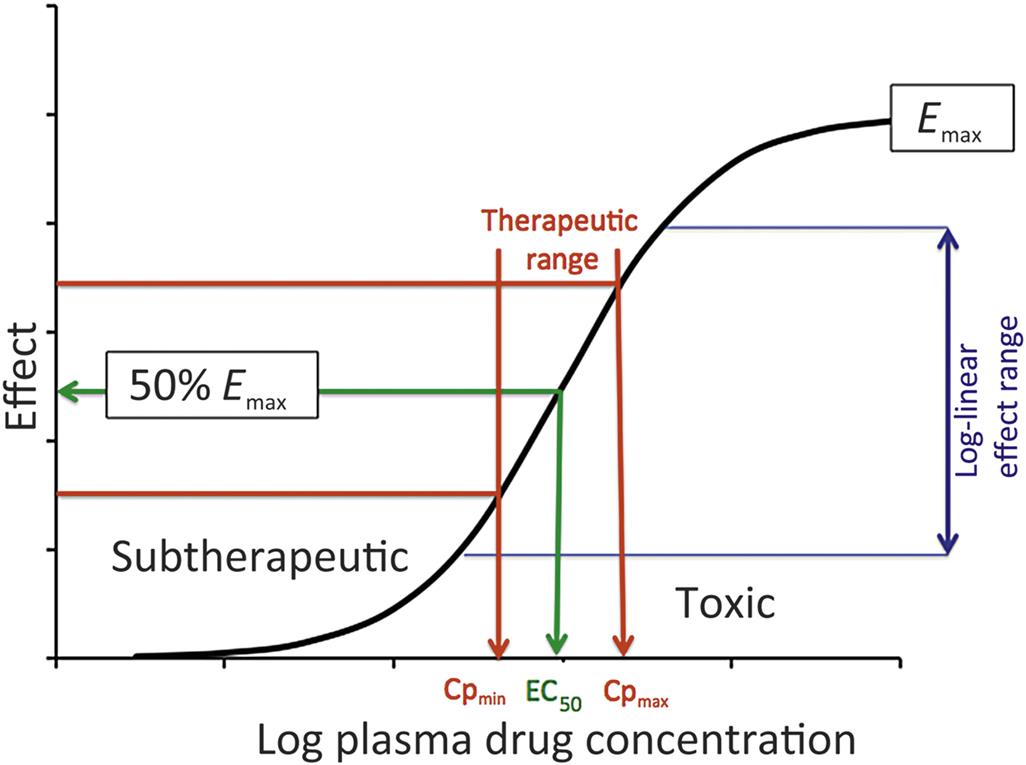
In simple terms, while pharmacokinetics (PK, Chapter 2: Biochemical and Molecular Basis of Toxicity) describes the concentration of a drug or toxin over a time course, pharmacodynamics (PD) and toxicodynamics describe a drug or toxin’s effect on the body over a time course. The underlying premise is that, in the majority of cases, the drug concentration in plasma or tissue fluid drives a reversible mass–action interaction with a protein, most often a receptor, enzyme, or ion channel. In whole organism terms, PK predicts a linear relationship between a compound’s dosage and the concentration achieved initially and at steady-state (see Figure 4.1). However, the mass–action process of binding predicts a nonlinear dose response curve, which is hyperbolic, and can be classically linearized within a certain range by the log–dose (concentration)-response curve, demonstrating a sigmoidal shape, with a threshold and maximal effect (Emax; Figure 4.2). This process only describes toxicodynamic responses, which are dose (concentration) dependent (Type A toxicities of therapeutic agents); that is, are an extension of the therapeutic effect (see Figure 4.2). Type B toxicities are idiosyncratic or nondose dependent, and these are not described by a mass–action relationship. Type B toxicities will not be discussed. In more complex interactions, with multiple receptors or signal transduction mechanisms and feedback loops, the dose-response curve may have be even more complex (e.g., inverted U-shaped), such as may be seen with disruptors of the endocrine system.
Relevance to Toxicological Pathology
The adverse effect of a therapeutic (drug) or toxic agent is determined by its (1) mechanism of action and (2) duration of action. Together with PK considerations and tissue levels, the mechanism of action will determine the tissue sites at which most severe pathological consequences will occur. The continuous nature of the effect of a drug from subtherapeutic to therapeutic and then toxic range is shown in Figure 4.2. The mid-therapeutic or median effective dose (ED50) is not just a PD parameter but is defined by drug clearance (CI), bioavailability (F) and the median effective concentration (EC50) for that drug’s action:

When the logarithm of the dosage of an agent is plotted on the x-axis and effect on the y-axis, the relationship is most often sigmoidal, with a clear “threshold” at the upward curve and maximum effect (Emax) at the plateau at the highest doses. However, within this range, one finds a relatively linear log (dose) versus effect relationship and nestled within that range is the therapeutic range, bounded by the minimum plasma concentration required for an effect (Cp,min) and the upper therapeutic/lowest toxic dose (Cp,max). If an agent’s action is via a single receptor, the concentration range necessary to move from threshold to Emax is observed over about 100-fold concentration range, with the EC50 at the inflection of the sigmoidal plot, achievable by a drug dosage, which also coincides with mid-therapeutic effects. For example, if the EC50 for a drug is 10 nM, the effect of a concentration of 1 nM would be 9.1% of maximum and at 100 nM, it would be 90.9%. Log–dose effect curves with greater slopes would be potentially associated with receptor and/or signal transduction mechanisms associated with cooperativity. Drugs with narrow therapeutic response ranges are often difficult to adapt to safe clinical use.
Drug/Toxin–Receptor Interactions Lead to Signal Transduction and Effect
In most cases, drugs or toxins act on target proteins on or in cells, in particular receptors, enzymes, carrier molecules (cell-associated transporters), and ion channels.
For the sake of the following discussion, drug interaction with these protein targets will be collectively characterized according to receptor theory to explain the dose nonlinear interactions leading to drug or toxin action. Key characteristics of receptors include structural specificity for a class of compound (and vice versa), finite in number (i.e., saturable), and linked to a distinct biological effect.
Specificity is a relative term and it is important to recognize that as the dose and concentration of a drug increases, it may increase its interaction with nontarget receptors, leading to adverse clinical effects.
Receptor Occupancy Theory: Driven by Mass–Action
The vast majority of drugs or toxins (either abbreviated by D) interact reversibly with their cellular protein targets (hereafter called receptors, and abbreviated R). Drugs or toxins combine with their receptors at a rate dependent on the concentration of the drug and receptor, and the resulting drug–receptor complex breaks down at a rate proportional to the number of complexes formed (see equations in Figure 4.3).
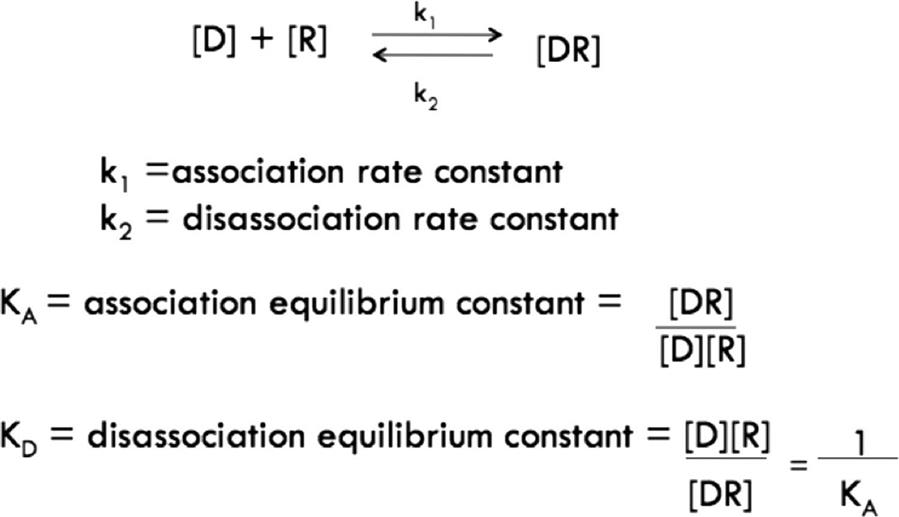
The mass–action relationship between a drug and a receptor is defined by the affinity of binding, defined by the equilibrium association constant (KA) or, more commonly, its inverse, the equilibrium dissociation constant (KD). KD is used more frequently because its units are in concentration units, and it describes the mid-range of concentrations over which the receptor “operates” in detecting circulating or local concentrations of a physiological signal or xenobiotic.
Characterizing Drug–Receptor Binding
In order to determine the characteristics of drug–receptor affinity (KA) and maximal binding (capacity; Bmax), broken cell preparations of a tissue are often incubated with a drug and allowed to come to equilibrium in vitro. Although the technical details are beyond the scope of this discussion, only saturable binding is relevant for analysis of receptor–drug interaction. Figure 4.4 shows the log–concentration versus saturable binding plot to reveal a positive sigmoidal relationship with the inflection of the curve being equal to KD or 1/KA, and an approximately log–linear relationship from 0.1- to 10-fold the concentration represented by the KD.
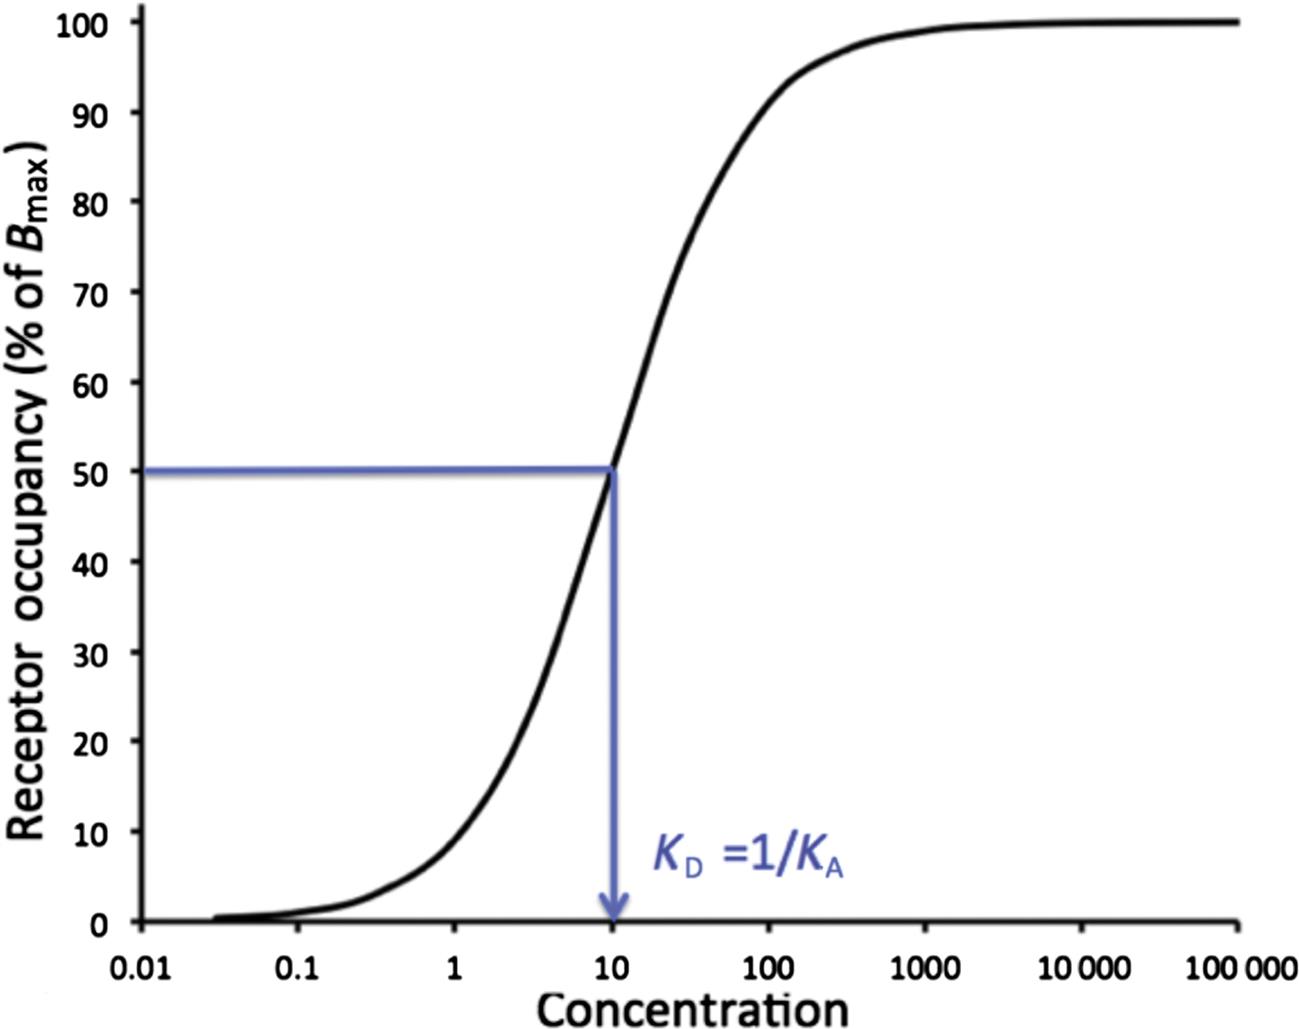
This figure represents the log transformation of the Figure 4.5. In an ideal single-receptor experiment, the receptor occupancy will rise from a threshold to maximum in a concentration range of about 100-fold, and the inflection of the sigmoidal curve represents is observed at (approximately) the equilibrium dissociation constant (KD) if the experimental conditions are ideal. KD is the inverse of the equilibrium association constant (KA).
It is more common to express binding data by starting with the equation for KD in Figure 4.3 and expressing bound drug ([DR] as a function of free drug ([D], [D]free, or F)) resulting in the saturation equations shown in Figure 4.7. Illustrating the relevance and similarity of drug–receptor binding equations to those describing drug–effect relationships, the homologous equation for the latter is also shown (more later).
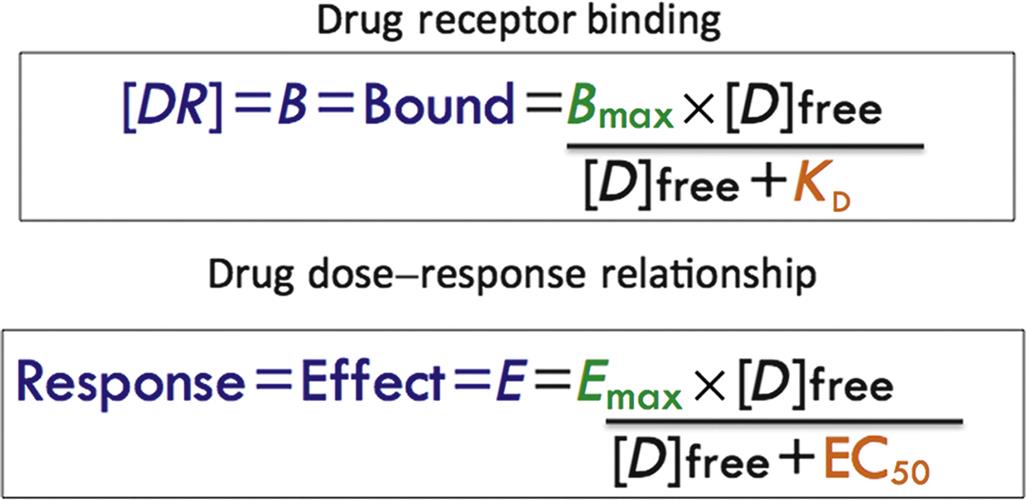
The equations describing the concentration of bound drug (also called [DR] or B) as a function of unbound (free) drug is shown. The sigmoidal curve describing the classical dose-response (effect) relationship produced when the nonlinear portion of the curve is represented by ligand binding to the receptor shows the homology between Emax and Bmax and EC50 and KD.
However, curvilinear plots are prone to bias in interpretation or even computer data fitting, particularly if binding studies reveal targets of multiple affinities. Therefore, the saturation curve equations are commonly transformed by dividing the left-hand side of the equation by the free drug (shown as [D]free but equivalent to F). When B is plotted on the x-axis and B/F on the y-axis, the outcome is the traditional Scatchard plot (Figure 4.6). B is commonly in moles of drug bound per amount of protein in the binding reaction, and B/F is unitless as a ratio of mass or concentration. The Scatchard plot linearizes the data for a single binding site with the slope equal to –KA, which equals −1/KD. Extrapolation to the x-intercept reveals the maximal amount of drug bound (Bmax), which represents the finite capacity of a true receptor system. When there is one or two breaks in the slope of the Scatchard plot, it suggests multiple drug-binding sites. The highest affinity sites are represented by a larger negative slope and generally are felt to be most relevant for biological activity.
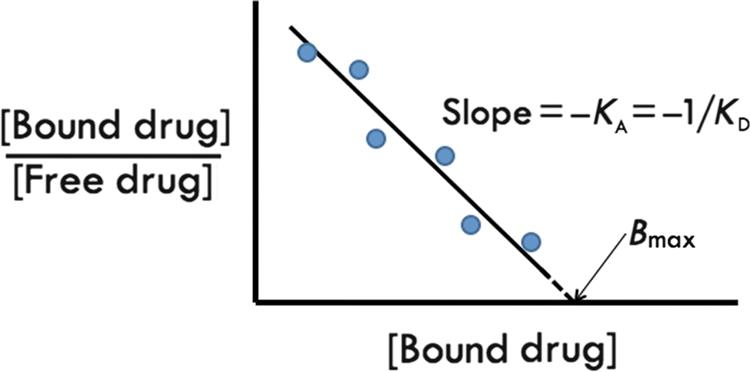
The Scatchard plot of a ligand interacting with a single receptor with a finite-binding capacity (Bmax) and an equilibrium dissociation constant defined by KD. The slope of the curve is the negative reciprocal of KD and the x-intercept is equivalent to Bmax, usually expressed as moles/mg protein, where the protein amount represents the total tissue protein added to the binding reaction.
Mechanisms of Drug Action: General Categories
Drugs and toxins may cause their effects through physical or biological interactions. Biological actions can be divided into receptor-mediated signal transduction and nonreceptor-mediated mechanisms.
Physical Interaction
Examples of drugs that interact through physical or chemical reactions with body fluids or tissues include the osmotic diuretic mannitol and orally administered antacids. These compounds are designed to alter, respectively, osmolarity and pH, but do not interact directly with cellular processes.
Nonreceptor Interaction
Drugs or toxins may directly target enzymes, carrier proteins like ion transporters, ion channels, DNA, and cellular structures like microtubules. Enzyme inhibitors include nonsteroidal antiinflammatory drugs, which inhibit cyclooxygenases, the anticancer drug methotrexate, which inhibits tetrahydrolate reductase, acetylcholinesterase inhibitors like the drug physostigmine or the toxin sarin, and digoxin, an inhibitor of Na+/K+ ATPase. Direct inhibitors of ion channels include Na+ channel blockers such as local anesthetics and calcium channel blockers. Drugs directly inhibiting membrane ion transporters include the proton pump inhibitors omeprazole (Na+/H+ ATPase in gastric parietal cells) and most of the diuretics, such as the thiazides (Na+/Cl− cotransport in distal convoluted renal tubule) and loop diuretics (Na+/K+/2Cl− symport in the thick ascending limb of the renal loop of Henle). Examples of drugs, which interact with DNA, include the anticancer drugs, like lomustine CCNU=1-(2-chloroethyl)-3-cyclohexyl-1-nitrosourea (CCNU), which alkylates DNA, and the fluoroquinolones, which interact with DNA gyrase resulting in alteration of the three-dimensional structure of DNA leading to reduced bacterial replication and death. Drugs interacting with microtubules include the anticancer drugs vincristine and vinblastine. Through this mechanism, the mitotic spindle of the cell is disrupted.
Receptor Interaction
Through interaction with a receptor, a drug often alters the receptor protein’s three-dimensional structure triggering signal transduction processes within the cell resulting in a biological effect. Understanding the details of signal transduction leads to understanding of the timeframe and persistence of the biological effect of drug or toxin, sometimes long after removal of the agent. Signal transduction mechanisms also underlie the phenomena of the cell’s adaptation to a drug or toxin following chronic exposure. These clinically observed phenomena will be described later in this chapter.
Cellular Processes Linking Drug Concentration and Receptor Binding to Cellular Effect
Although a complete review of cellular signal transduction is beyond the scope of this chapter, the reader is directed to a web database maintained by the International Union of Basic and Clinical Pharmacology (IUPHAR), which maintains updated information on signal transduction systems linked with receptors (http://www.iuphar-db.org/). This resource is particularly useful because it tracks information about orphan receptors, which are receptor proteins identified by genome sequencing and molecular biology with homology to known receptors, but which, to date, have not been unequivocally linked to a known effect.
Signal transduction is usually accomplished with one or more of the following key cellular processes, each of which results in allowing a signal (drug) to move its effect from outside the cell to the intracellular compartment. Transmembrane receptors are classified as either ionotropic (linked to ion channels) or metabotropic (linked to biochemical processes). Intracellular receptors include cytosolic and nuclear receptors.
Ionotropic receptors or ligand-gated transmembrane ion channels include γ-aminobutyric acid (GABAA) and ionotropic glycine receptors linked to chloride channels, nicotinic acetylcholine, and glutamate receptors [AMPA=2-amino-2-(3-hydroxy-5-methyl-isoxazol-4-yl)propanoic acid, kainate, and N-methyl-D-aspartate (NMDA)] linked to sodium channels, and serotonin 3 (5HT3) receptors are linked to cation currents. There are also subtypes of GABA (GABAB), glutamate, and serotonin receptors that are metabotropic.
Metabotropic receptors either act directly or indirectly as signal transduction enzymes, or are linked to enzymes that have an extracellular domain recognizing a drug and an intracellular domain that catalyzes a biochemical response. Transmembrane metabotropic receptors include the following:
1. G-protein-coupled receptors (GPCRs)
a. Gs—stimulatory—e.g., coupled to adenylate cyclase.
b. Gi/o—inhibitory—inhibit adenylate cyclase or close Ca++ and open K+ channels.
c. Gq—coupled to phospholipase C-β.
2. Receptors with associated enzymatic activity
a. Plasma membrane kinase-linked receptors: Enzyme activity is part of the receptor’s intracellular domain. Tyrosine or serine kinases phosphorylate a cellular substrate including other kinases that phosphorylate proteins associated with cellular action often through altered gene transcription. For example, insulin receptor.
b. Cytosolic kinase-linked receptors: Janus kinase (a tyrosine kinase) is phosphorylated by the activated plasma membrane receptor. Examples include: cytokines interferons (α, β, and γ), interleukin-2, growth hormone, and leptin.
c. Guanylyl cyclase (GC)-linked: Plasma membrane receptors have GC activity and the cyclic GMP formed activates protein kinase G (PKG) that phosphorylates proteins associated with cellular action. Nitric oxide (NO) can also directly activate cytosolic GC. Examples include atrial natriuretic factor, nitric oxide (directly or via muscarinic receptors).
3. Intracellular receptors (nuclear or cytosolic): Compounds permeate plasma membrane bind to cytosolic and/or nuclear receptors that bind to a DNA response element, which then results in inhibition or activation of mRNA and then protein transcription.
Examples: Lipid soluble drugs/toxins (polychlorinated biphenyls) or lipophilic hormones (e.g., thyroid hormone, steroid hormones).
Characterizing Biological Effects of a Drug or Toxin
As described earlier, for an effect mediated by a single receptor, the log–dose effect relationship parallels that of the log–dose receptor-binding relationship. The term encompassing all factors determining the actual effect is the drug’s intrinsic efficacy, defined as the characteristic that results in a tissue response when that ligand interacts with a receptor. The greater the maximal effect (Emax) of a drug, the greater is the efficacy of that drug.
Efficacy should be distinguished from potency, a term used to compare the receptor affinity or the EC50 of two compounds. The more potent compound has a lower KD or lower EC50, defined as 50% of Emax. EC50 represents the middle of the linear part of the log–dose (concentration)-response curve, and therefore the middle of the “operating” concentration range for the biological effect of a compound.
Agonists
Compounds interacting with receptors are divided into distinct pharmacological types based upon their intrinsic efficacy on a receptor-signal transduction system. A full agonist is a compound that achieves the largest biological effect at its maximally effective concentration. Empirically, this compound has the highest intrinsic efficacy known at that time. A partial agonist is a compound for which the Emax, and therefore the intrinsic efficacy, is less than that of a full agonist. It is important to note that a partial agonist may be more potent than a full agonist, and therefore induces a greater biological effect at a given concentration than a full agonist. A classical example of a partial agonist is buprenorphine, a mu opioid partial agonist. Its activity is compared with morphine, a pure mu agonist. In fact, buprenorphine is about 30-fold more potent than morphine.
Antagonists
Antagonists are any compounds that act to counteract a specific biological action. However, in terms of receptor interaction, they are defined as compounds that do not cause a biological effect alone, and, therefore, have zero intrinsic efficacy. For a pure antagonist, its biological effect is only seen in the presence of an agonist. Antagonists are generally divided into those that are competitive antagonists, that is, they interact reversibly with the receptor and, in a concentration-dependent and affinity-dependent manner, block the binding of an agonist. In the presence of a competitive antagonist, an increased dosage or concentration of an agonist can completely reverse the effect of the antagonist. An example of a competitive antagonist is atenolol for the β1 adrenergic receptor. Most clinically used antagonists are competitive. Noncompetitive antagonists are compounds that allosterically or irreversibly bind with a receptor protein to block the effect of an agonist. Increasing the concentration of an agonist does not reverse the effect of a noncompetitive antagonist through mass–action principles. For irreversible antagonists that might covalently alter a receptor, the effect is indistinguishable from receptor downregulation (vide infra). An example of an irreversible antagonist is phenoxybenzamine, which covalently links with α adrenergic receptor binding site, and an example of an allosteric inhibitor is the benzodiazepine diazepam, which binds noncompetitively to the chloride channel normally activated by GABA resulting in enhancing the effect of GABA on channel chloride conductance and therefore, enhancing membrane hyperpolarization.
Inverse agonists are compounds that interact with receptor-signal transduction systems that have a constitutive level of activity, and through interaction with the receptor, reduce the activity in the direction opposite of that of a pure agonist. Historically, some inverse agonists were previously clinically characterized as pure antagonists. Constitutive activation has been demonstrated for GABA, cannabinoid, histamine, and serotonin receptors. Some Histamine 1 (H1) antagonists have been shown to also be inverse agonists, which can downregulate H1 receptor synthesis.
Reversible Two-State Model of Receptor Activation
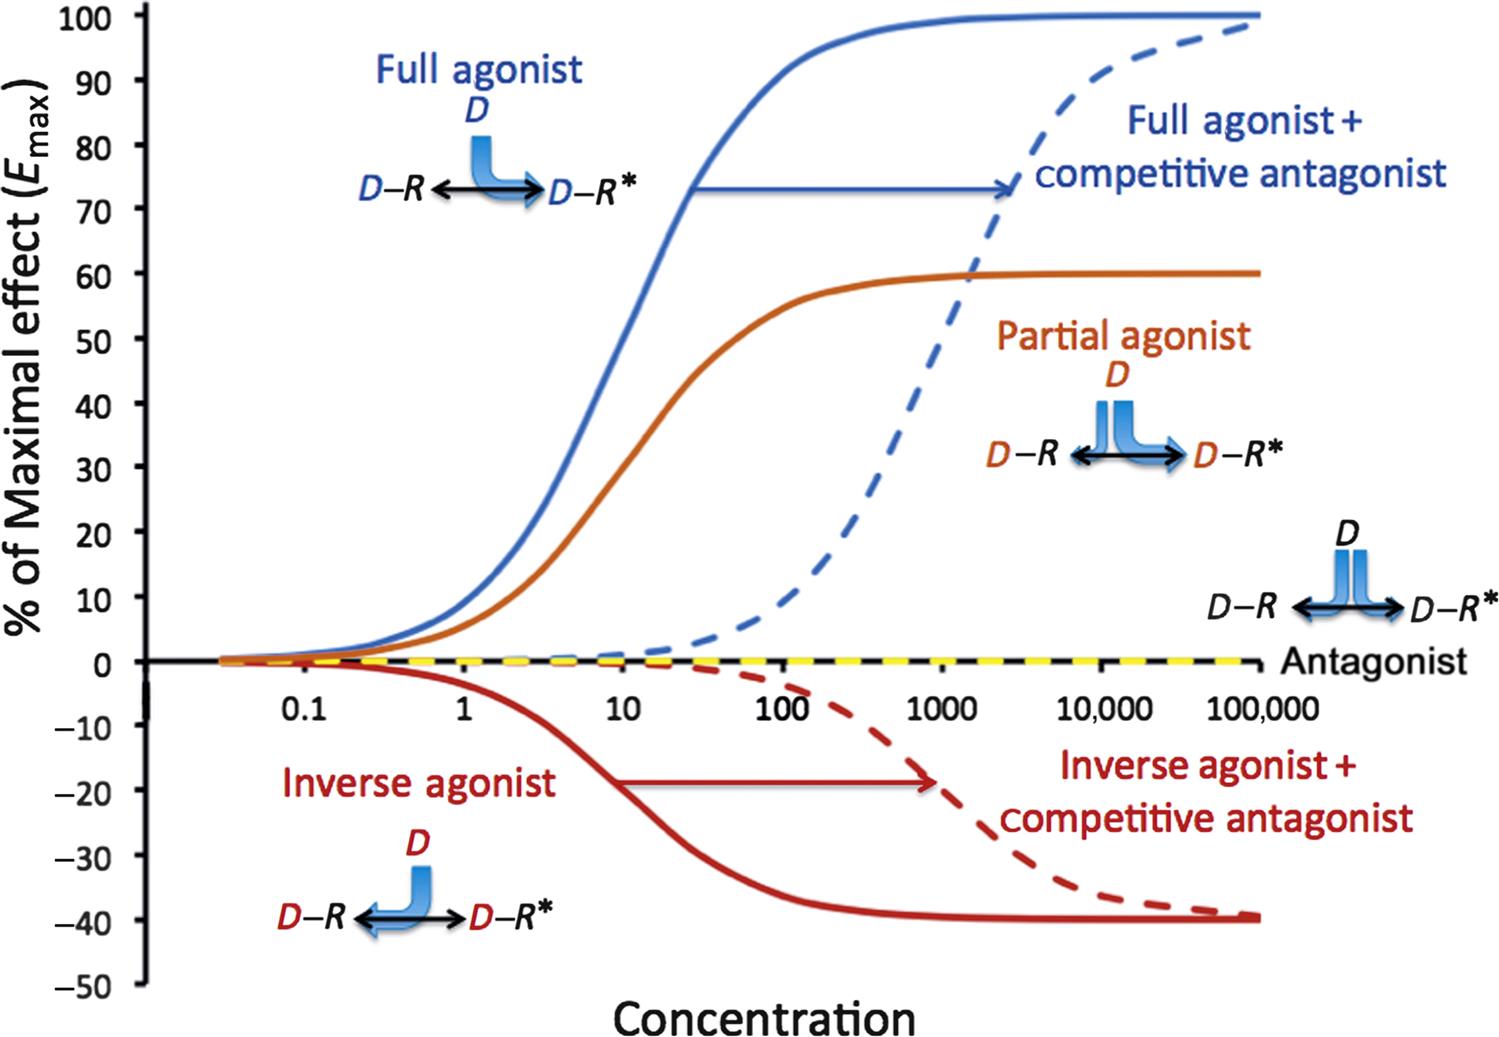
The receptor occupancy theory does not fully account for the existence of partial or inverse agonists, and it does not address the observation that the maximal response of some receptor systems was achieved well before theoretical saturation of the receptor binding. It was not sufficient to characterize receptors as static entities, and this led to a two-state model of receptor activation where receptors are in an equilibrium between resting (R) and activated (R*) states. Figure 4.7A–E illustrates the nonliganded receptor (7a), the full agonist (7b), the full or “neutral” antagonist (7c), the partial agonist (7d), and the inverse agonist (7e). When a full agonist interacts with a receptor, it shifts the equilibrium toward R* and it has a preferential affinity for R* over R, which means that the [D−R*]/[D−R] ratio will be greater than the R*/R ratio. The greater the conformational selectivity for R*, the greater the efficacy. A compound, which binds with equal affinity to R and R*, will not shift the conformational equilibrium, and so will lead to no effect on its own but will act as a competitive antagonist for a full or partial agonist. A partial agonist, while favoring R*, does not shift the conformational equilibrium toward R* as effectively as a pure agonist. An inverse agonist binds with greater affinity to R shifting the conformational equilibrium to R and when interacting with a system where the unliganded receptor has constitutive activity, serves to decrease the effect below constitutive levels, that is, it moves the effect in the opposite direction of a pure or partial agonist.
Figure 4.8 shows the log–dose (concentration) versus effect curves for the same five drug activation scenarios, and also shows the impact of a competitive antagonist in the presence of a full or inverse agonist. It is now apparent that receptors are not restricted to only two conformational states, and that there may be more than one resting or active form of some receptors. Modeling of this level of complexity (ternary models or higher) requires consideration of the details of signal transduction associated with the cellular effects, and is beyond the scope of this review.
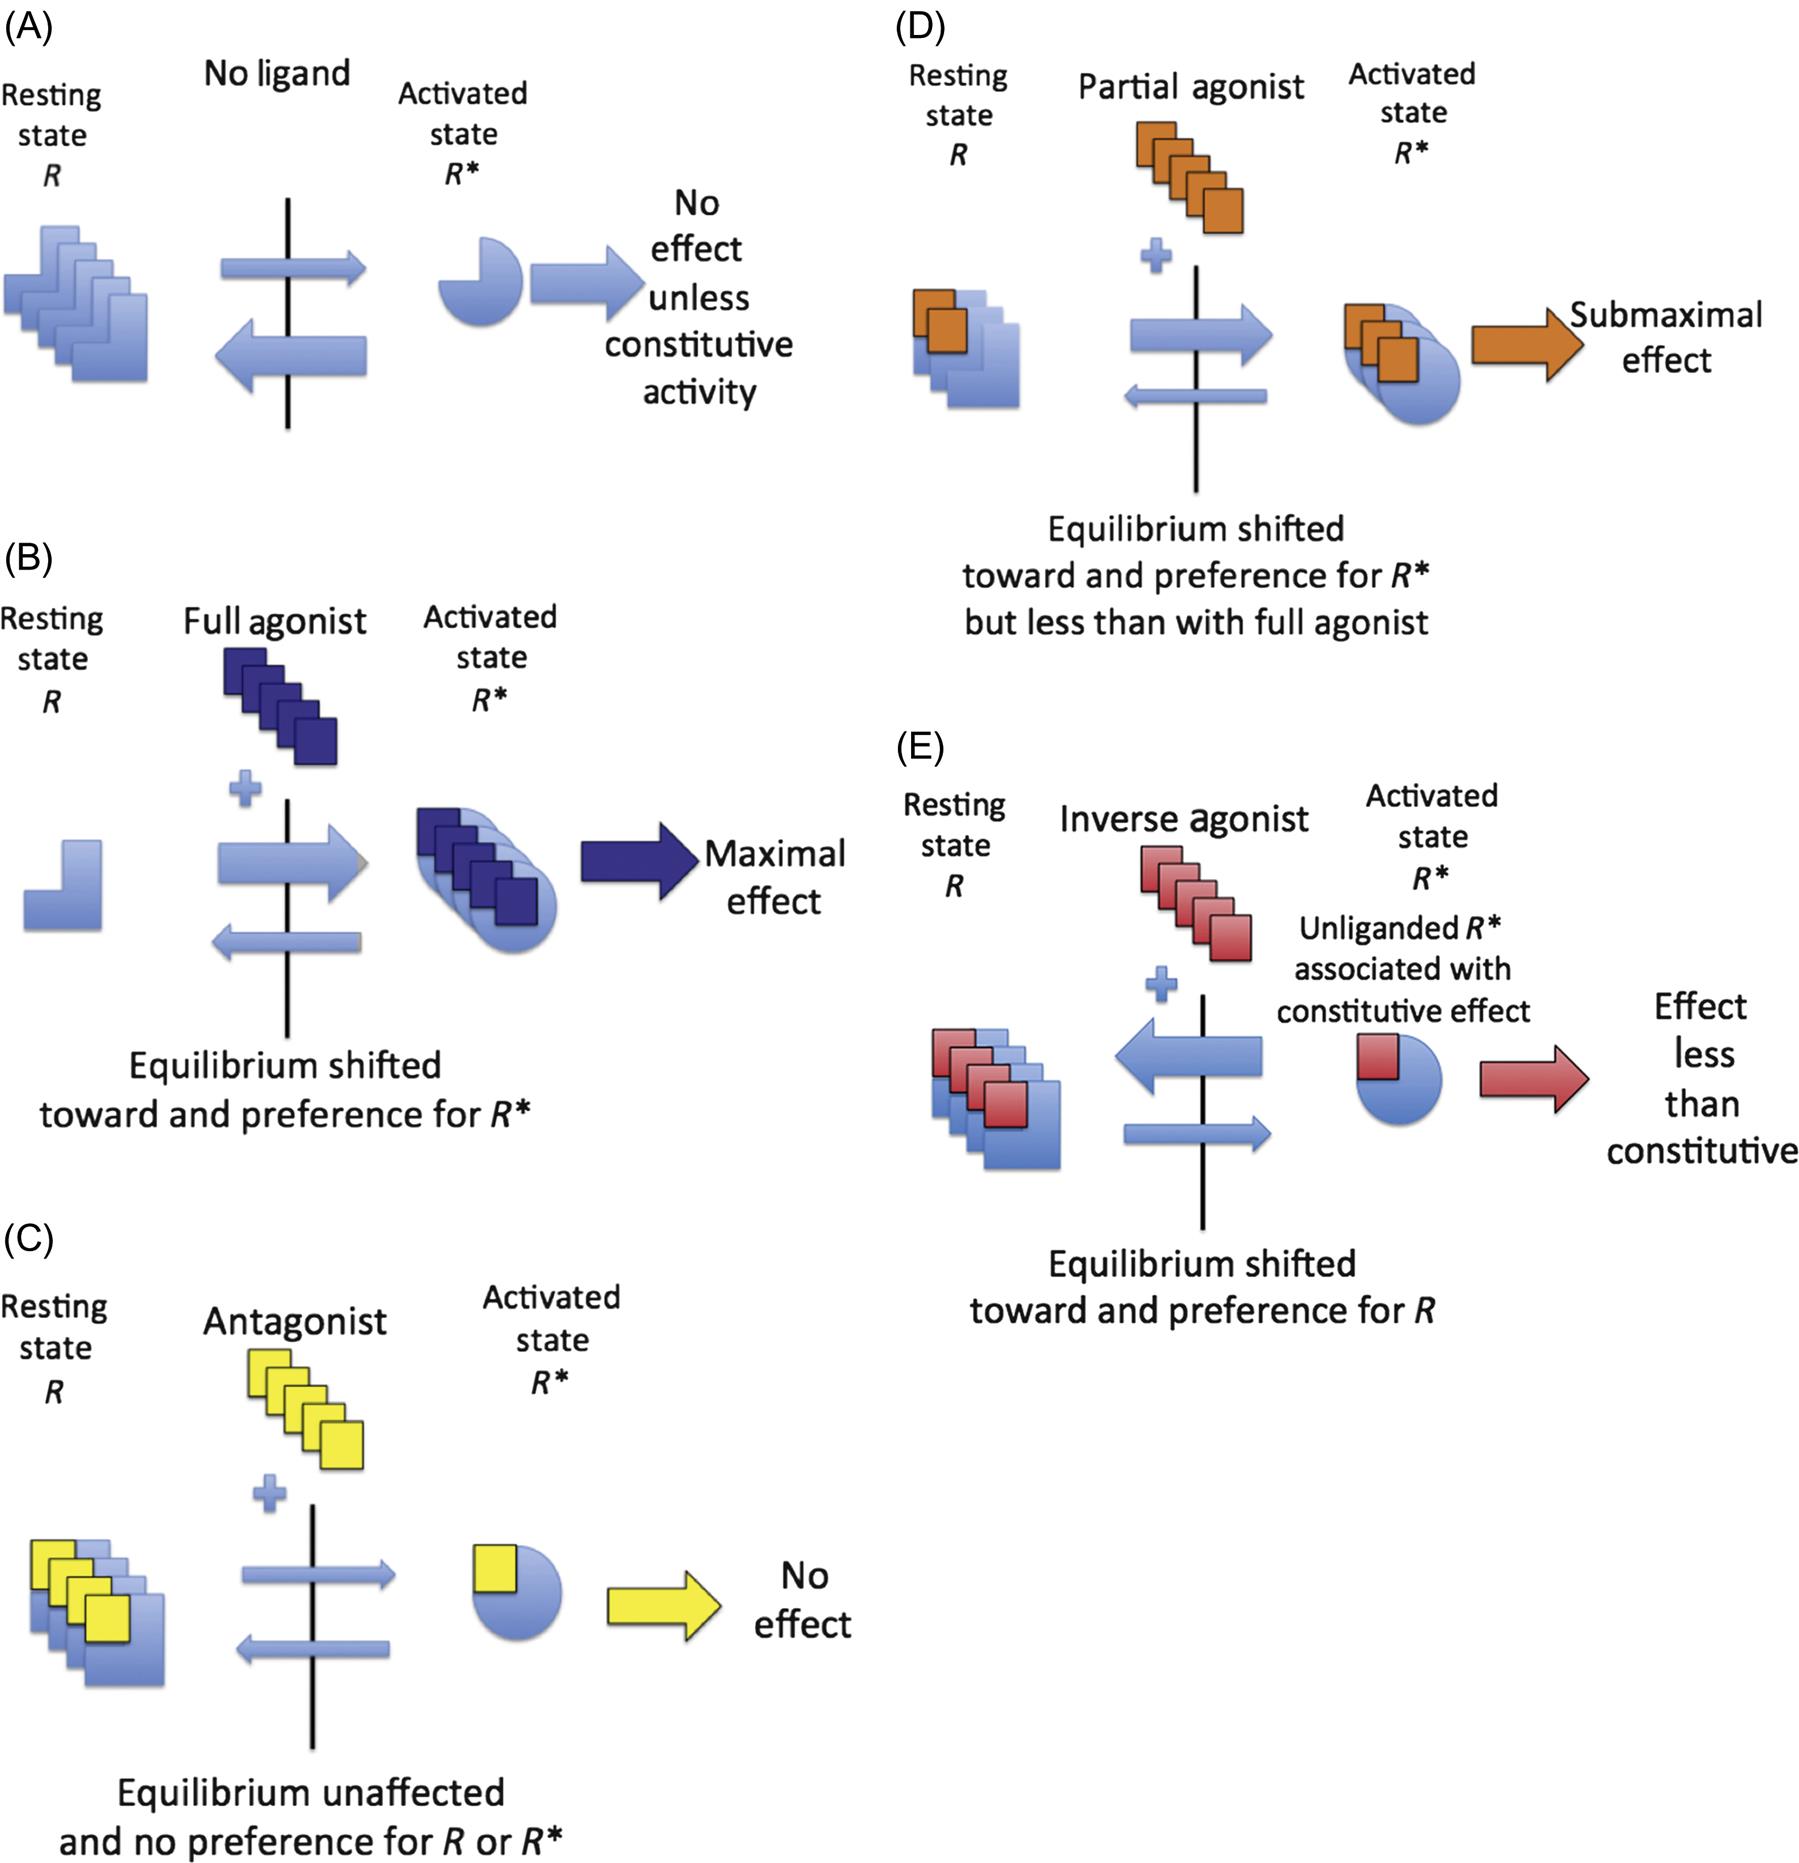
This figure represents the receptor system in the absence of a ligand (A), the impact of addition of a receptor full agonist (B), a competitive antagonist (C), a partial agonist (D), and an inverse agonist (E). Binding of the full agonist (B) moves the equilibrium most effectively toward the active form of the receptor (R*) with no effect by an antagonist (C), which nonetheless can bind equally to both resting (R) and active (R*) forms of the receptor to block the effect of an agonist. A partial agonist (D) is less effective than a full agonist at activating receptors and, therefore, the maximal effect (Emax) will be less than a full agonist. An inverse agonist (E) is an agent, which is capable of moving the effect in the opposite direction of a full or partial agonist, and has been described in systems with constitutive activity in the absence of a ligand. (A) Receptor system in the absence of a ligand (drug or toxin). (B) Receptor system in presence of a full agonist. (C) Receptor system in presence of a competitive antagonist. (D) Receptor system in the presence of a partial agonist. (E) Receptor system in the presence of an inverse agonist.
Spare Receptors
Some drugs have their maximal biological effect at much lower concentrations than expected based upon the receptor-binding affinity. The classical example is with neuromuscular relaxants that are nicotinic acetylcholine receptor antagonists, like D-tubocurarine that competitively block nicotinic receptors in the postsynaptic plasma membrane of skeletal muscle. The nicotinic receptors are linked to Na+ channels. Once depolarized, these receptors/channels undergo temporary desensitization. As a result, to maintain the potential for repetitive stimulation at normal physiological rates, additional receptors must be recruited to maintain contraction. These additional receptors are called spare receptors. Because occupancy of only a small fraction of the receptors is required for maximal muscle contraction, the EC50 for the agonist acetylcholine is much lower than the KD. Because the maximal biological effect is achieved at low percentages of receptor occupancy, it allows a system with apparently high sensitivity because much lower levels of receptor occupancy are needed to achieve maximal effects. To initiate its action, D-tubocurarine must therefore block not only the active receptors, but also the spare receptors.
Selectivity and Safety: Therapeutic Versus Toxic Effect of Drugs
The structural specificity of drug–receptor(s) interaction predicts the clinical selectivity of drug action. More precisely, the ability of receptors or enzymes to recognize and respond to a given drug or toxin is based upon the three-dimensional structure of the protein’s binding pocket. Absolute specificity is not common. For those involved in preclinical phases of drug development, it is important to screen for binding and activity to a variety of receptor types in a variety of tissues to help predict the therapeutic and potentially adverse effects. Most drugs interact with a variety of receptors with varying affinities. However, eventually, it is important to evaluate the drug’s effect in vivo, because relative tissue effects, integrated tissue responses, and counter-responses to a drug are harder to predict. When a drug’s dosage and concentration is increased, “spill-over” effects then occur on lower affinity receptors in the same or other tissues and may contribute to adverse effects. For example, when used clinically, dopamine stimulates renal dopaminergic D1 receptors to induce renovascular dilation at low-dosage infusion rates, but stimulates cardiac β1 adrenergic receptors at intermediate rates causing tachycardia as a side effect, and at even higher dosage infusion rates, stimulates arterial α1 receptors causing vasoconstriction and counteracting the renovascular dilatory effect.
Drugs may interact with tissues not targeted therapeutically, but with the same receptor–effector machinery. A drug may target a different cellular mechanism at higher concentrations. For example, promethazine is a phenothiazine derivative with multiple mechanisms of action: it is an H1 receptor antagonist, a muscarinic, serotoninergic, dopaminergic, and α1-adrenergic receptor antagonist, as well as being a local anesthetic blocking sodium channels. For drugs with a narrow therapeutic window, individual patient therapeutic drug monitoring may be indicated to optimize efficacy while minimizing toxicity (please review Figure 4.2).
Quantal Dose–Effect Curves
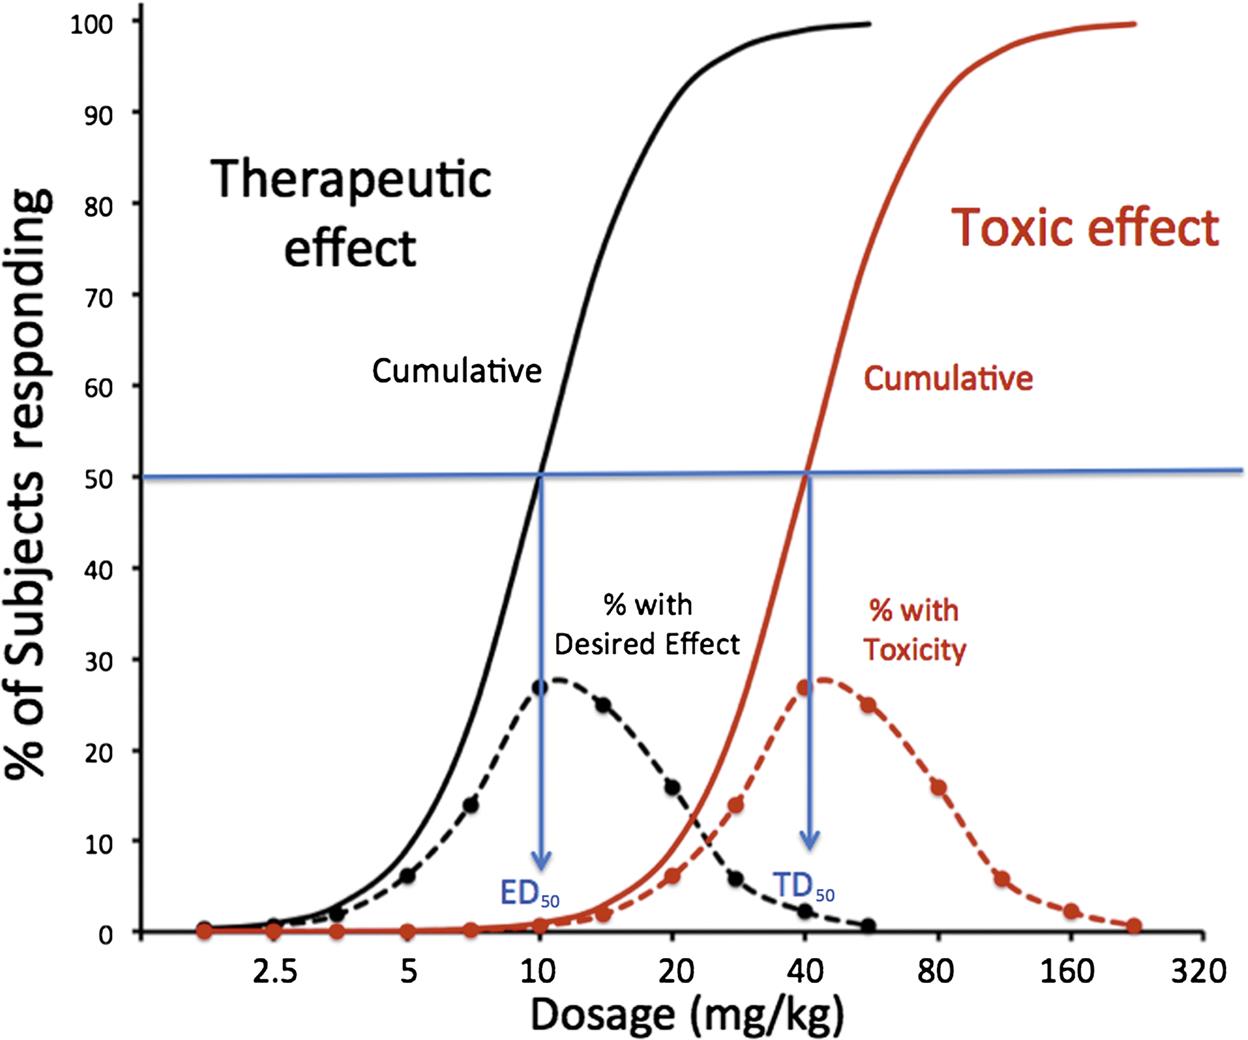
To this point, it has been assumed that dose–effect curves are graded. Across a population of patients, the pharmacological/toxicological effect may appear as an all-or-none (quantal) phenomenon. Examples might be when the endpoint is the occurrence of arrhythmias, seizures, or even mortality. In this case, it is more relevant to know the population statistics regarding such a quantal event. For example, the dose might be plotted against the cumulative percent occurrence of the therapeutic effect, and a second plot of the dosage against the cumulative incidence of adverse effects. For example, with a β receptor 1 agonist, the quantal therapeutic endpoint might be achievement of a 20% increase in heart rate, and for the toxic effects, the incidence of premature ventricular contractions. Such a plot is shown in Figure 4.9. In this plot, the median effective dosage (ED50) is the dosage at which 50% of the subjects have cumulatively demonstrated the therapeutic effect. Likewise, the median toxic dosage (TD50) is the dosage at which 50% of the subjects demonstrate the toxic effect. If the toxic effect is death, the median lethal dose is termed LD50. In modern nonclinical safety studies, achieving LD50 is now rarely an endpoint because of animal welfare considerations. The ratio of TD50:ED50 represents a useful way to characterize the therapeutic index (TI) for a therapeutic compound. Standard safety margin is also used to characterize a drug’s safety in a more conservative manner:

The standard safety margin is the percentage by which the ED99 must be increased before an LD1 is observed.
Forms of Antagonism at the Tissue or Organism Level
Receptor antagonism and inverse agonism are not the only mechanisms leading to reversal of a biological effect. Physiological antagonism is the result of receptor activation with opposing physiological effects. An example would be muscarinic receptor stimulation reducing heart rate and antagonizing β1 receptor agonism that would increase heart rate. Chemical antagonism involves a direct interaction of two molecules within the body. Agents used to treat intoxication often fall into this category. For example, penicillamine chelates Cu++, Pb++, or Hg++.
Dynamic Receptor Phenomena Resulting in Altered Efficacy Following Chronic Dosing
Hyporeactivity
The body has multiple mechanisms to adapt to the administration of multiple doses of a drug or toxin. The general term for developed hyporeactivity is tolerance. When it occurs in relatively short timeframe (hours to days), the term tachypylaxis is used, and usually this is associated with the phenomenon of receptor desensitization (see later). However, the mechanism leading to tolerance after chronic dosing may be difficult to distinguish in the individual patient unless a complete dose-response study is performed, which is generally impractical. However, the cellular or tissue studies may uncover the following mechanisms:
1. Desensitization: When GPCRs are stimulated, the cellular response may diminish over seconds or minutes, even when the agonist remains present. Exemplified by the β adrenergic receptor, rapid desensitization is usually associated with receptor phosphorylation. In a desensitized state, the dose–effect curve would be shifted in parallel to higher concentrations (to the right), and the apparent EC50 would be higher.
Homologous desensitization occurs only when from the stimulated receptor is affected and is mediated by receptor-specific kinases. Heterologous desensitization may occur when unrelated receptors share a similar signal transduction mechanism, such as adenylate cyclase, and is usually mediated by PKA=protein kinase A, which is not receptor specific.
2. Downregulation: With some GPCRs, including BARs=beta adrenergic receptor more chronic stimulation leads to trafficking of the phosphorylated receptor to lysosomes, which effectively reduces the available number of receptors (downregulation) available on the plasma membrane and reduces Bmax and Emax in receptor binding and effect studies, respectively.
3. Exhaustion of Mediators: The action of a drug given chronically can be reduced by the exhaustion of mediators of action. For example, tyramine and amphetamine lead to the release of synaptic catecholamines. Chronic administration may lead to the eventual depletion of catecholamine stores.
4. Hyperreactivity: Hyperreactivity may also occur but mainly with a reduction of endogenous physiological ligands and either super-sensitization (reduced KD and/or EC50) or upregulation (increased Bmax and/or Emax) of receptors. For example, β adrenergic blockers such as propranolol reduce signaling through the G-protein-coupled receptor. Reduction of signaling through adenylate cyclase eventually results in a recruitment and upregulation of β receptors on the cell membrane. Withdrawal of a drug or toxin ligand is recommended when possible to return the normal responsiveness of a receptor-transduction system.
Variation in Drug/Toxin Responsiveness
The actual observed effect of a drug or toxin will be impacted by a number of factors, starting with the individual’s genetic makeup with regard to receptor and signal transduction as well as drug distribution and metabolism. The following list summarizes the main factors impacting a drug or toxin’s ultimate effect on an organism:
1. Alteration in Drug Reaching Target: For the most part, differences or disease-induced changes in PK parameters will reduce the plasma, and therefore, local tissue concentrations of the drug or toxin. An example might be seen with the induction of cytochrome P450 enzymes associated with metabolism of phenobarbital.
2. Alteration in Number or Function of Receptors: The cellular mechanisms leading to hypo- or hyperreactivity are described earlier.
3. Variation in Endogenous Receptor Agonists: The effect of drugs interacting with receptors that have significant physiological ligands will vary depending upon the concentration of endogenous ligands. An example of this phenomenon would be the effect of the α1 receptor competitive antagonist prazosin to reduce blood pressure would be determined by the amount of endogenous catecholamines.
4. Physiological Adaptation: A number of physiological mechanisms unrelated to a specific receptor-transduction system may also impact the observed effect in the whole organism. For example, when diuretics are used as antihypertensive drugs, they reduce whole body sodium concentrations and blood pressure. In response, the renin-angiotensin-aldosterone system may be activated resulting in increased renal sodium retention, angiotensin, and aldosterone, counteracting the beneficial diuretic effect.
Nonmonotonic Dose–Effect Curves
Standard toxicology testing generally involves the evaluation of relatively high concentrations of a compound to establish a threshold below, which no adverse effects are observed. As more low-dose toxicology studies are performed with compounds suspected of disruption of the endocrine or neurotransmitter systems, it has become apparent that not all dose-response curves are characterized by graded responses from low concentrations to toxic at higher concentrations. Instead, the dose-response is best represented as an inverted U-shaped curve (Figure 4.10). For example, at the cellular level, growth of estrogen-dependent human breast cancer cells in culture has been shown to increase their replication rate in response to increasing estradiol concentrations reaching a maximal response with higher concentrations then slowing growth and eventually leading to direct cytotoxicity. The lowest concentration range reflects the physiological response to estrogen and is dependent upon the presence of estrogen receptors. The high-dose effects are not estrogen-dependent.
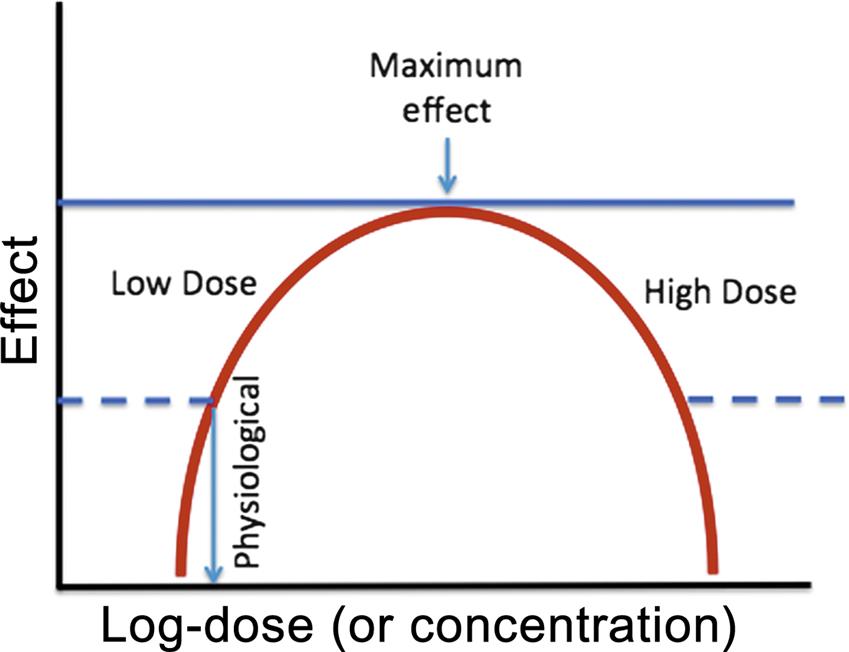
Inverted U-shaped dose–effect curves have also been described in animal and human cognitive functions such as spatial working memory. In fact, dopamine 1 (D1) receptor agonist stimulation or direct dopaminergic neuron stimulation in the prefrontal cortex has demonstrated that too little or too much D1 receptor stimulation will impair spatial working memory (Vijayraghavan et al., 2007). Of increasing regulatory significance, for some toxicities described by an inverted U-shaped dose–effect curve, there is no threshold of adverse effect upon which to establish a no adverse effect level of a toxin.
Principles of Pharmacokinetic/Pharmacodynamic Modeling
PK/PD modeling has been proposed as a more systematic alternative to dose-titration trials. Toutain (2009) provides an excellent review of the process. Three major parts constitute an integrated PK/PD model: a PK model that transforms a given dose to a concentration versus time profile, a link model representing the transfer of the drug from plasma into the a concentration in the compartment associated with the effect (e.g., tissue receptor) and a PD model describing the relationship between drug concentration in this compartment to the effect.
In linking PK time course data to such PD data in a PK/PD model, the modeling process must recognize that PK and PD data are not in phase, so a feedback (hysteresis) loop must be included to account for the delay in drug effect. PK models have been described in Chapter 3: Pharmacokinetics and Toxicokinetics. The link model is designed when the source of the delay is known. If it is determined that the delay is associated with the rate of transfer from the plasma to the tissue site of drug action, then a first order rate constant (Ke0) may be sufficient to describe the link model. If the delay is associated with a time-dependent process in signal transduction and action, then the equations used may represent the kinetics of appearance and disappearance of the effect. Drug effects may be represented by stimulation or inhibition.
PD models may be graded or quantal, as previously described. If graded, studies are designed to establish in vivo the parameters Emax, EC50, and the slope (sensitivity) of the linear portion of the sigmoidal log–dose effect curve. Graded PD models are commonly described by the sigmoidal Emax model: E(t)=E0+Emax×Cn(t)/(EC50n+Cn(t)). E(t) is the effect for a concentration at time t (C(t)), and E0 is either the basal or placebo effect. Emax and EC50 have been previously described, and n is the Hill coefficient, which is the slope of the dose–effect relationship. When the drug is an inhibitor, median inhibitory concentration IC50 is utilized and the effect is subtracted from E0. In summary, the goal of PK/PD modeling is aid the appropriate clinical trial design for a drug.
