3
Value Averaging
This chapter presents a fairly new and simple accumulation strategy, which I call
value averaging,
1 an alternative approach to investing your money. You may find it useful because it is similar to dollar cost averaging but generally provides a higher rate of return in a long-term investment program.
VALUE AVERAGING: AN INTRODUCTION
Value averaging (VA) is a formula strategy that is more flexible and has a lower average per-share purchase price (and usually a higher rate of return) than dollar cost averaging. Instead of a “fixed dollar” rule as with dollar cost averaging (“buy $100 more stock each month”), the rule under value averaging is to
make the value of your stock holdings go up by $100 (
or some other amount)
each month. This is a very simple version of the strategy, to be enhanced later, but the focus on
resulting value instead of on
investment cost is the main point. Look at
Table 3-1 which shows the same mutual fund prices and investment period that comprised the DCA example in
Table 2-1 (page 27).
The example in
Table 3-1 shows a value averaging strategy following the rule of making the investment value go up by $100 every month. At the beginning of January 1986, you owned $0 worth of stock, so you had to buy $100 worth of stock (at $4.64) to get 21.55 shares worth $100. Next month, February 1986, the rule says to make the value of your holdings go up by $100 (from $100 to $200), so you must own $200 in stock after your February purchase. Because the new price is $4.38, this means you must own 45.66 shares at $4.38 to make the value $200. You already own 21.55 shares from January. Thus, you must purchase 24.11 more shares at $4.38, or buy $105.60 worth of shares in February (as shown on the second row of the table). Note that when the share price goes down, as it did here, you will have to spend
more than $100 to “replace” the lost value. But when the share price goes up, you will have to spend
less than $100, because capital gains have provided some of your “required” increase in value. This occurs in the next month, March 1986. Due to the rise in share price from $4.38 to $4.56, you would need to invest only $91.78 that month to have your holdings increase by $100 (due to $8.22 of capital gains).

At first glance, the VA strategy may not seem too different from dollar cost averaging, but a look at August 1986 in
Table 3-1 reveals one major difference using value averaging: A large upward price swing often results in a
sale of stock, instead of a purchase. The entire increase in value “dictated” for one month by the value averaging rule could be provided solely by an increase in your portfolio value, given a large enough price rise; then you wouldn’t need to provide any additional investment. In the example, after July 1986, you held $700 of stock and needed to increase that value to $800 in August (this row has been italicized in the table). But as a result of the share price increase from $2.99 to $3.60 over that time, your $700 worth of stock was then worth $842.81. You are now $42.81 ahead of your $800 goal, so you get to skim off the extra money by
selling 11.89 shares ($42.81 worth) that month. Supposedly you would put that money aside—perhaps in a money market fund—to be invested in a later month when the market dips, such as October 1986 in the example above.
Following the value averaging strategy down the rest of the 24-month period, you can see that you would sell shares 8 out of 24 times to keep the value of your holdings increasing at a preset $100/month rate. Value averaging resulted in a net average cost per share of only $4.07 over this period,
2 much lower than the average share cost of $4.85 with dollar cost averaging and the $5.18 average fund price over the period. With value averaging, this occurs because we are not just “buying low,” as with dollar cost averaging; we are buying even more than usual when the share price moves exceptionally low. Of course,
low is defined only relative to the prior period’s price. There is certainly no guarantee that this so-called low price will be truly low in any absolute sense, or even relative to future prices.
Also, there is often a tendency with value averaging to sell shares when the share price is high; the best a dollar cost averaging strategy can do is to buy fewer of these expensive shares.
Whereas dollar cost averaging earned you a 4.0% average annual return on your investment over the period, value averaging returned a whopping 20.1 % annual return on the same fund over the same time period. Not bad, considering that the final share price ($5.06 versus $4.64) ended up at roughly the same level at which it had started.
Analysis of the above example was extended another 25 months using fund price data through February 1990. The monthly figures are not shown here due to space considerations, but the results are interesting. The final share price on February 15, 1990, was $5.01—still in the same general range as it had been both two and four years earlier. The investment returns still varied widely, even over this longer period: By buying a share per month (CS), the annualized rate of return over the four years was +3.9%; dollar cost averaging improved your return to +6.8%; but value averaging more than doubled that return, yielding an IRR of +13.8%.
The value averaging strategy did quite well with this rather flat
3 but volatile fund. The strategy takes a more extreme response to market dips and rises than does dollar cost averaging. These large responses are not without their problems, as will be discussed in later chapters. Here, though, the return was enhanced greatly by the large purchases at low prices and by the profit taking as shares were sold at generally high prices.
The occasional selling indicated by value averaging rules is probably the single most interesting characteristic of the strategy. Even though neither VA—nor any other strategy—can time market peaks, it still has an interesting timing characteristic. You will sell (or buy far fewer than normal) shares at a market peak because, after all, the price must have gone up to have resulted in a market peak. The converse is true with buying more than normal as the market hits its nadir. If you follow its prescription, value averaging forces you to avoid big moves into a peaked market or panic selling at the bottom. That by itself is pretty tasty medicine. Of course, there are problems with selling into a consistent bull market. There can also be tax complications and transaction costs when you sell (these and other complicating issues are covered in Chapter 6). Still, the selling feature is a flexible and potentially useful and rewarding addition to your investment arsenal, particularly because there’s so little guidance out there on when to sell, and so little natural tendency to do it after the market has had a good healthy run up.
SHORT-TERM PERFORMANCE
An analysis using historical market data will be shown here, comparing value averaging to dollar cost averaging in a manner that parallels the previous chapter. Both dollar cost averaging and value averaging are used with monthly frequency over the same (one-year or five-year) market period, and the rates of return (IRR) resulting from the two strategies are compared for each period. Value averaging usually provides the highest returns in the stock market over short- and intermediate-term investment periods.
In
Table 3-2, the rates of return from using the two strategies are compared for each year of actual stock market history (1926-1991). With dollar cost averaging, $100 is invested at the beginning of each month,
4 and the portfolio is valued on the last day of the year, after 12 equal monthly investments. With value averaging, whatever investment (or sale) necessary is made to keep the value increasing at a steady $100 per month until the $1,200 value goal at the beginning of December; final valuation is made at the December 31 market price.
Rate of Return Over 1-Year Periods
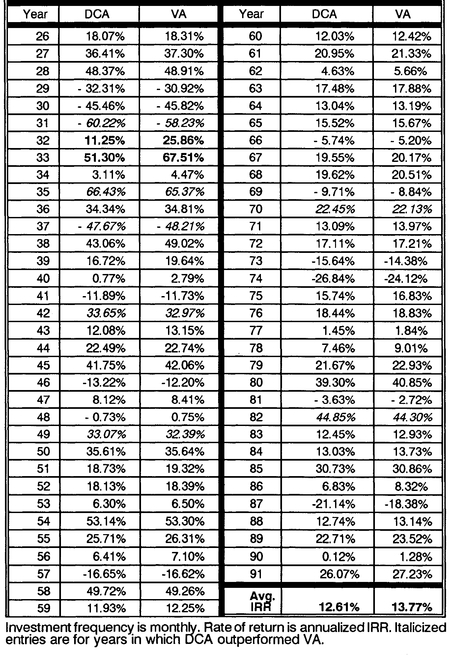
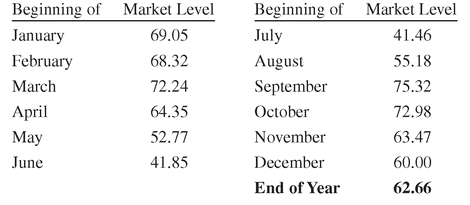
Value averaging had a higher return for 58 of the 66 years analyzed, losing only 8 times. When VA “won,” it provided relative returns as much as 16.21 percentage points higher than DCA (in 1933) and averaged 1.24 higher when it won. When VA “lost,” its relative returns were never more than −1.06 percentage points lower than DCA (in 1935); the average VA return was only .58% lower than DCA on those few occasions that it lost. Over all 66 years, dollar cost averaging returned an average 12.61%, but value averaging returned an average 13.77%, +1.16% higher. The possible relative gains of the VA strategy seem quite high in both frequency and magnitude, and they compare quite favorably with the risks (relative to DCA). This is especially highlighted by the results for 1932 when the stock market was actually down over 9% from the beginning to the end of that year. The CS strategy had a rate of return of +3.73%, DCA returned +11.25%, and VA returned +25.86% during this bad market year. Monthly figures for 1932 are provided here for the interested reader. The market level is relative to an index of December 31, 1925 = 100, with all dividend returns included in the market value index.
Monthly Market Level Figures for 1932
The rates of return from using the two strategies for possible (overlapping) 5-year periods of actual stock market history (1926-1930 through 1987-1991) were compared but are not shown here in a full table. Of the 62 possible periods, value averaging had a higher return in 52 of them. The average annualized rate of return with DCA was 10.20%, whereas value averaging returned a 1.13% higher annual average of 11.33%.
Following a “pure” value averaging strategy yields five-year results that are a bit more spotty than one-year results. This begins to highlight a potential problem with the naive rule of making your value go up by the same amount every month over longer investment periods. At first that $100 amount is a large increase, but over time it becomes a drop in the bucket. This problem and a simple solution will be discussed in the next section on long-term performance, along with an extended presentation in Chapter 5 of how to set up your “value paths.”
With the investment features of more exaggerated buying and the opportunity for selling, value averaging gives you a great chance at enhancing your investment rate of return over shortand medium-term investment periods. Some points brought out in the previous chapter on dollar cost averaging bear mentioning again with respect to our newfound strategy as well. In many years, the strategy used plays very little role in your overall return, compared with your investment’s performance. That is, a bad year is a bad year even with value averaging (with limited exceptions, such as 1932). The investment vehicle you choose is far more important to your results than the mechanical rules you follow to invest in it. To that end, it is best to use value averaging with very diversified investments, such as a broad-based mutual fund or, preferably, an index fund. These issues and many more of the minor complexities of value averaging will be highlighted in later chapters.
LONG-TERM PERFORMANCE AND VALUE AVERAGING
Value averaging seems to profit from the peaks and valleys in the market geography. You might suspect that value averaging would perform well over longer investment periods. It can, but not in the “pure” version described above. Value averaging, like its counterpart DCA, fails to take market growth into account in its “linear value path” (adding the
same amount to value every month). This causes value averaging to fail to keep up with the market and will seriously reduce your investments’ total market exposure over long periods. This is contrary to the goal of an accumulation strategy. Suppose you had started three formula plans: a constant share purchase strategy, which is the base case; dollar cost averaging; and value averaging. Suppose further that you started each by investing $1 in January 1926
5 and continued monthly until 1991. You have already seen the figures for the CS and DCA strategies in the previous chapter; now, in the following sections, they are compared with value averaging in tabular format.
Linear, or Fixed-Dollar, Strategies
Table 3-3a shows the results of using the strategies in their purest (and most naive) form. The “fixed-amount” rules are taken literally over the 66-year period. Monthly investment under dollar cost averaging is a fixed $1 per month. The value goal under value averaging is strictly linear, with the “required” value increasing by $1 every month. VA performs poorly here, returning only 10.80% compounded annually over the period.
No Growth for DCA and VA-“Fixed-Amount” fiules

As discussed in the previous chapter, the fixed-amount rules just don’t make any sense over a long investment period, due to inflation and to extensive growth in the level of value of the stock market. With dollar cost averaging, the problem was simply that the fixed amount invested buys less and less of the market over time, so that the monthly additions eventually become insignificant. The problem with so-called pure or fixed value averaging is more complex. With a CS strategy, where your investment grows with the market, both your incremental investment (new money) and the value of your previous holdings (old money) are “keeping up,” or moving with the market. With a fixed DCA strategy, your $1 incremental investment (new money) becomes insignificant, but at least the value of previously purchased shares (old money) keeps up with the market, as you never sell any of them. But with a fixed value averaging strategy, both the investment increment and the value, which is on a predetermined linear path, will become insignificant over time. Because “old” shares are not left alone (but are subject to being sold under the VA strategy), neither the old nor new money keeps up with the market with VA.
For example, the monthly $1 increase in value results in a portfolio value of only $792 after 66 years. The CS portfolio weighed in at over $422,000 at the same time. Admittedly, much more money was poured into the richer CS strategy, and with value averaging you would actually have taken out substantially more money than you put in.
6 Still, you can see that the fixed, linear, “pure” VA strategy totally loses touch with the reality of sizable increases compounded over time in the market, when viewed in the long run. The $1-a-month increase in value is meaningful at first but becomes insignificant rather quickly. In fact, as market levels rise over time, VA actually acts to consistently move you
out of the market, as opposed to accumulating shares in it. It would take less than a decade for this reversal to happen.
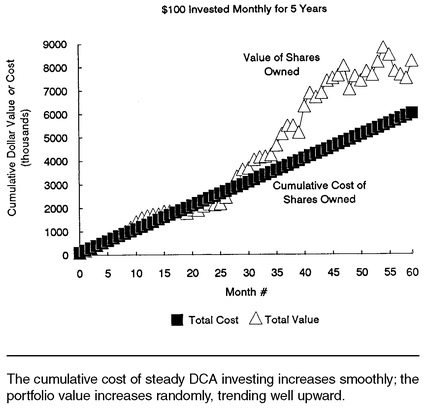
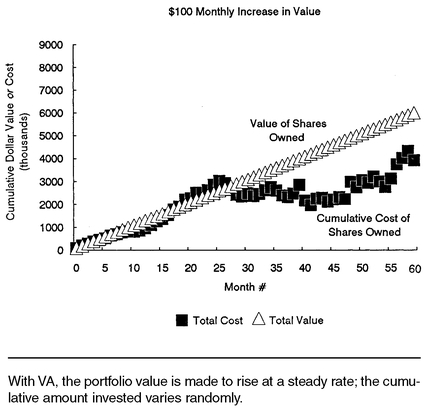
Perhaps it is helpful to see graphically the conceptual difference between the dollar cost averaging and value averaging strategies, as shown in
Figures 3-1 and
3-2. Each figure shows both the cumulative amount of money invested, and the value of the total portfolio, at each point in time for the given strategy over a five-year period.
7 Figure 3-1 shows the results of dollar cost averaging;
Figure 3-2 shows value averaging. The amount of money put into a DCA strategy (the cumulative cost of shares) goes up smoothly by the fixed amount. The resulting shares increase in value as they accumulate and as the price level of the market rises. Value averaging, on the other hand, does much the opposite in that we force the value of the shares to go up smoothly by the fixed amount. The total amount of money invested in VA (the cumulative cost) then varies randomly, going up when shares need to be purchased, going up a lot when the market is down, and going down if the market increases enough to dictate a sale of shares. Note that with value averaging, there is generally less money invested and a lower final value, as the linear “value path” does not keep pace with the tendency for the stock market (and thus, your own holdings) to grow.
A related problem with value averaging can also be seen in
Figure 3-2. The $100-a-month increase in the value goal means a lot when you’re just getting started, but later (after some stock is accumulated) it results in very little need for net investment. In the first few months of the accumulation, note how the need for investment (the increase in the “cumulative cost of shares”) is close to the desired increase in value. When you don’t have many shares yet, almost all of your desired value increase must be new investment; there’s just not much action coming from your existing shares. Later on in the accumulation plan, however, you will have built a portfolio that tends to increase in value. By then, much of the $100 increase in value will be provided by the shares already on hand, leaving you little need, on average, for net investment. Eventually, the expected (average) increase in your market holdings will far exceed $100 a month,
89 causing you to
decumulate shares gradually, putting the brakes on your portfolio growth to stay in line with your slow-moving value goal. Most likely, this is
not what you want to happen.
Adjusting Strategies for Growth
One possible way to attack this problem is to adjust the value path for inflation. As an example, take a $1,000 “pure” value averaging portfolio after 10 months of $100 value increases. If inflation was one-half percent per month, we could adjust the next month’s value goal for inflation. First, take the $1,000 value and give it “growing room” at the inflation rate, to $1,005. Then, the $100 value increment we started out with also could be adjusted for inflation, to $100.50. The next month’s value goal could be preset at $1,105.50 instead of just $1,100. Instead of $1,200, the next month’s goal would be a value of $1,212.03. The effect compounds over time.
We tried this type of inflation adjustment with value averaging, using the same inflation numbers as with dollar cost averaging in the previous chapter. The results of inflation adjusting the DCA and VA strategies, shown in
Table 3-3b, are only marginally better than for the unadjusted “pure” strategies. The inflation-adjusted strategies still provide no advantage.
Inflation Growth Only for DCA and VA
The reason for this disappointing performance has been mentioned a few times before. Even when the value path is adjusted for inflation, the final value with VA is only $8,220 (versus more than $422,000 for CS)—almost no market exposure after 66 years of accumulation. If you expect your investments to outperform inflation (which they had better in the long run), and you set a value path at the inflation rate, then you will actually end up less and less invested in the market over a long period. Your value path will simply fall way behind market growth.
Next, we turn to what would happen if you allowed for sufficient compounding growth in the value path to accumulate the same market exposure with VA as with the CS strategy over the same period. We did this in the previous chapter for DCA and called the adjustment
growth equalization. The growth-equalized analysis of value averaging is displayed in
Table 3-3c.
Some amount of compound growth in the value path, larger than the inflation adjustment, could result in enough money invested through value averaging for that strategy to be comparable to the CS and growth-equalized DCA strategies.
DCA and VA, Growth-Equalized
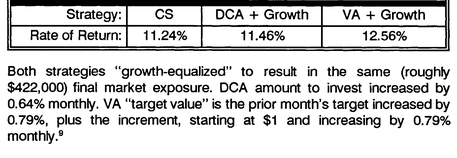
Had you adjusted the add-$1-a-month-to-value rule by 0.79% each month (a 9.90% annualized growth rate), you would have ended up with a value goal, and a portfolio value, of about $420,000 by 1991, about the same as with the CS and the growth-equalized DCA strategies. The rate of return on this growth-equalized value averaging strategy would have jumped to 12.56%, much higher than the rate of return from any variation of any strategy we’ve seen so far.
The main lesson to be repeated here is that the investment formula must somehow keep up with the phenomenal growth in the market over long-term investment periods.
This will be even more true with value averaging, as you will see in the next few chapters. Exactly how to integrate this information into your investment plan with both formula strategies will be covered in Chapters 4 and 5.
SUMMARY
Value averaging has been presented as an alternative method of accumulating market wealth over time. By focusing on a predetermined value goal that increases over time, you take the dollar cost averaging philosophy of “buy more cheap shares” a step further. Returns are generally higher with value averaging, and there is not much downside return risk relative to dollar cost averaging. The features of value averaging make it more flexible but also more complicated than dollar cost averaging. With any of these strategies—but with value averaging in particular—you must be particularly sensitive to keeping pace with long-term market growth to maintain a reasonable market exposure. In the next few chapters, some complications of the value averaging strategies (and of dollar cost averaging) will be discussed, along with an analysis of some recommended ways to use the strategies effectively.
ENDNOTES
1 The value averaging technique was originally presented in my article, “Value Averaging: A New Approach to Accumulation,”
AAII Journal X, no. 7 (August 1988), 11-14.
2 This “net cost” figure is perhaps not the most accurate way to report the average cost of shares in the value averaging strategy, because there are both purchases and sales which confound the accounting. Using the standard “average share” method of accounting for mutual funds, the gross shares purchased break down as follows:
• 215.3 shares, with an average cost basis of $4.26, sold at an average sales price of $6.11;
• 413.79 shares, with an average cost basis of $5.03, remaining at the end of the period.
The $4.03 “net average cost” figure comes from netting out sales—the net amount invested (deducting sales profits), divided by the number of remaining shares (net of sales), comes out to $4.03. But a more common way of tracking the average cost of all shares purchased is to just take the weighted average of the quantities above, yielding a gross average purchase price of $4.77 per share. It is still (and must always be) cheaper than with dollar cost averaging. (My thanks to Glenn S. Daily, author of Low-Load Insurance Products, International Publishing Corporation, for pointing this out.)
3 To be fair to the fund in question, it is again noted that this analysis totally leaves out some fairly sizable dividends; also, precious metals funds on average have a much lower expected return than diversified stock funds.
4 Again, it is noted that the investment is made on the last day of the prior month.
5 Recall that the price index for stock market value used in this book is based on a “price” of $1 for the beginning of 1926, growing to almost $534 by the end of 1991.
6 Of course, the IRR calculations take the size and timing of the inflows and outflows into account; in spite of the sizable outflows with the VA strategy, CS still has a higher return by 0.44%.
7 The underlying “stock” is a typical random simulation of monthly market price data. The simulation process itself is not important here, but is described in detail in Chapter 7.
8 Using a range of historical and expected returns on the market as discussed in Chapter 1, you could expect this phenomenon to start happening after about 6-10 years, on average.
9 The 0.64% growth factor for DCA was explained in Chapter 2. The 0.79% growth factor for the VA value path happens to be the right amount of growth to maintain a sufficient market exposure so that value averaging is “as invested in” the market as the other two strategies. Although this figure cannot be ascertained exactly for future periods, a reasonable estimate can be used for your own purposes, as will be explained in the next two chapters.
2006 NOTE
Does value averaging still work?
Table 3-3a showed the long-run return advantage of VA over DCA was an extra 1.10 percentage points annually through 1991. With the intervening 14 years, we saw the roaring nineties’ bull market and survived the tech meltdown at the beginning of the century, ending up with the solid recovery into 2005.
Taking the 1926-1991 strategy forward through 2005, the evidence of VA’s return enhancement is even stronger. Now VA outperforms by 1.22 points, a return differential over 10% higher than the original book. Please see
Table 3-3d.
DCA and VA, Growth-Equalized
Both strategies are growth-equalized to result in the same (roughly $2 million) final market exposure. DCA amount to invest increased by 0.68% monthly. VA “target value” is the prior month’s target increased by 0.80%, plus the increment starting at $1 and increasing by 0.80% monthly.
We can also examine the strategies in their modern setting only, looking at just these two recent decades. Please see
Table 3-3e. Applying the formulas monthly for 16 years from 1990 to 2005, the VA returns are highest yet again (but by a lower margin than in the long-run study).
DCA and VA, Growth-Equalized


