Chapter 6

LTE-M performance

Abstract

This chapter presents LTE-M performance in terms of coverage, data rate, latency, and system capacity based on the functionality described in Chapter 5. The presented performance evaluations are largely following the International Mobile Telecommunication 2020 (IMT-2020) and 5G evaluation frame work defined by the International Telecommunications Union Radiocommunication sector (ITU-R) and 3GPP, respectively. It is shown that LTE-M in all aspects meets the massive machine-type communications (mMTC) part of the requirements defined by ITU-R and 3GPP. The reduction in device complexity achieved by LTE-M compared to higher LTE device categories is also presented. While LTE-M has been specified for half-duplex frequency-division duplexing (HD-FDD), full-duplex FDD (FD-FDD) and time-division duplexing (TDD) operation, this chapter focuses on the performance achievable for LTE-M HD-FDD.

Keywords

5G; Battery life; Capacity; Coverage; Data rate; Device complexity; IMT-2020; Latency; LTE-M; Maximum coupling loss (MCL); Performance; Spectral efficiency; Throughput

6.1. Performance objectives

In Release 15 the International Telecommunications Union Radiocommunication sector (ITU-R) defined the set of International Mobile Telecommunication 2020 (IMT-2020) requirements for enhanced mobile broad band, critical MTC and massive MTC (mMTC). The mMTC objective on connection density required the support of 1,000,0000 devices per km2 [2]. 3GPP reused this objective in its work on 5G and did in addition to this define four more requirements for mMTC [3]:
  1. • A coverage corresponding to a MCL of 164   dB should be supported.
  2. • A sustainable data rate of at least 160 bits per second should be supported at the 164   dB MCL.
  3. • A small data transmission latency of no more than 10   seconds should be supported at the 164   dB MCL.
  4. • A battery-powered device should support small infrequent data transmission during at least 10   years   at the 164   dB MCL.
These requirements are recognizable from the initial work on EC-GSM-IoT and NB-IoT carried out in the 3GPP Release 13 study item Cellular system support for ultra-low complexity and low throughput Internet of Things [4], in this book referred to as the Cellular IoT study item. While the 5G performance objectives match the requirements defined for EC-GSM-IoT and NB-IoT, the evaluation assumptions defined for 5G and those used in the Cellular IoT study item differ somewhat. Sections 2.3 and 2.4 in further detail discuss the Cellular IoT study, IMT-2020 and 5G.
This chapter presents the expected LTE-M half-duplex frequency-division duplexing (HD-FDD) performance for each of the 5G performance objectives. It is shown that LTE-M in all aspects meets the massive MTC part of the requirements defined by ITU-R and 3GPP.

6.2. Coverage

3GPP defines coverage in terms of MCL, which between two communicating nodes specifies the maximum tolerable signal attenuation between the transmitting and the receiving node's antenna ports. The MCL is a function of the transmitted output power (P TX ), the supported signal to noise ratio (SNR), the signal bandwidth (BW) and the receiver noise figure (NF):
M C L = P T X ( S N R + 10 log 10 ( k · T · B W ) + N F )
image (6.1)
To evaluate the coverage of LTE-M the performance of all supported physical signals and channels was evaluated according to the simulation assumptions presented in Table 6.1. The tapped delay line (TDL) channel model is based on Rayleigh fading taps with a 2-Hz Doppler spread and a root mean square delay spread of 363   ns. This is short compared to the LTE-M cyclic prefix and does not challenge the orthogonality of the modulated OFDM subcarriers. The base station is assumed to map the modulated signal to 2 transmit antenna ports and make use of transmission mode 2 for the PBCH, MPDCCH and PDSCH. When evaluating the PSS and SSS synchronization performance the signal is mapped over 4 antenna ports. This extra space diversity has proven to be beneficial for the synchronization performance. The evaluated LTE-M narrowband (NB) is assumed to be transmitted within a 10-MHz LTE carrier configured with a total output power of 46   dBm. This results in 29   dBm per physical resource blocks (PRB) or 36.8   dBm per narrowband. To improve the initial cell acquisition time a 3-dB power boosting is applied to the PSS, SSS and PBCH transmissions.
The base station receiver is associated with 4-way receive diversity and a NF of 5   dB. The device uses 23   dBm output power and a single transmit and single receive branch. It supports a NF of 7   dB. Both the base station and device models the use of realistic receiver implementations.
Table 6.2 presents the LTE-M coverage for a block error rate (BLER) of at most 1% on the physical control channels, i.e. the PRACH, PUCCH and MPDCCH, 10% BLER for the initial hybrid automatic repeat request (HARQ) transmission on the physical data channels, i.e. the PDSCH and PUSCH, and 10% BLER on PSS/SSS and PBCH which are used for synchronization and system information acquisition.

Table 6.1

Assumptions made in the evaluations of LTE-M MCL [5].
Parameter Value
Physical channels and signals
DL: PSS/SSS, PBCH, MPDCCH, PDSCH
UL: PUCCH Format 1a, PRACH Format 0, PUSCH
Frequency band 700   MHz
TDL channel model TDL-iii
Fading Rayleigh
Doppler spread 2   Hz
Device NF 7   dB
Device antenna configuration 1 TX and 1 RX
Device power class 23   dBm
Base station NF 5   dB
Base station antenna configuration 2 or 4 TX and 4 RX
Base station power level
29   dBm per PRB
3   dB power boosting on PSS, SSS and PBCH.

Table 6.2

LTE-M coverage.
Performance/Parameters Downlink coverage Uplink coverage
Physical channel PSS/SSS PBCH MPDCCH PDSCH PRACH PUCCH PUSCH
TBS [bits] 24 18 328 1 712
Bandwidth [kHz] 945 945 1080 1080 1048.75 180 30
Power [dBm] 39.2 39.2 36.8 36.8 23 23 23
NF 7 7 7 7 5 5 5
#TX/#RX 4TX/1RX 2TX/1RX 2TX/1RX 2TX/1RX 1TX/4RX 1TX/4RX 1TX/4RX
Transmission, Acquisition time [ms] 1500   ms 800   ms 256   ms 768   ms 64   ms 64   ms 1536   ms
BLER 10% 10% 1% 2% 1% 1% 2%
SNR [dB] -17.5 -17.5 -20.8 -20.5 -32.9 -26 -16.8
MCL 164 164 164.2 164 164.7 165.5 164

image

The 164   dB MCL is met with the downlink synchronization signals and the PUSCH being the limiting channels with the longest acquisition times. The MPDCCH needs to be configured with 256 repetitions to achieve the 1% BLER target set for the control channel transmission. This is the maximum configurable repetition number, so the MPDCCH coverage is also a limiting factor unless a higher control channel BLER than 1% is acceptable. A certain supported MCL is only meaningful when associated with requirements on the link quality. In the next sections we will see that LTE-M given the performance in Table 6.2 meets the 5G performance requirements for data rate, latency and battery life defined at the 164   dB MCL. If an application can tolerate relaxed performance requirements and can e.g. live with a higher latency than 10   seconds or a shorter battery life than 10 years, then the MCL can be pushed beyond 164   dB.

6.3. Data rate

Table 6.3

LTE-M HD-FDD Cat-M1 and Cat-M2 max TBS.
Device Rel-13 PDSCH Rel-13 PUSCH Rel-14 PDSCH Rel-14 PUSCH
Cat-M1 1000 bits 1000 bits 1000 bits 2984 bits
Cat-M2 4008 bits 6968 bits

image

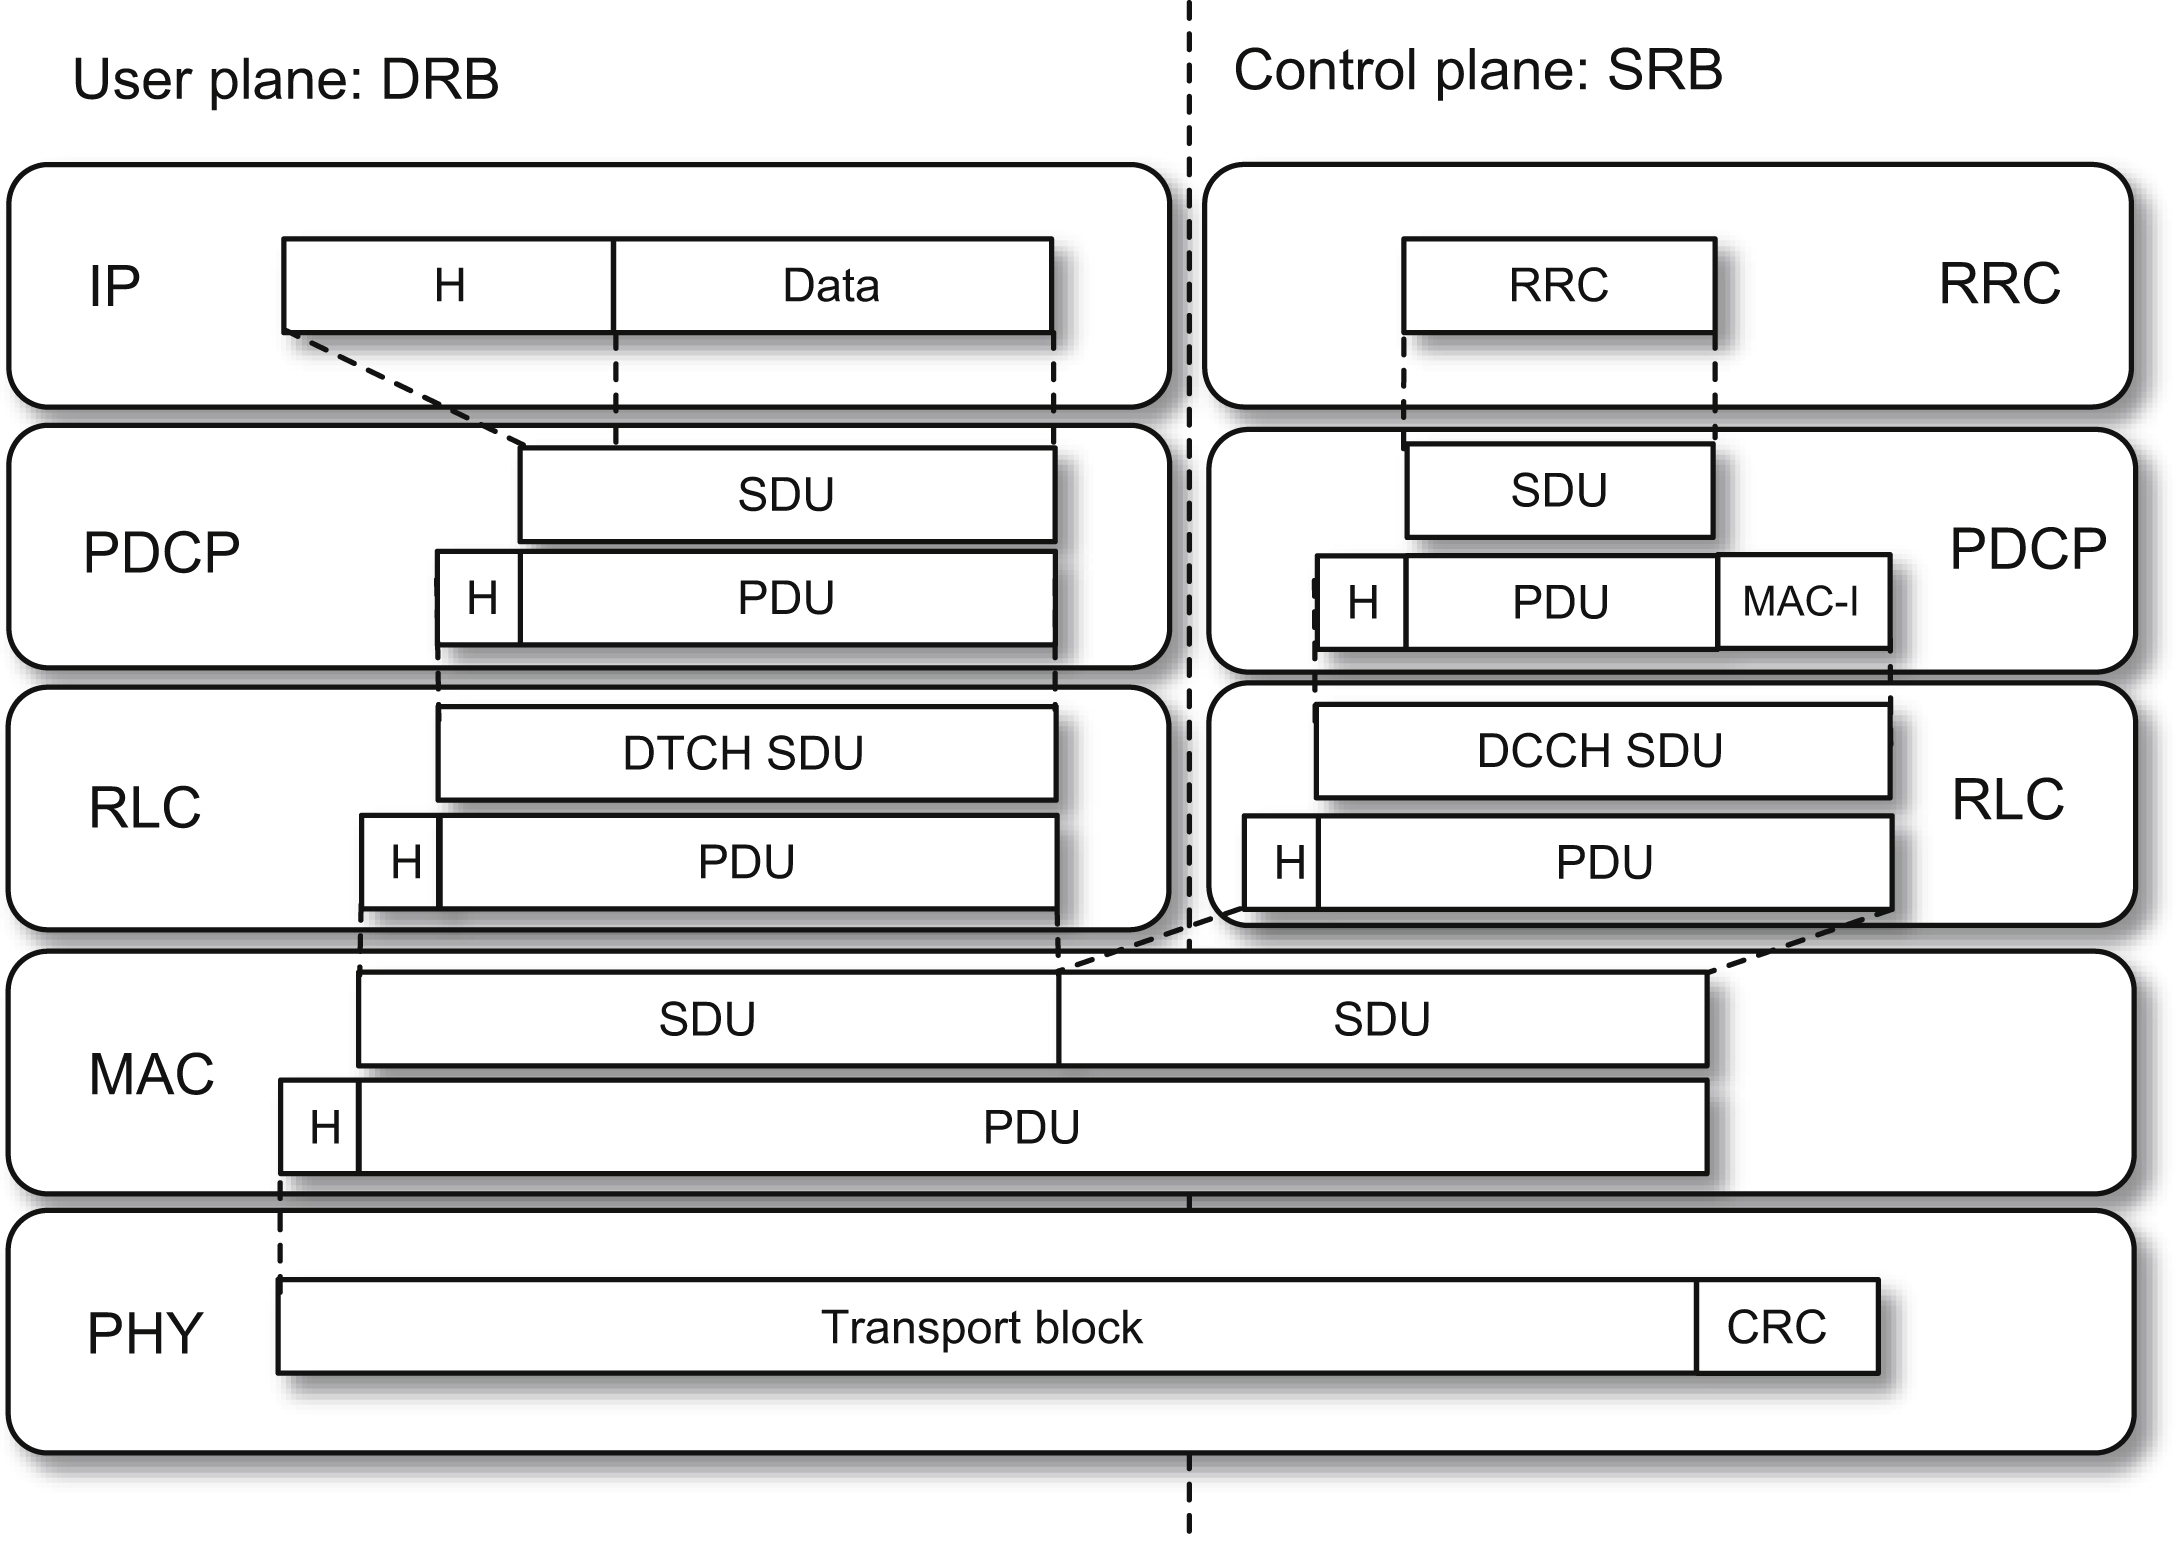
The MAC-layer data rate is used to estimate the sustainable data rate offered by Cat-M1 and Cat-M2 devices. It is defined as the data rate at which MAC protocol data units are delivered to the physical layer. This is a powerful and yet simple metric that corresponds to the data rate offered by the physical layer to the higher layers in the radio protocol stack. It takes all relevant scheduling and processing delays at the access stratum into account and considers all data mapped to a transport block as useful data. To convert this to a sustainable data rate offered to an application provider both the delays and the overhead introduced at PDCP, RLC and MAC must be accounted for. This requires, for example, a detailed model of the RLC service data units segmentation and concatenation into RLC PDUs which is beyond the scope of this book. A good rule of thumb is that the radio protocol stack overhead per transport block sent over the user plane corresponds to roughly 1 byte from PDCP, 2 bytes from RLC and 2 bytes from MAC. Fig. 6.5 presents the data flow through the LTE protocol stack.

6.3.1. Downlink data rate

For Cat-M1 and Cat-M2, downlink physical-layer data rates of 1   Mbps and 4   Mbps, respectively, are achievable.
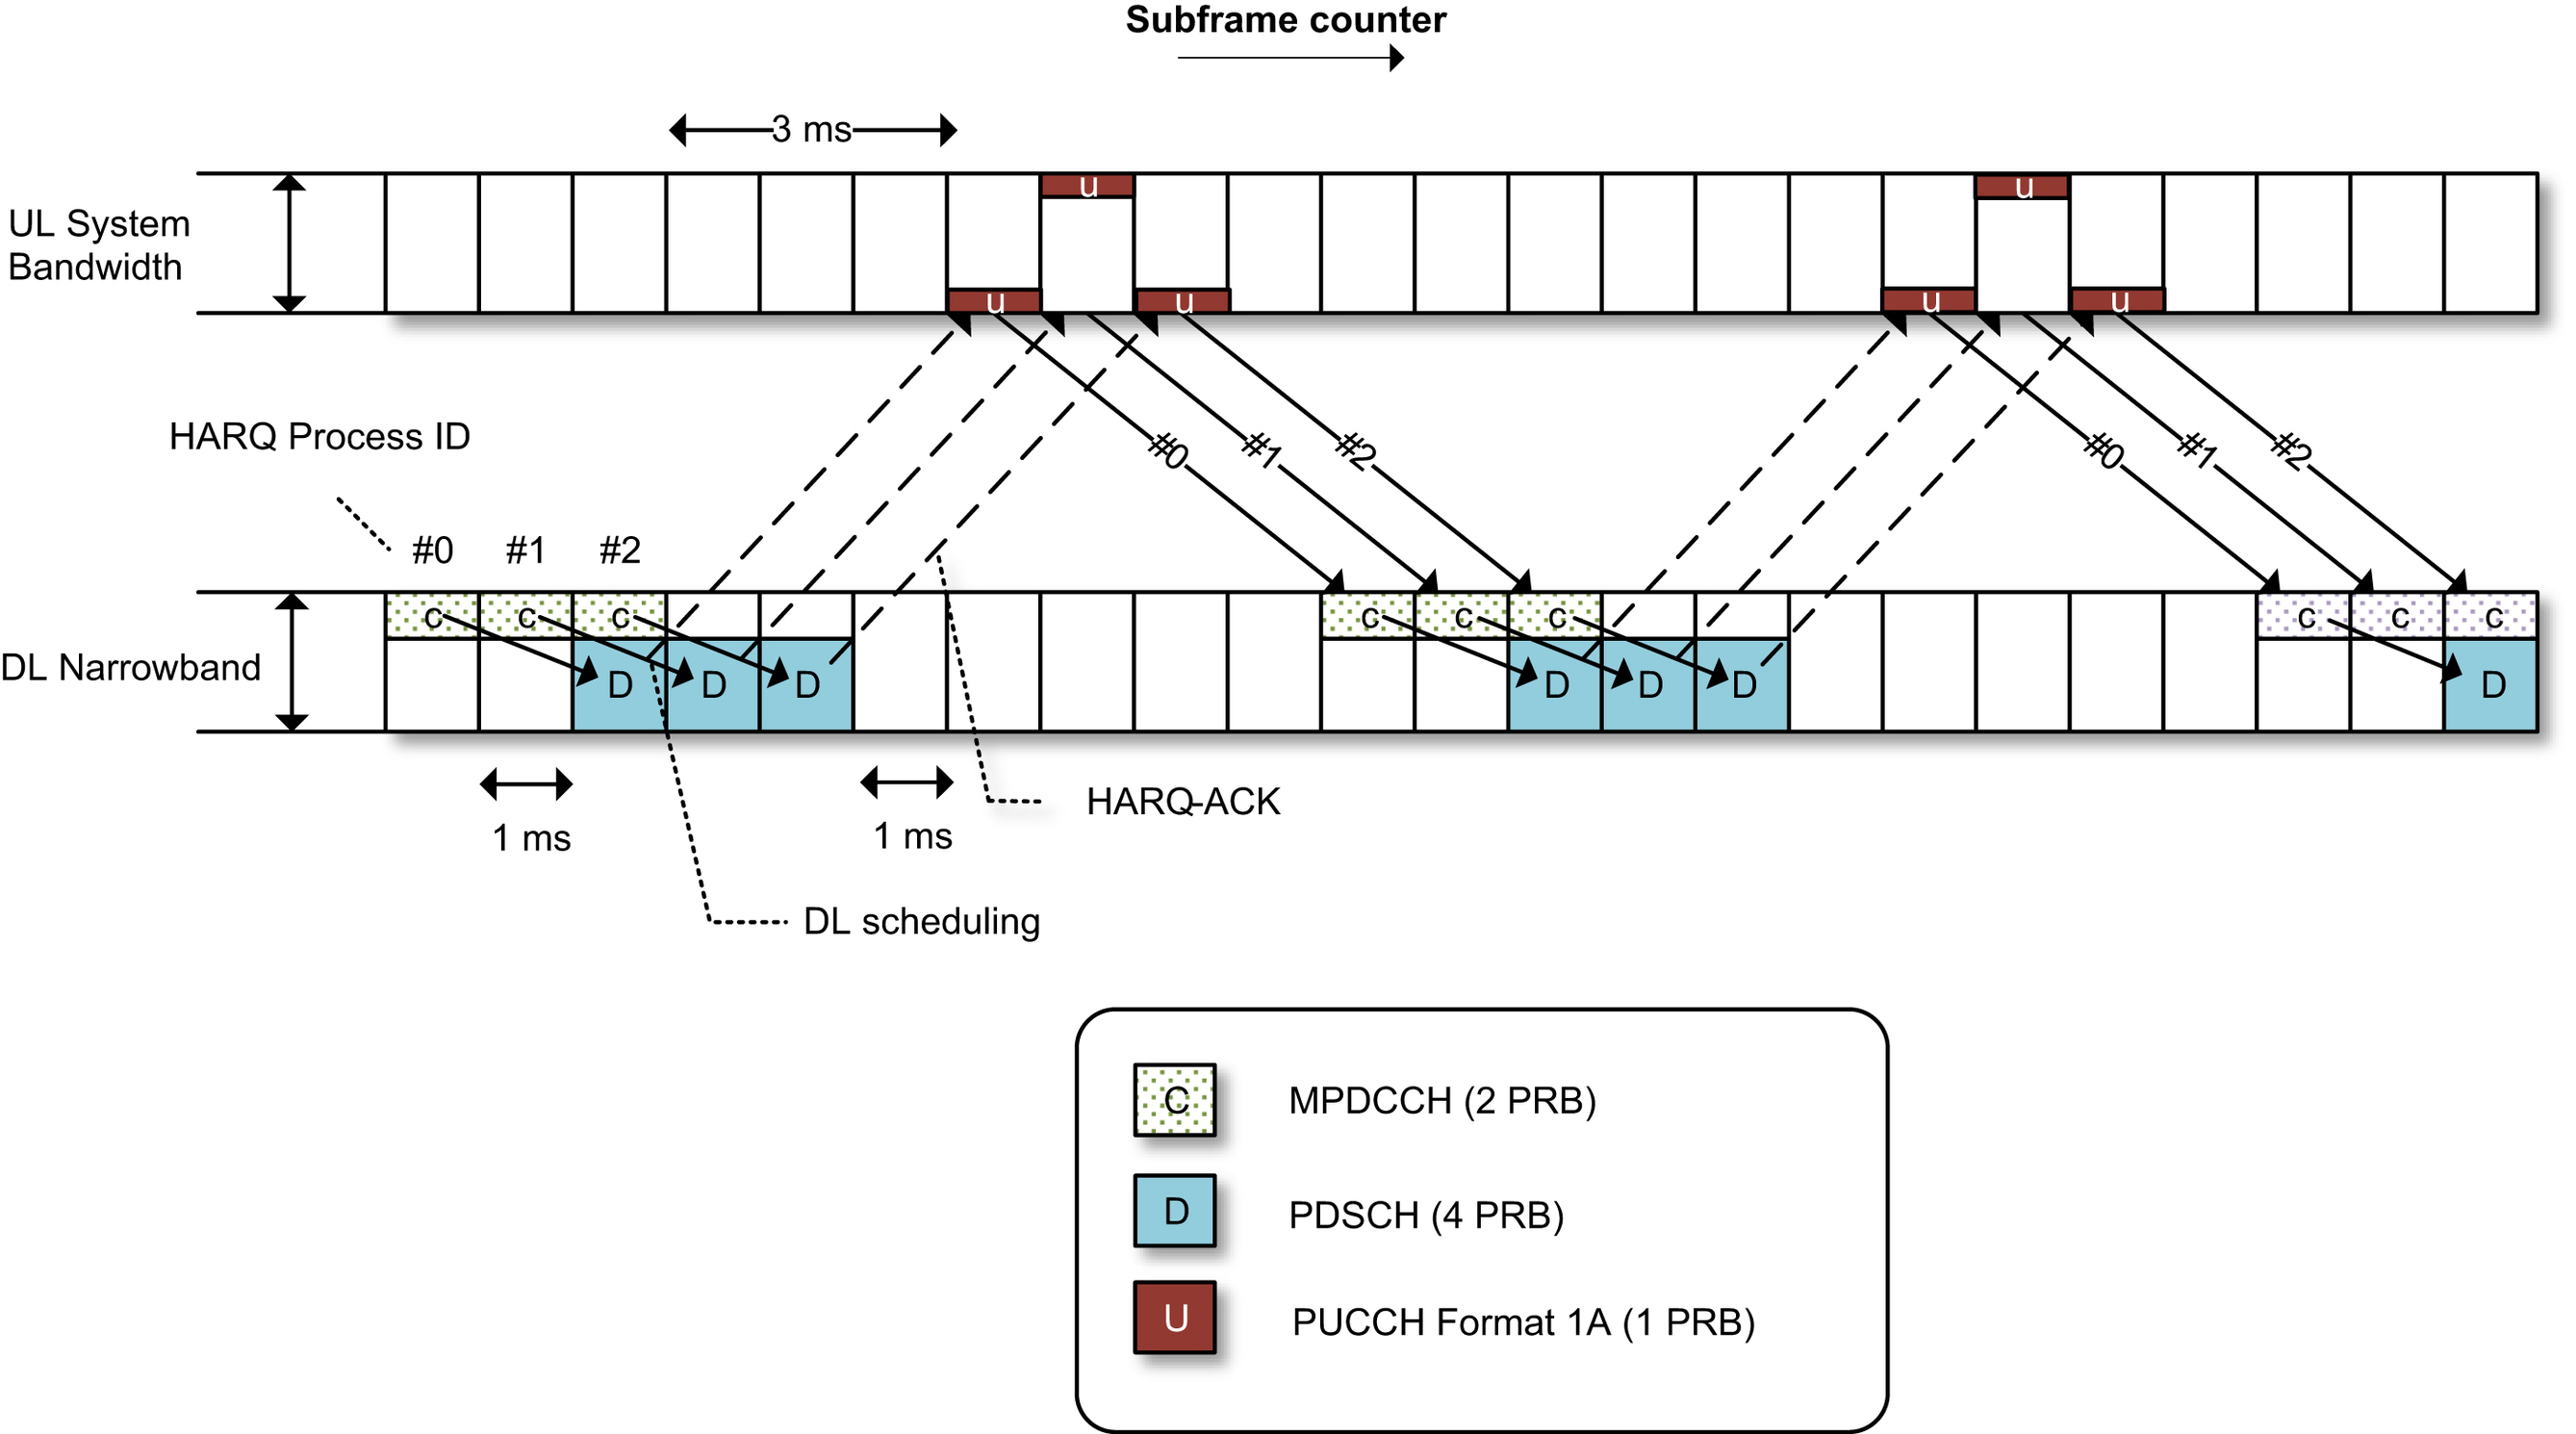
The maximum Cat-M1 downlink MAC-layer data rate, according to the Release 13 design baseline, is achieved when three HARQ processes are scheduled back-to-back as shown in Fig. 6.1. Although LTE-M supports up to eight HARQ processes in FDD in Release 13 the timing restrictions of the technique are such that for half-duplex FDD three HARQ processes gives the maximum PDSCH data rate. In this example, the MPDCCH carrying the downlink control information is mapped to 2 PRBs and schedules the PDSCH, containing the maximum 1000-bit transport block for Cat-M1, over 4 PRBs. Fig. 6.1 illustrates an MPDCCH-to-PDSCH scheduling gap of 1   ms, a downlink-to-uplink switching gap of 1   ms, and a PDSCH-to-PUCCH gap of 3   ms. The PUCCH is transmitted on a single PRB location that is frequency hopping across the system bandwidth. This configuration gives us a scheduling cycle of 10   ms, which leads to a peak MAC-layer throughput of 300   kbps.
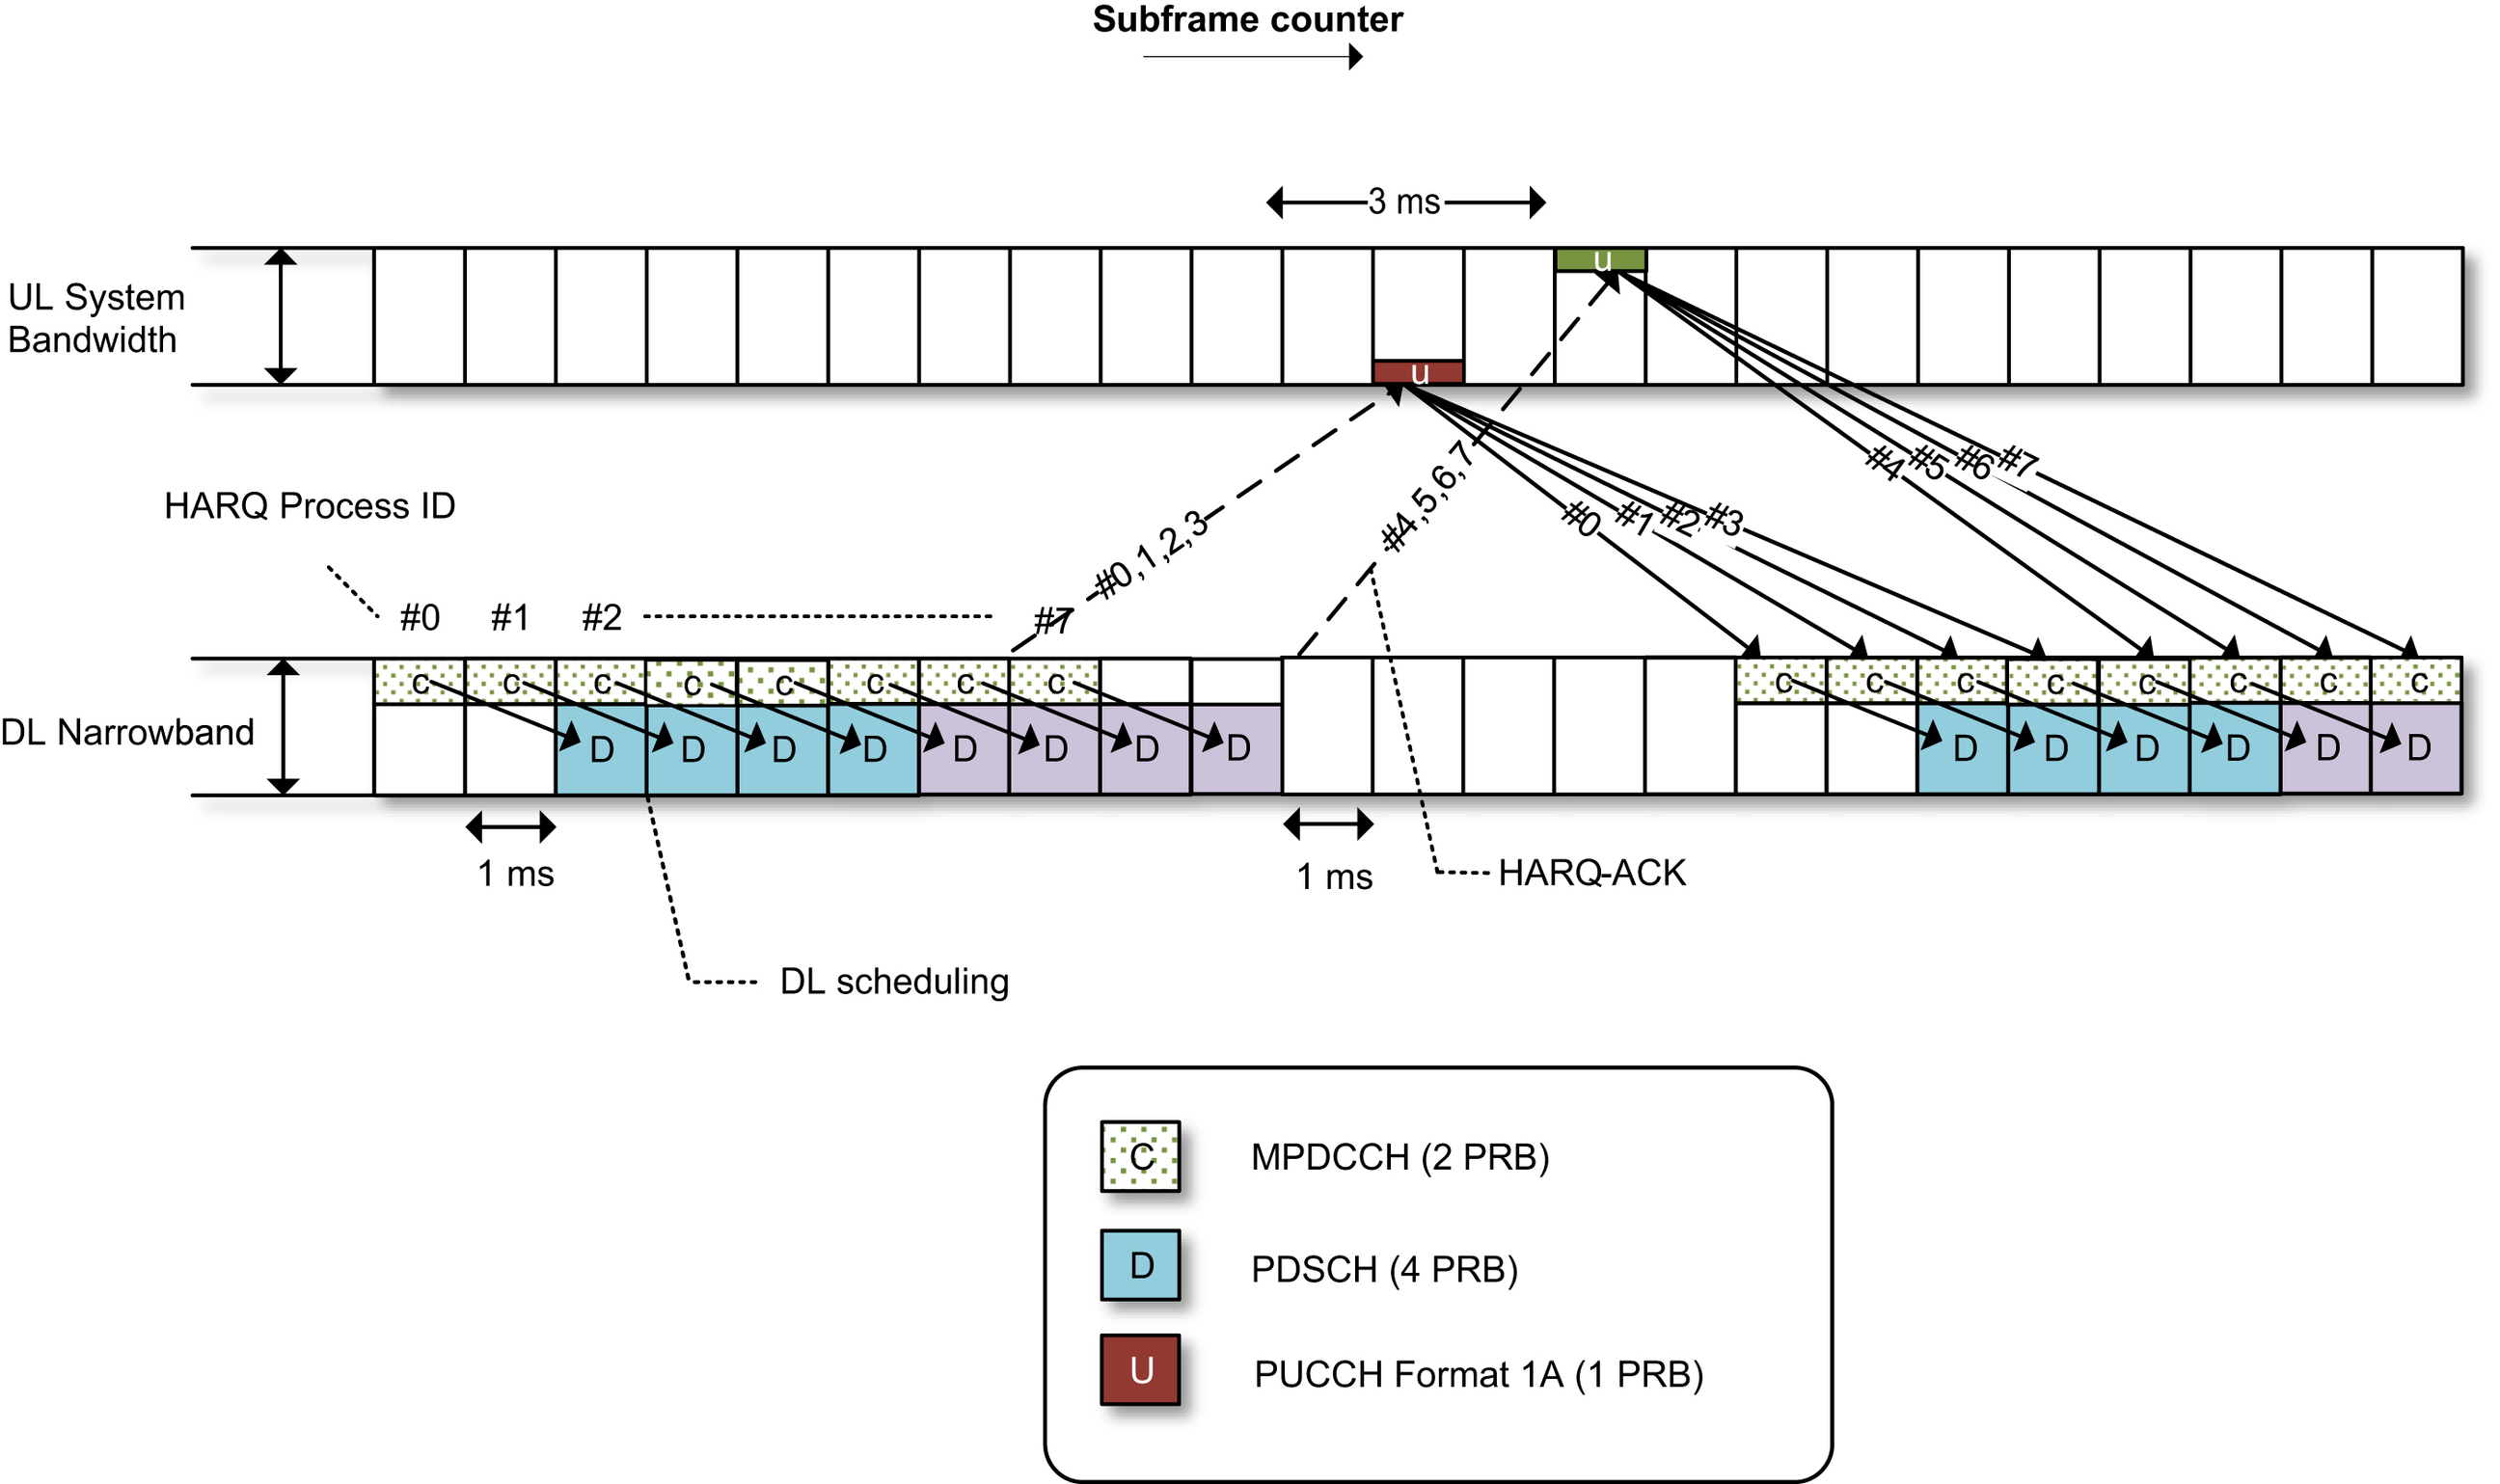
In Release 14 the possibility to bundle feedback from four HARQ processes in one PUCCH Format 1a ACK/NACK transmission is supported. This reduces the PUCCH transmission overhead and allows 8 PDSCH transport blocks to be sent over 15 subframes as shown in Fig. 6.2. This configuration gives Cat-M1 a peak MAC-layer throughput of 533   kbps. Release 14 also introduces support for up to 10 HARQ processes in downlink in FDD, and if this feature is used together with the HARQ bundling, the peak MAC-layer throughput is increased to 588   kbps.
The Cat-M2 maximum MAC-layer data rates are achieved for the same scheduling strategies as used for Cat-M1 in Fig. 6.1 and 6.2. As Cat-M2 supports up to 5   MHz PDSCH bandwidth the system can e.g. assign a PDSCH spanning 15 PRBs, evenly distributed across 3 narrowbands, to carry the maximum transport block of 4008 bits. This gives us a Cat-M2 peak MAC-layer throughput of 1.202   Mbps when not using HARQ bundling, 2.137   Mbps when HARQ bundling is configured, and 2.357   Mbps when both HARQ bundling and 10 HARQ processes are configured.
For Cat-M1 the results presented in Section 6.2 suggest that the following allocations should be considered when estimating the MAC-layer data rate at the MCL:
  1. • MPDCCH using aggregation level 24 and a transmission time of 256   ms
  2. • PDSCH carrying a 328 bits transport block using a transmission time of 768   ms
  3. • PUCCH Format 1a using a transmission time of 64   ms
By configuring the MPDCCH user-specific search space (described in Section 5.3.3.1) with R max = 256 and G = 1.5, it is possible to schedule a PDSCH transmission once every third scheduling cycle, meaning once every 1,152   ms. Given the PDSCH TBS of 328 bits and a 2% PDSCH BLER (see Table 6.2) this gives us a MAC-layer data rate of 279 bps:
T H P = ( 1 B L E R ) · T B S M P D C C H P e r i o d = 0.98 · 328 1.152 = 279 bps
image (6.2)

Table 6.4

LTE-M HD-FDD PDSCH data rates for Cat-M1.
Scenario MAC-layer at 164   dB MCL MAC-layer peak MAC-layer peak for Rel-14 HARQ bundling MAC-layer peak for Rel-14 HARQ bundling and 10 HARQ processes PHY-layer peak
Cat-M1 279 bps 300   kbps 533   kbps 588   kbps 1   Mbps
Cat-M2 > 279 bps 1.202   Mbps 2.137   Mbps 2.357   Mbps 4.008   Mbps

image

Table 6.4 summarizes the Cat-M1 and Cat-M2 PDSCH data rates. Note that the Cat-M2 data rate at the MCL will be at least as good as the Cat-M1 data rate.

6.3.2. Uplink data rate

The maximum uplink physical-layer data rates are 1   Mbps and 7   Mbps for Cat-M1 and Cat-M2, respectively.
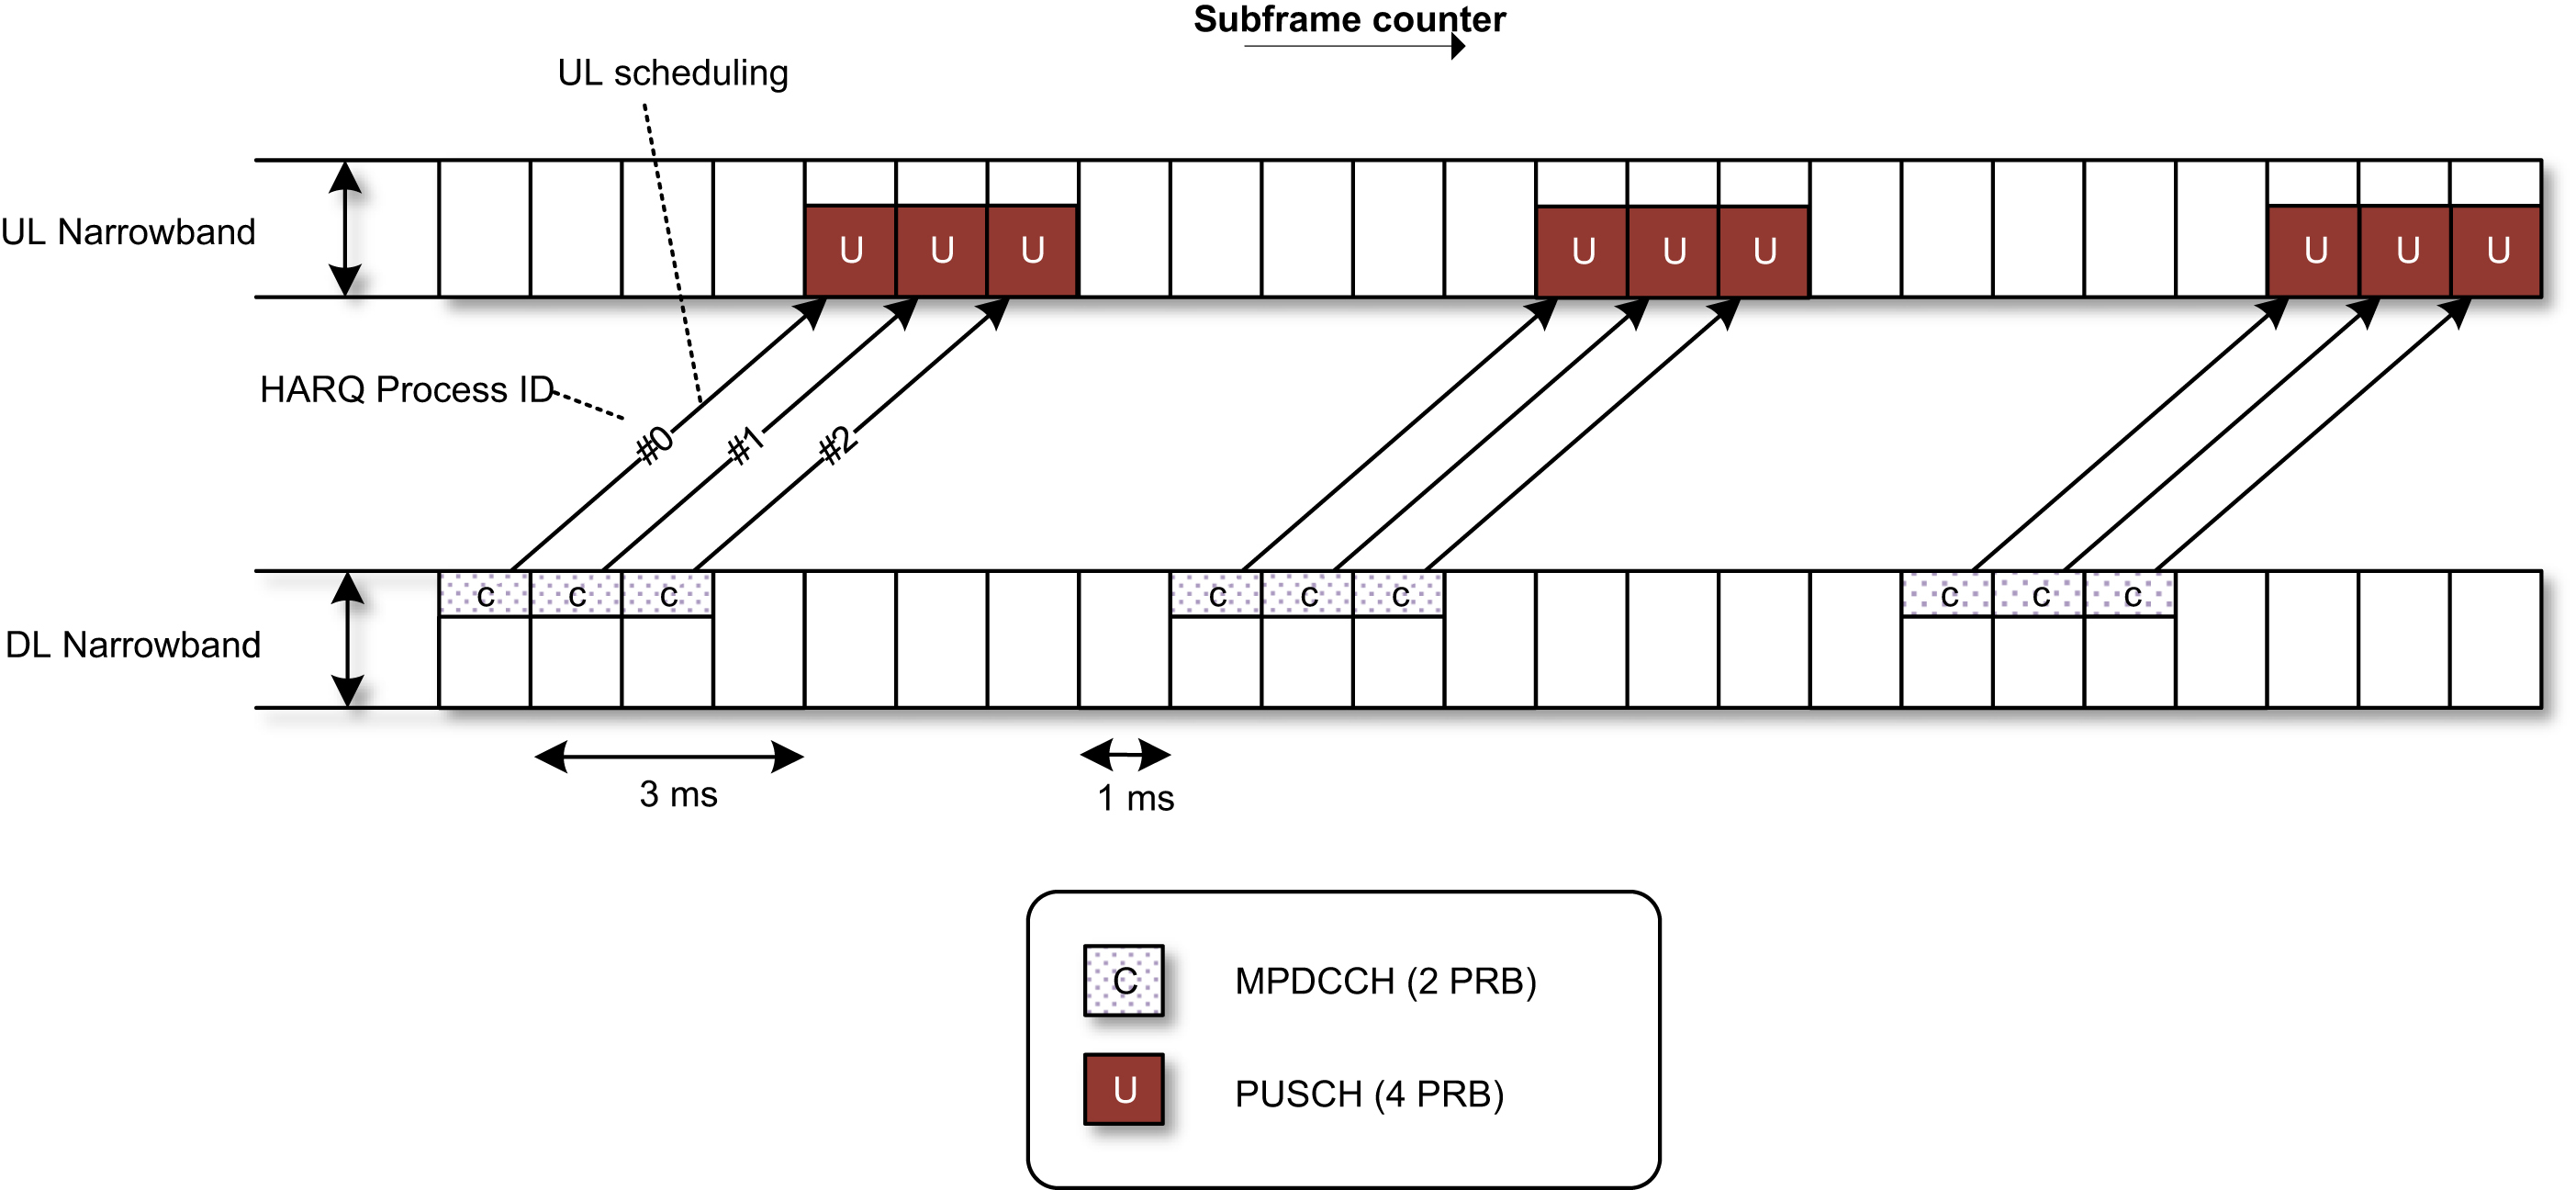
The peak MAC-layer throughputs are reached when three of the eight available HARQ processes are scheduled as shown for Cat-M1 in Fig. 6.3. In the illustrated example, the MPDCCH schedules the PUSCH over 4 PRBs containing the largest Release 13 Cat-M1 transport block of 1000 bits. In Release 14, the Cat-M1 maximum PUSCH TBS was increased to 2984 bits, which is supported for a PUSCH allocation of 6 PRBs. The Cat-M2 maximum TBS is 6968 bits which is available for a 24 PRB PUSCH allocation.
Fig. 6.3 illustrates an MPDCCH-to-PUSCH scheduling gap of 3   ms, and an uplink-to-downlink switching time of 1   ms. This configuration gives us a scheduling cycle of 8   ms, which leads to peak MAC-layer data rates of:
  1. • 375   kbps for Cat-M1 using the Release 13 max TBS.
  2. • 1.119   Mbps for Cat-M1 using the Release 14 max TBS.
  3. • 2.613   Mbps for Cat-M2
Cat-M1 and Cat-M2 offers the same PUSCH performance at the MCL. The results presented in Section 6.2 suggests that the following allocations should be considered when estimating the 164 dB MCL data rate:
  1. • MPDCCH using aggregation level 24 and a transmission time of 256   ms
  2. • PUSCH carrying a 728 bits transport block using a transmission time of 1536   ms
By configuring the MPDCCH user-specific search space (described in Section 5.3.3.1) with R max = 256 and G = 1.5, it is possible to schedule a PUSCH transmission once every fifth scheduling cycle, meaning once every 1,920   ms. Given the PUSCH TBS of 728 bits and a 2% PUSCH BLER (see Table 6.2) this gives us a MAC-layer data rate of 363 bps:
T H P = ( 1 B L E R ) · T B S M P D C C H P e r i o d = 0.98 · 728 1.920 = 363 bps
image (6.3)
Table 6.5 summarizes the Cat-M1 and Cat-M2 PUSCH data rates.

Table 6.5

LTE-M HD-FDD PUSCH data rates.
Scenario MAC-layer at 164   dB MCL MAC-layer peak for Rel-13 TBS MAC-layer peak for Rel-14 TBS PHY-layer peak for Rel-13 TBS PHY-layer peak for Rel-14 TBS
Cat-M1 363 bps 375   kbps 1.119   Mbps 1   Mbps 2.984   Mbps
Cat-M2 363 bps 2.609   Mbps 6.968   Mbps

image

6.4. Latency

LTE-M is designed to support a wide range of mMTC use cases. For those characterized by small data transmission the importance of the data rates presented in the previous section is overshadowed by the latency required to set up a connection and perform a single data transmission. In this section we focus on the latency to deliver a small uplink packet. We consider both the lowest latency achievable under error-free conditions and the worst-case latency calculated for devices located at the 164   dB MCL. It is shown that the 5G requirement of 10   seconds latency at the 164 dB MCL is met.
For applications requiring a consistent and short latency it is recommended to keep a device in RRC connected mode and configure it for semi-persistent scheduling (SPS). This supports transmission opportunities occurring e.g. with a periodicity of 10   ms. The latency for SPS is determined by the wait time for a SPS resource, the MPDCCH and PUSCH transmission times (t MPDCCH , t PUSCH ) and the MPDCCH to PUSCH scheduling time. Assuming a worst case wait time, the lowest latency offered by SPS equals:
t w a i t + t M P D C C H + t s c h e d + t P D S C H = 10 + 1 + 1 + 1 = 13 ms
image (6.4)
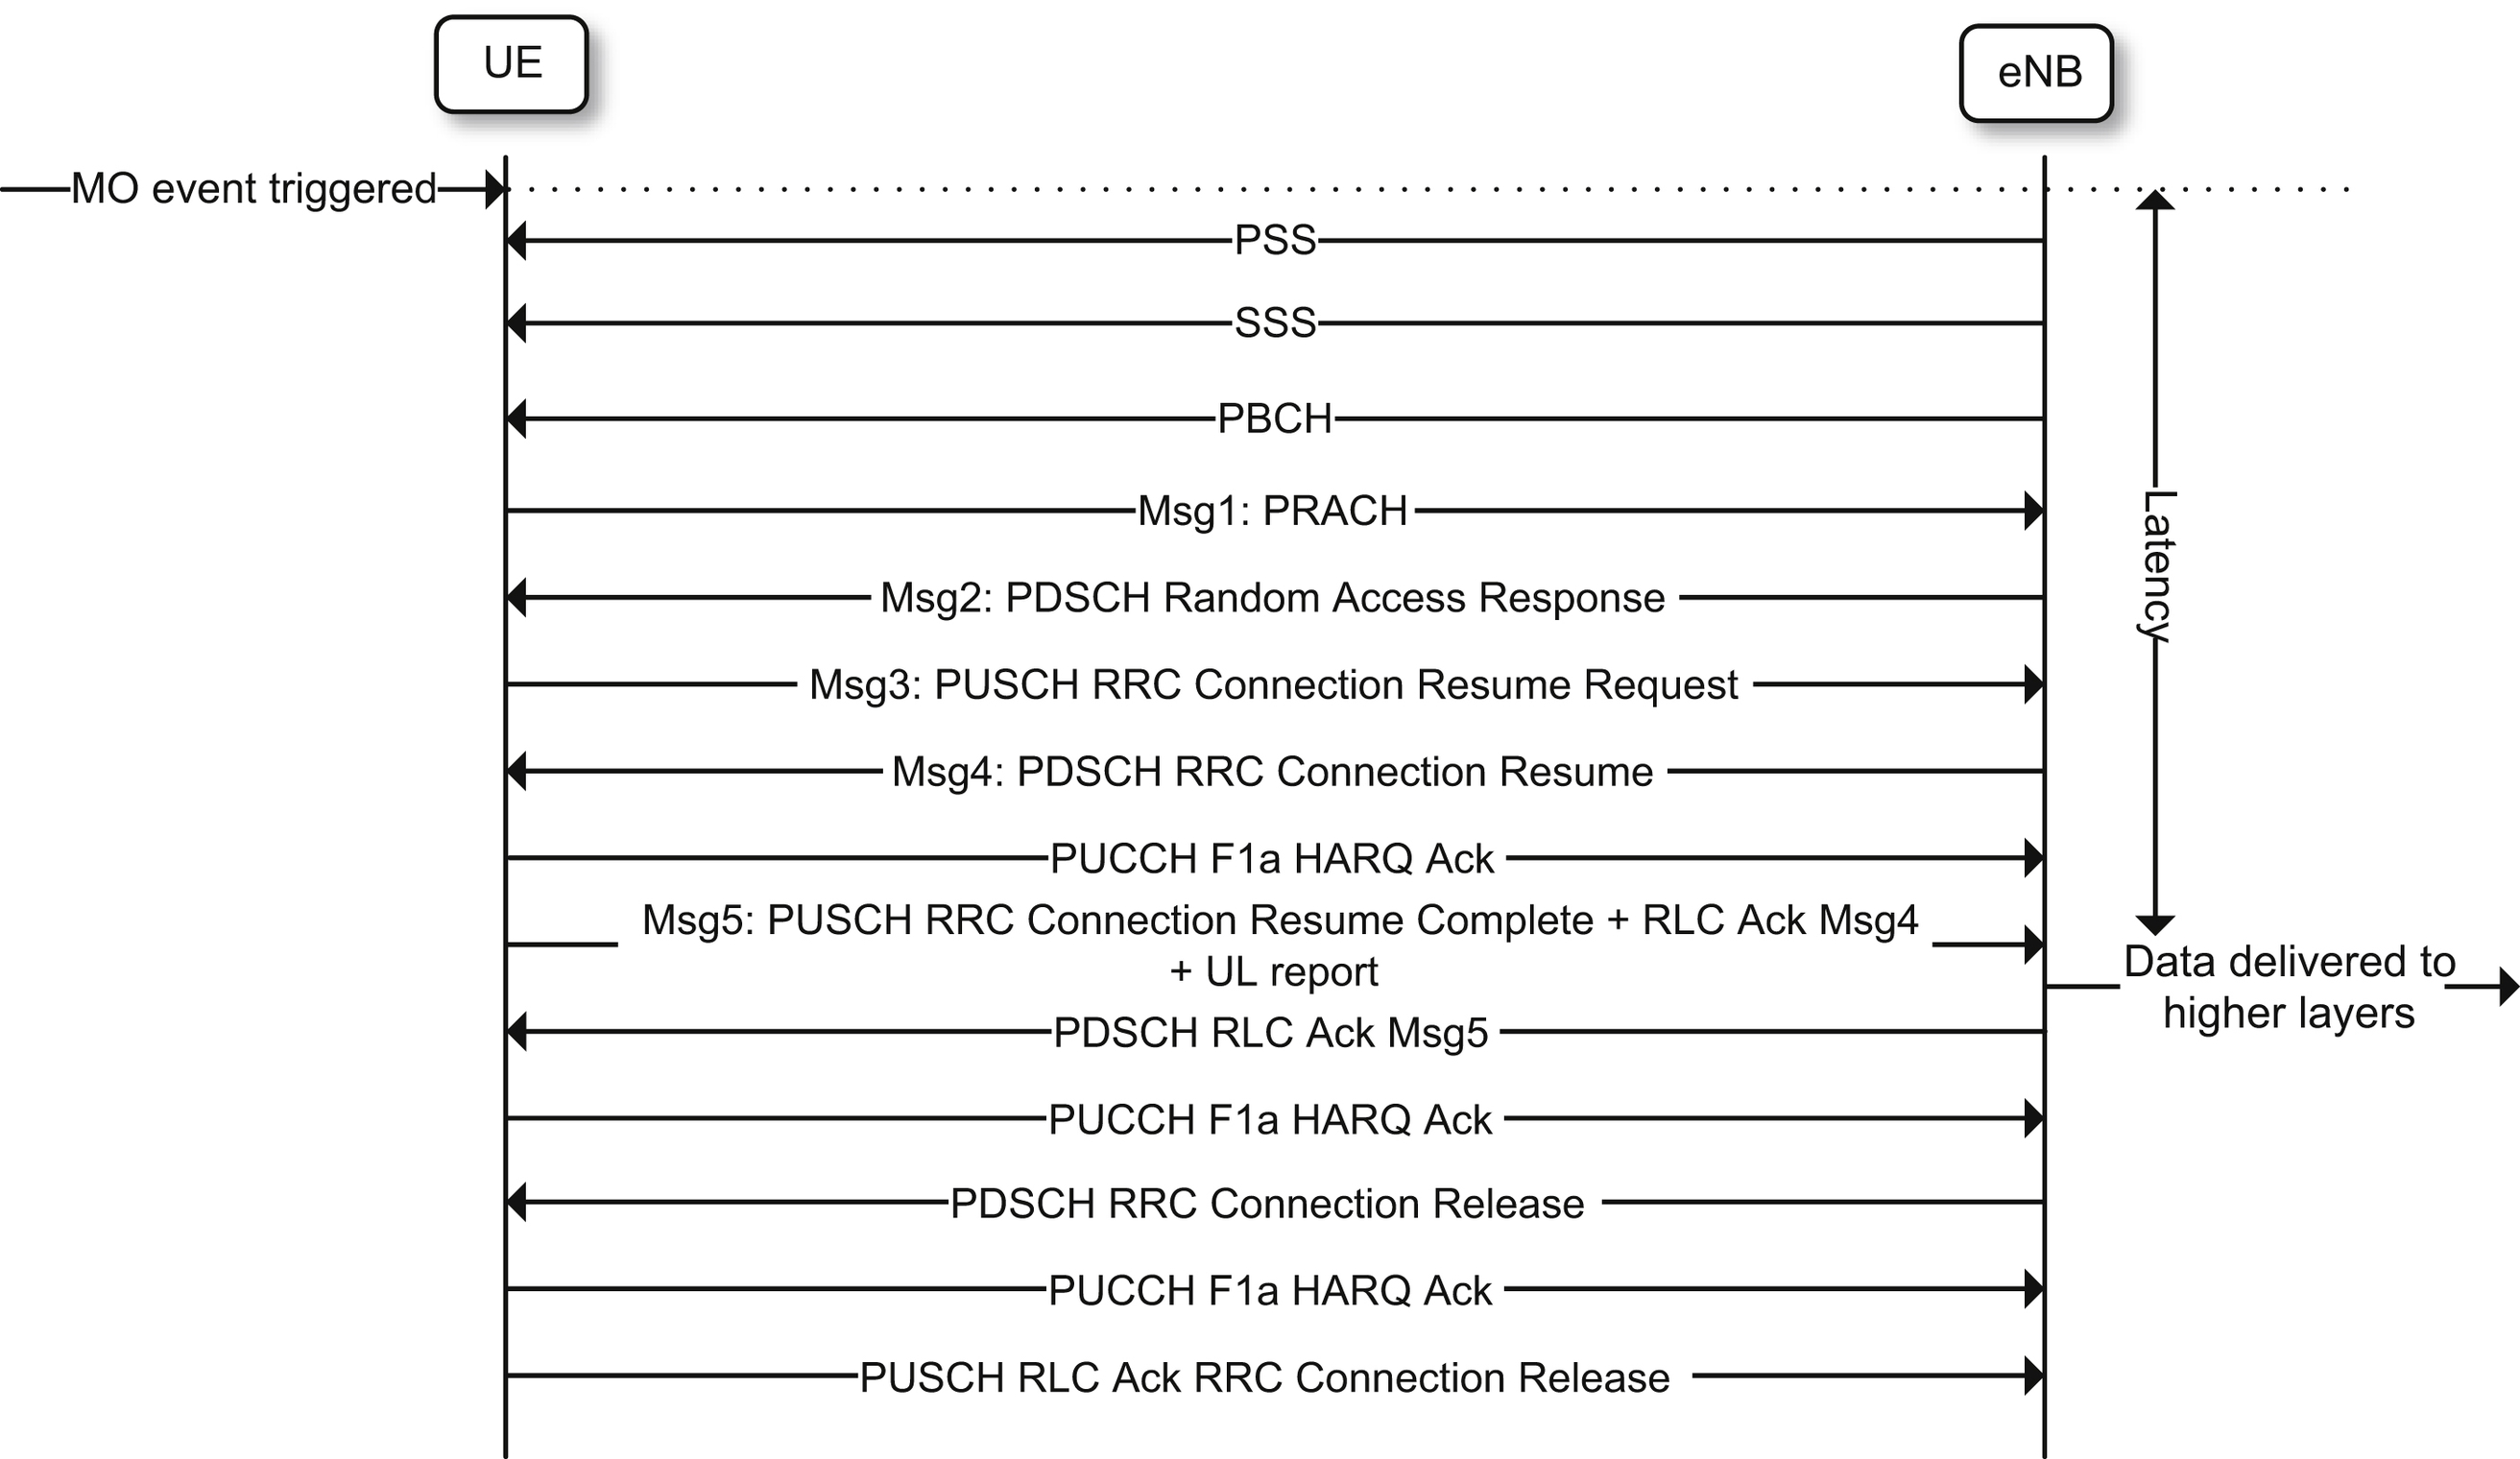
SPS supports operation in CE mode A but not in CE mode B. Keeping a device in RRC connected mode is also not a long-term energy efficient strategy. Next, we therefore look at the latency achievable for a device that triggers a mobile originated data transmission in RRC idle mode. Fig. 6.4 presents the Release 13 RRC Resume connection establishment procedure for which a device can resume a previously suspended connection including resuming access stratum security and an earlier configured data radio bearer. The figure also indicates the assumed latency definition.
  1. • PDCP layers robust header compression of the IP layer headers
  2. • PDCP layers ciphering of the SRB SDUs by means of the 4-byte Message Authentication Code – Integrity (MAC-I) field
  3. • Headers appended by the PDCP, RLC and MAC-layers
  4. • 3-byte CRC added by the PHY layer

Table 6.6

LTE-M latency.
Method Latency
SPS under error free conditions 13   ms
EDT under error free conditions 33   ms
EDT at 164   dB MCL 5.0   s
RRC resume at 164   dB MCL 7.7   s
3GPP Release 15 went beyond the RRC Resume procedure and specified the Early Data Transmission (EDT) procedure. With this procedure, user data on the dedicated traffic channel can be MAC multiplexed with the RRC Connection Resume Request message already in Message 3. In an error-free case a device may deliver an uplink report according to the following EDT timing based on the LTE-M specifications:
  1. t SSPB : The PSS/SSS synchronization signals and the PBCH master information block can be acquired in a single radio frame, i.e. within 10   ms.
  2. t PRACH : The LTE-M PRACH is highly configurable, and a realistic assumption is that a PRACH resource is available at least once every 10   ms.
  3. t RAR, wait : The random access response window starts 3   ms after a PRACH transmission.
  4. t RAR : The random access response transmission including MPDCCH and PDSCH transmission times and the cross-subframe scheduling delays requires 3   ms.
  5. T Msg3 : The Message 3 transmission may start 6   ms after the RAR, and requires a 1-ms transmission time, i.e. in total 7   ms.
Summarizing the above timings gives us a best-case latency for EDT of 33   ms. At the 164   dB MCL a latency of 5   seconds can be achieved for LTE-M using the EDT procedure [5]. From the results summarized in Table 6.6 it is clear the LTE-M not only meets the 5G requirement with margin, but it is also capable of serving applications requiring short response times.

6.5. Battery life

The massive MTC use cases should be supported in ubiquitous deployments of massive number of devices. To limit the deployment and operation cost, the deployed devices may need to support non-rechargeable battery powered operation for years.
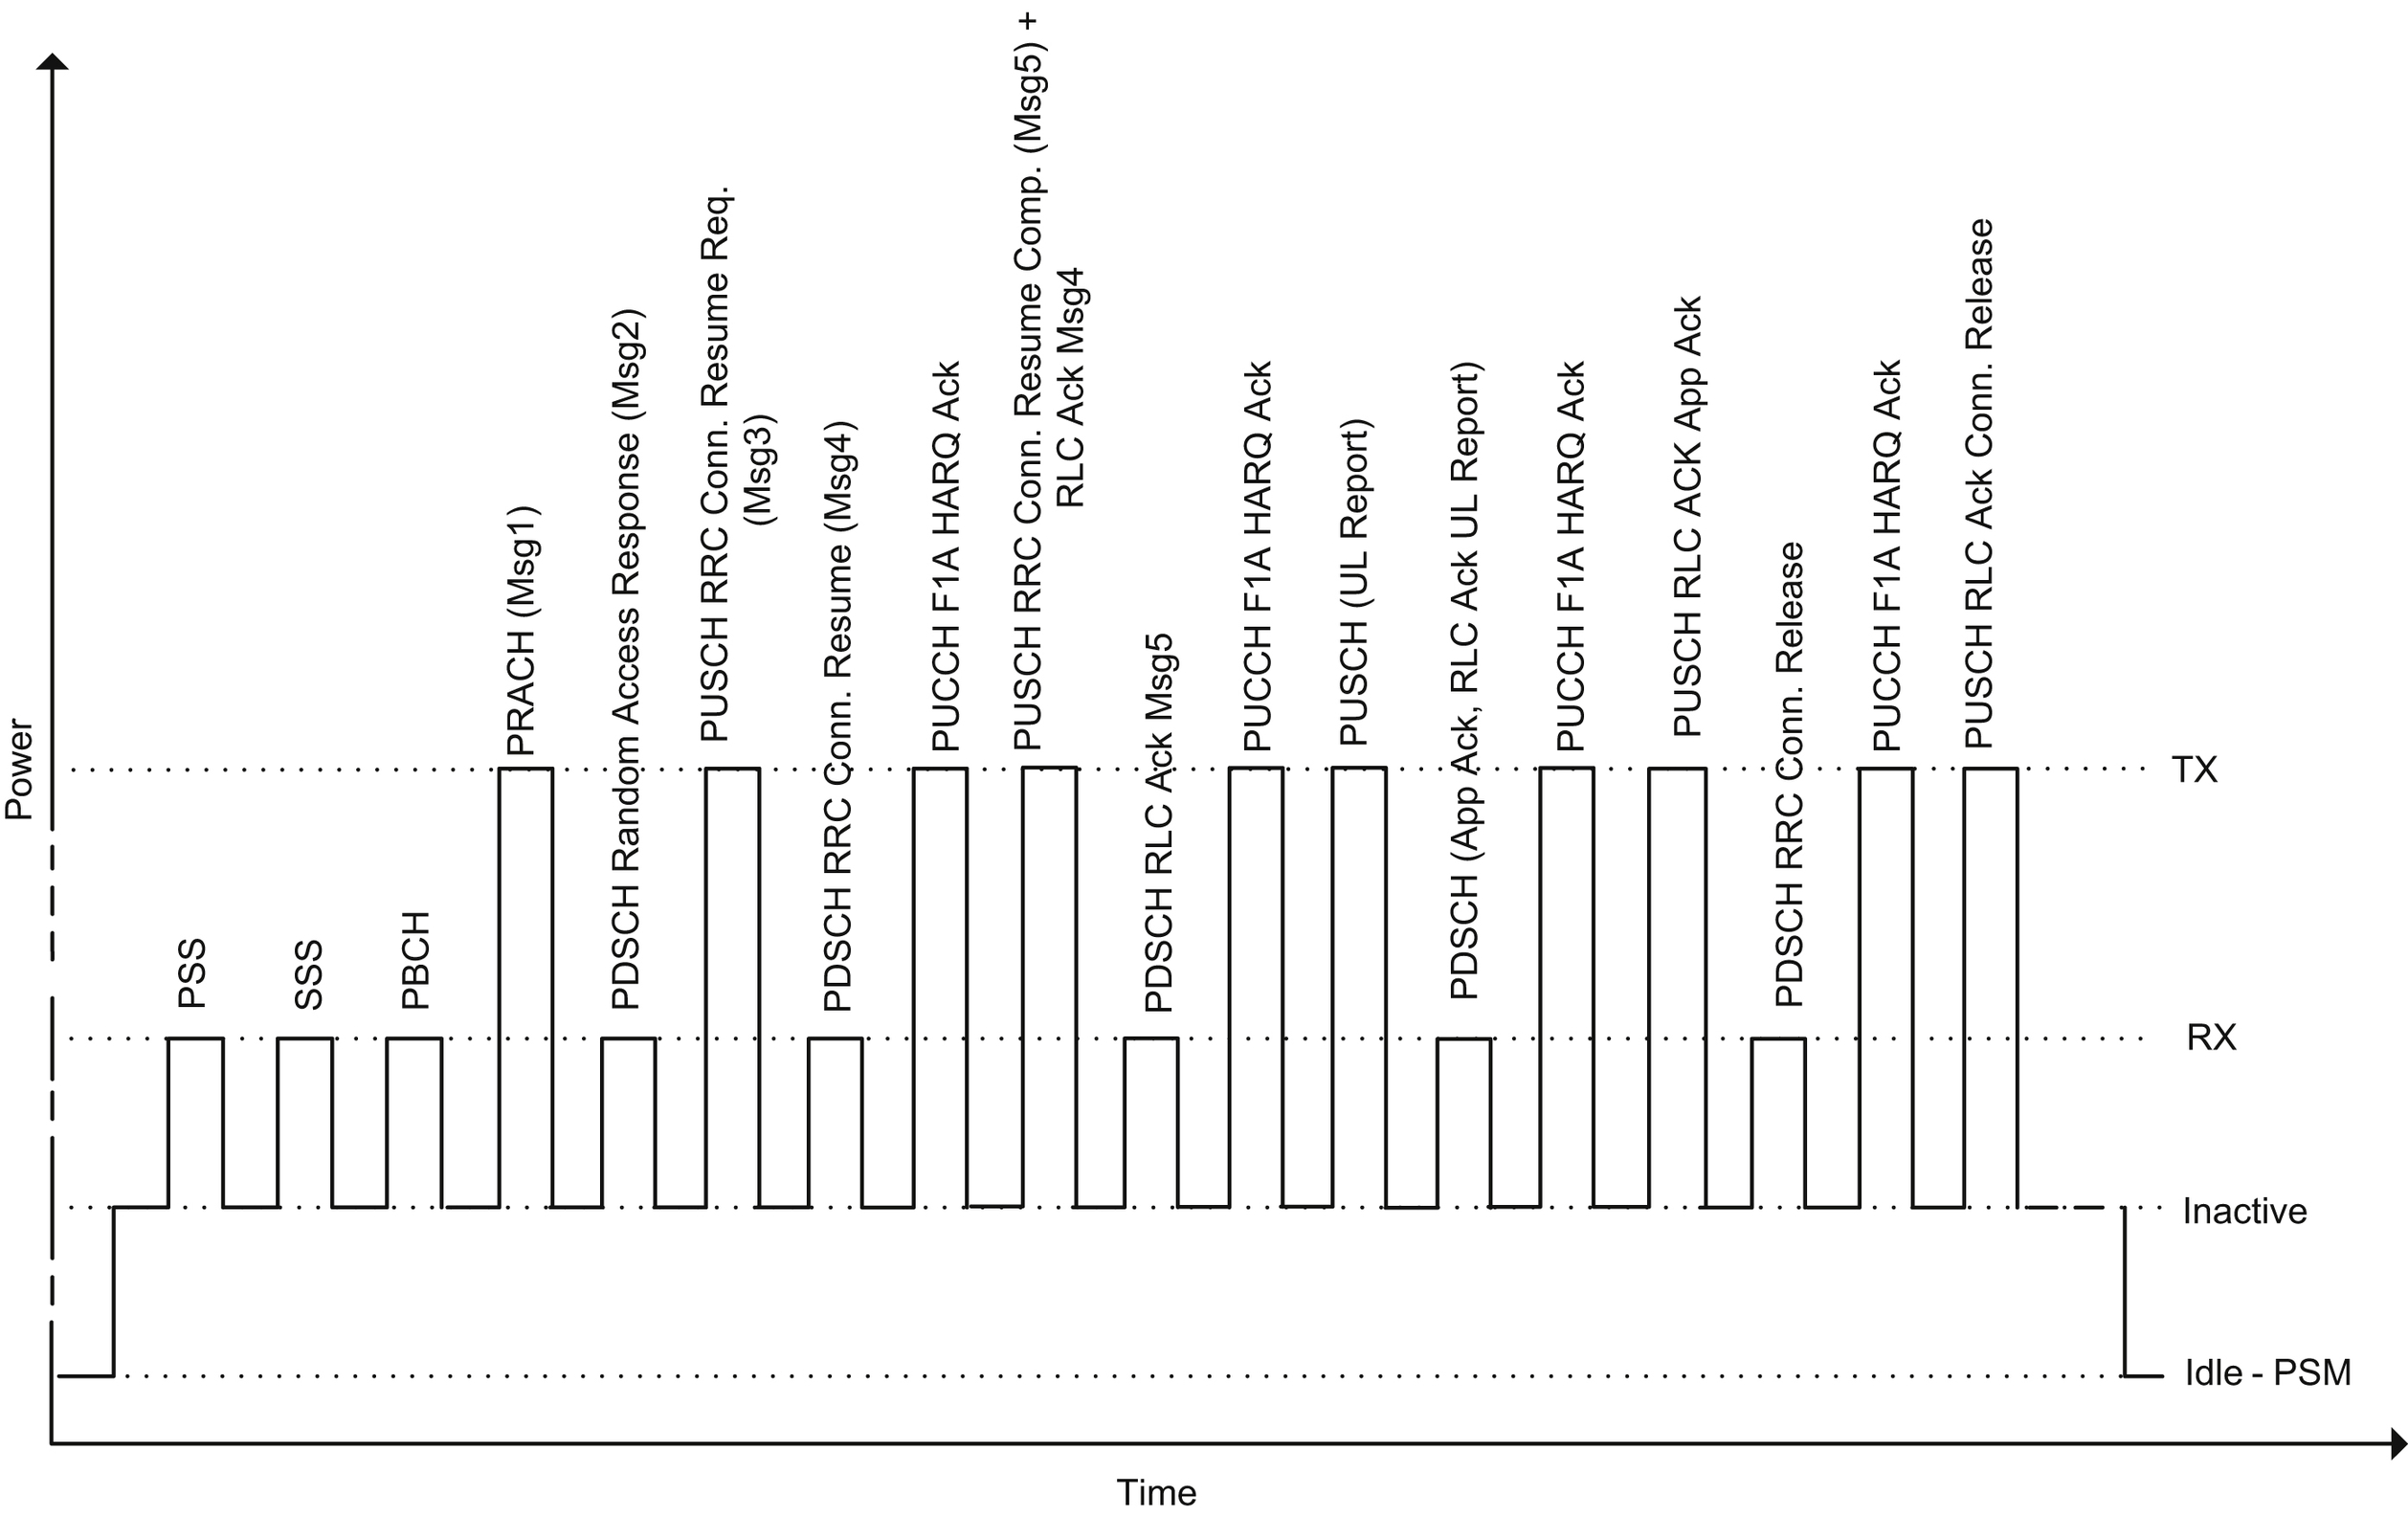
The device power consumption levels used in the evaluations are presented in Table 6.8. They distinguish between power levels at transmission (TX), reception (RX), in inactive state (e.g. in-between transmit and receive operations) and in the RRC idle Power Saving Mode (PSM). These power levels are reused from the Cellular IoT study item [4]. It should however be noted that recent publications have shown that these power level assumptions are optimistic.

Table 6.7

Packet sizes on top of the PDCP layer for evaluation of battery life [3].
Message type UL report DL application acknowledgment
Size 200   bytes 20   bytes
Arrival rate Once every 24   h

image

Table 6.8

LTE-M power consumption [4].
TX (23-dBm power class) RX Inactive PSM
500   mW 80   mW 3   mW 0.015   mW

image

The RRC Resume procedure is assumed for the Connection Establishment procedure. The complete packet flow used in these evaluations is shown in Fig. 6.6. Not depicted are the MPDCCH transmissions scheduling each transmission. Between the mobile originated events triggered once every 24   h, the device is assumed to use PSM to optimize its power consumption. The EDT procedure could in principle have been used also in this evaluation if it had not been for the uplink packet size of 200 bytes plus overheads, which exceeds the by EDT maximum supported uplink packet size of 1000 bits.

6.6. Capacity

The only IMT-2020 requirement defined by ITU-R on mMTC is connection density. It requires that a mMTC technology can support 1,000,000 devices per square kilometer for a traffic model when each device accesses the system once every 2   hours and transmits a 32-byte message. Per square kilometer the system hence needs to facilitate 1,000,000 connections over 2   hours, or ∼280 connection establishments per second. Each connection needs to provide a latency of at most 10   seconds, within which the 32-byte message should be successfully delivered to the network with 99% reliability.
IMT-2020 requires that the connection density target is fulfilled for four different urban macro (UMA) scenarios defined by:
  1. • Base station inter-site distances of 500 and 1732   meters.
  2. • Two different channel models named Urban Macro A (UMA A) and Urban Macro B (UMA B).
Table 6.9 summarizes the most important assumptions used when evaluating the LTE-M system capacity for IMT-2020. A detailed description is found in Ref. [6]. It is assumed that the base station is configured with 46   dBm transmit power, which is equally divided across the 50 PRBs in the 10-MHz LTE system bandwidth. This gives us 29   dBm/PRB or 36.8   dBm over the simulated LTE-M narrowband. The studied LTE-M narrowband is assumed to be located outside of the center 72 subcarriers, meaning that the narrowband does not carry any load from mandatory PSS, SSS, and PBCH transmissions in the downlink. To cope with the high anticipated access load, the simulated narrowband reserves 10% of all the uplink resources for random access preamble transmissions.
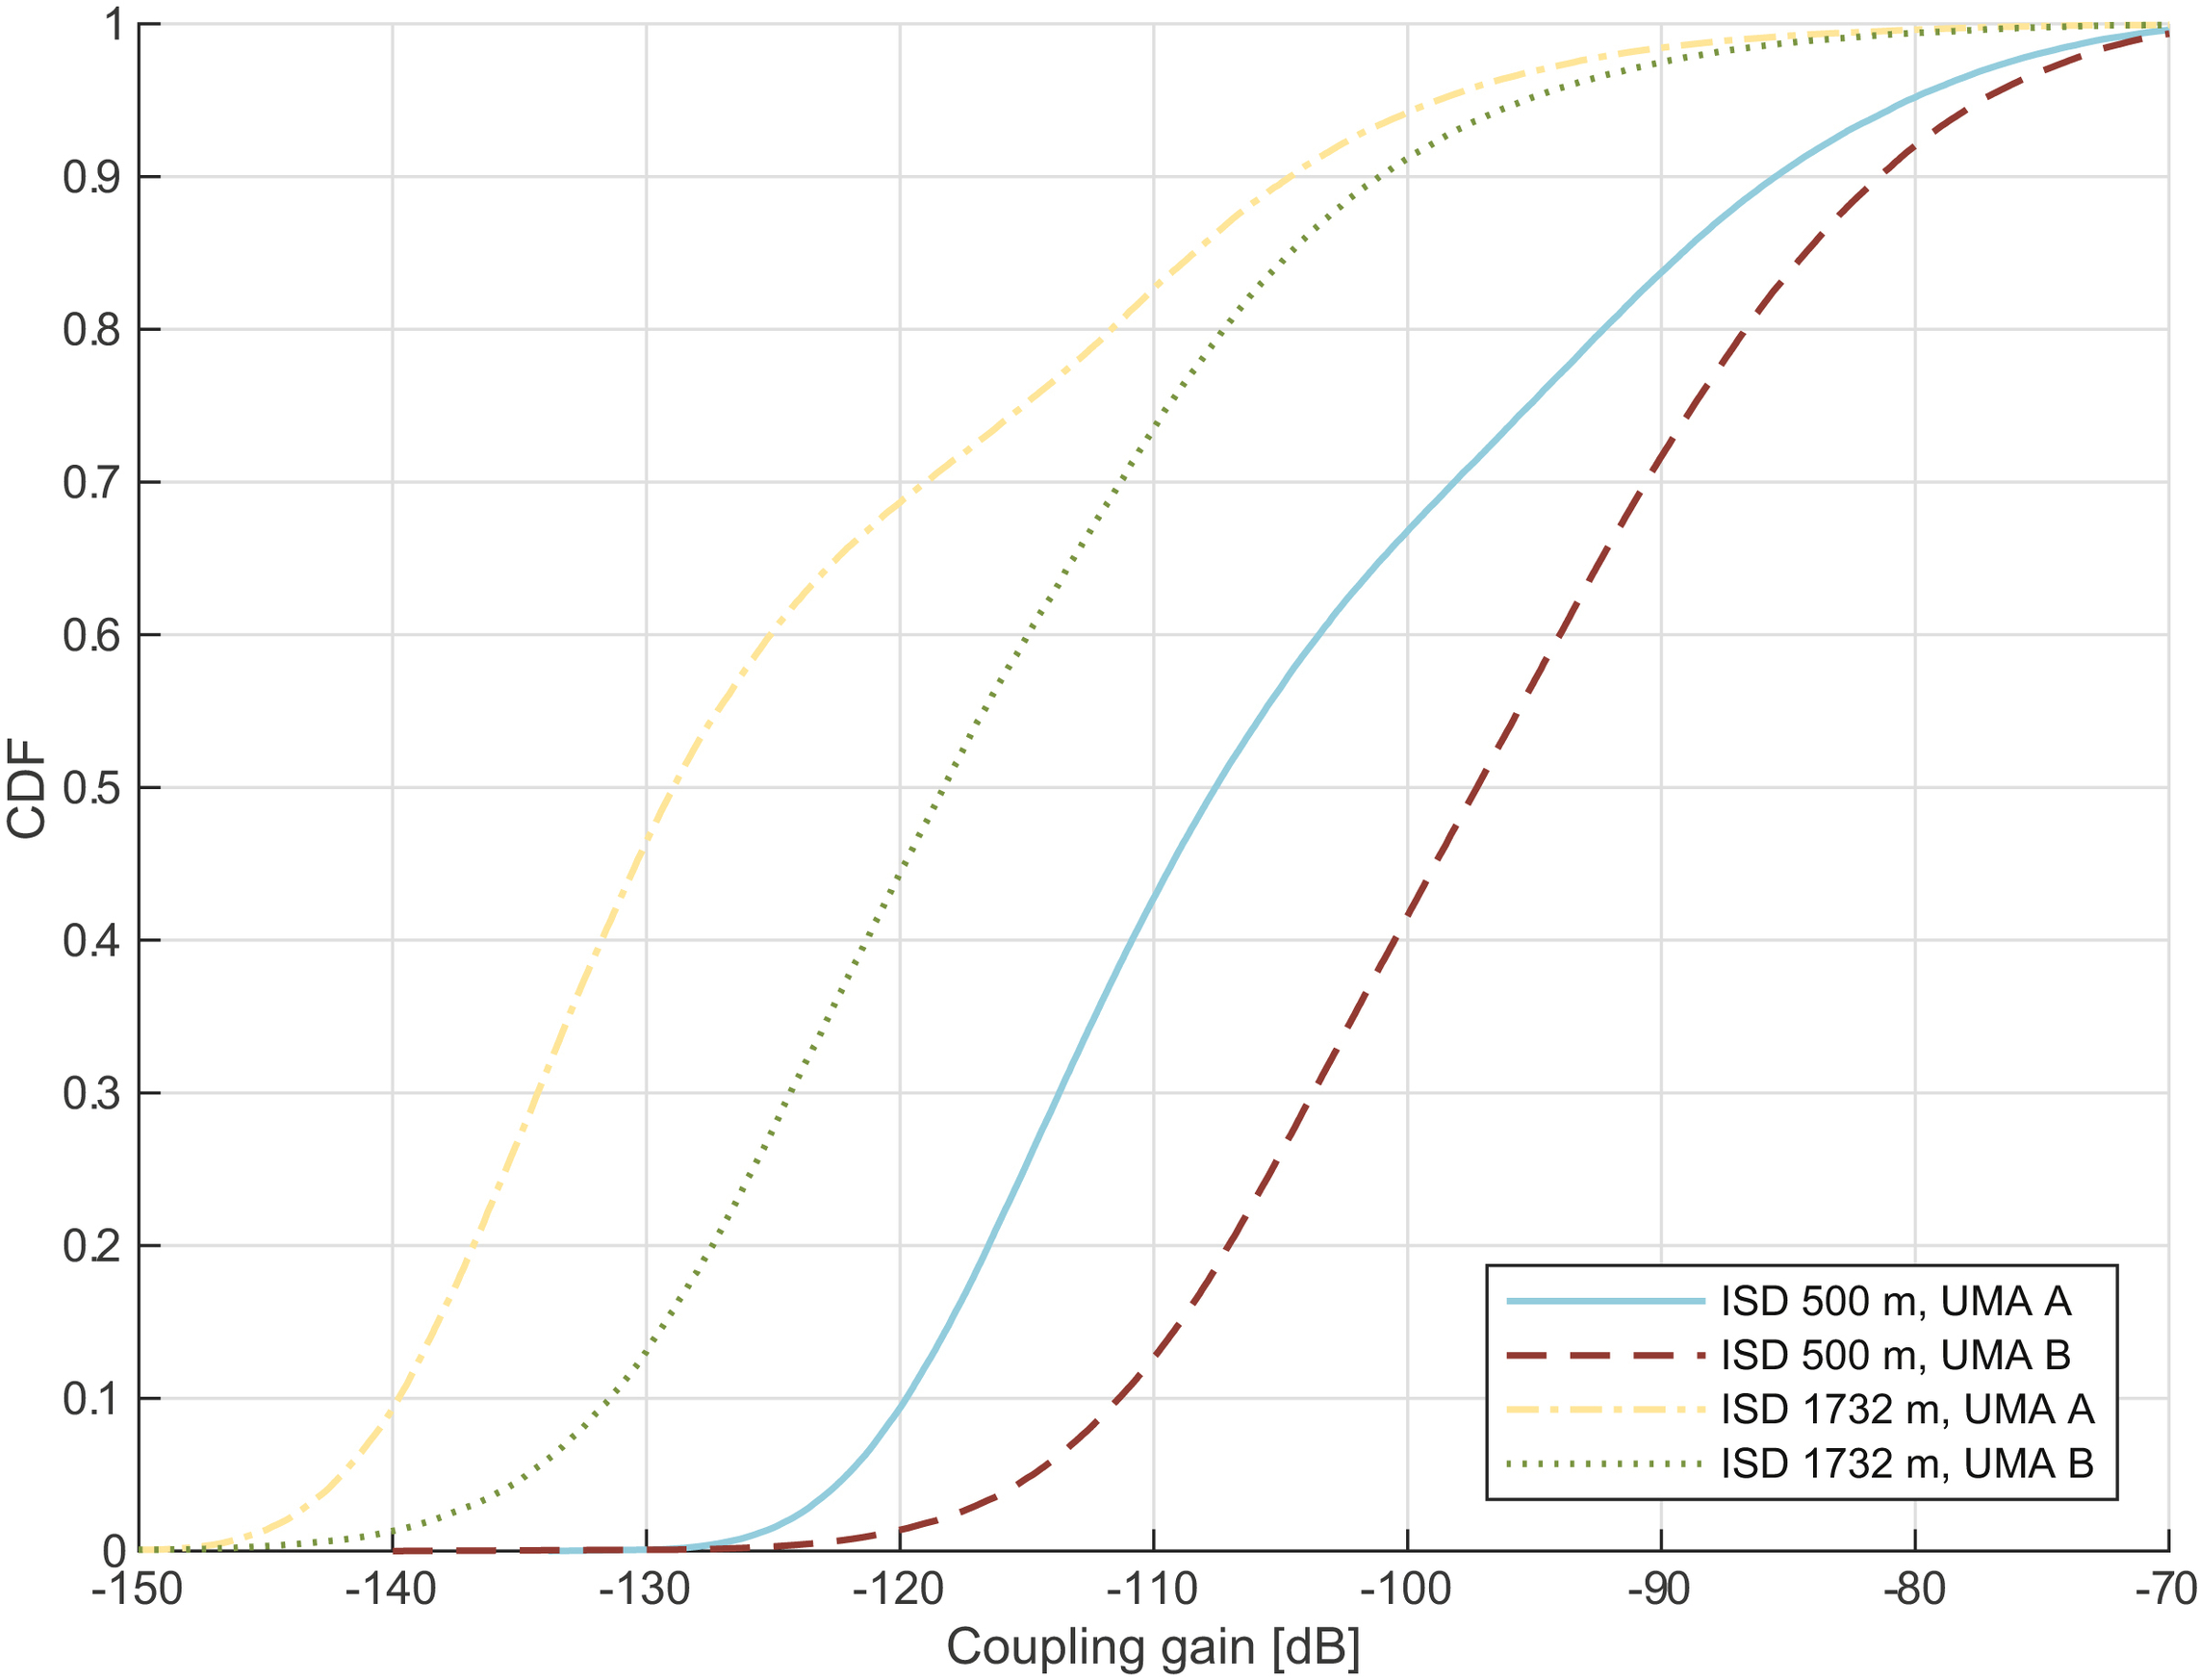
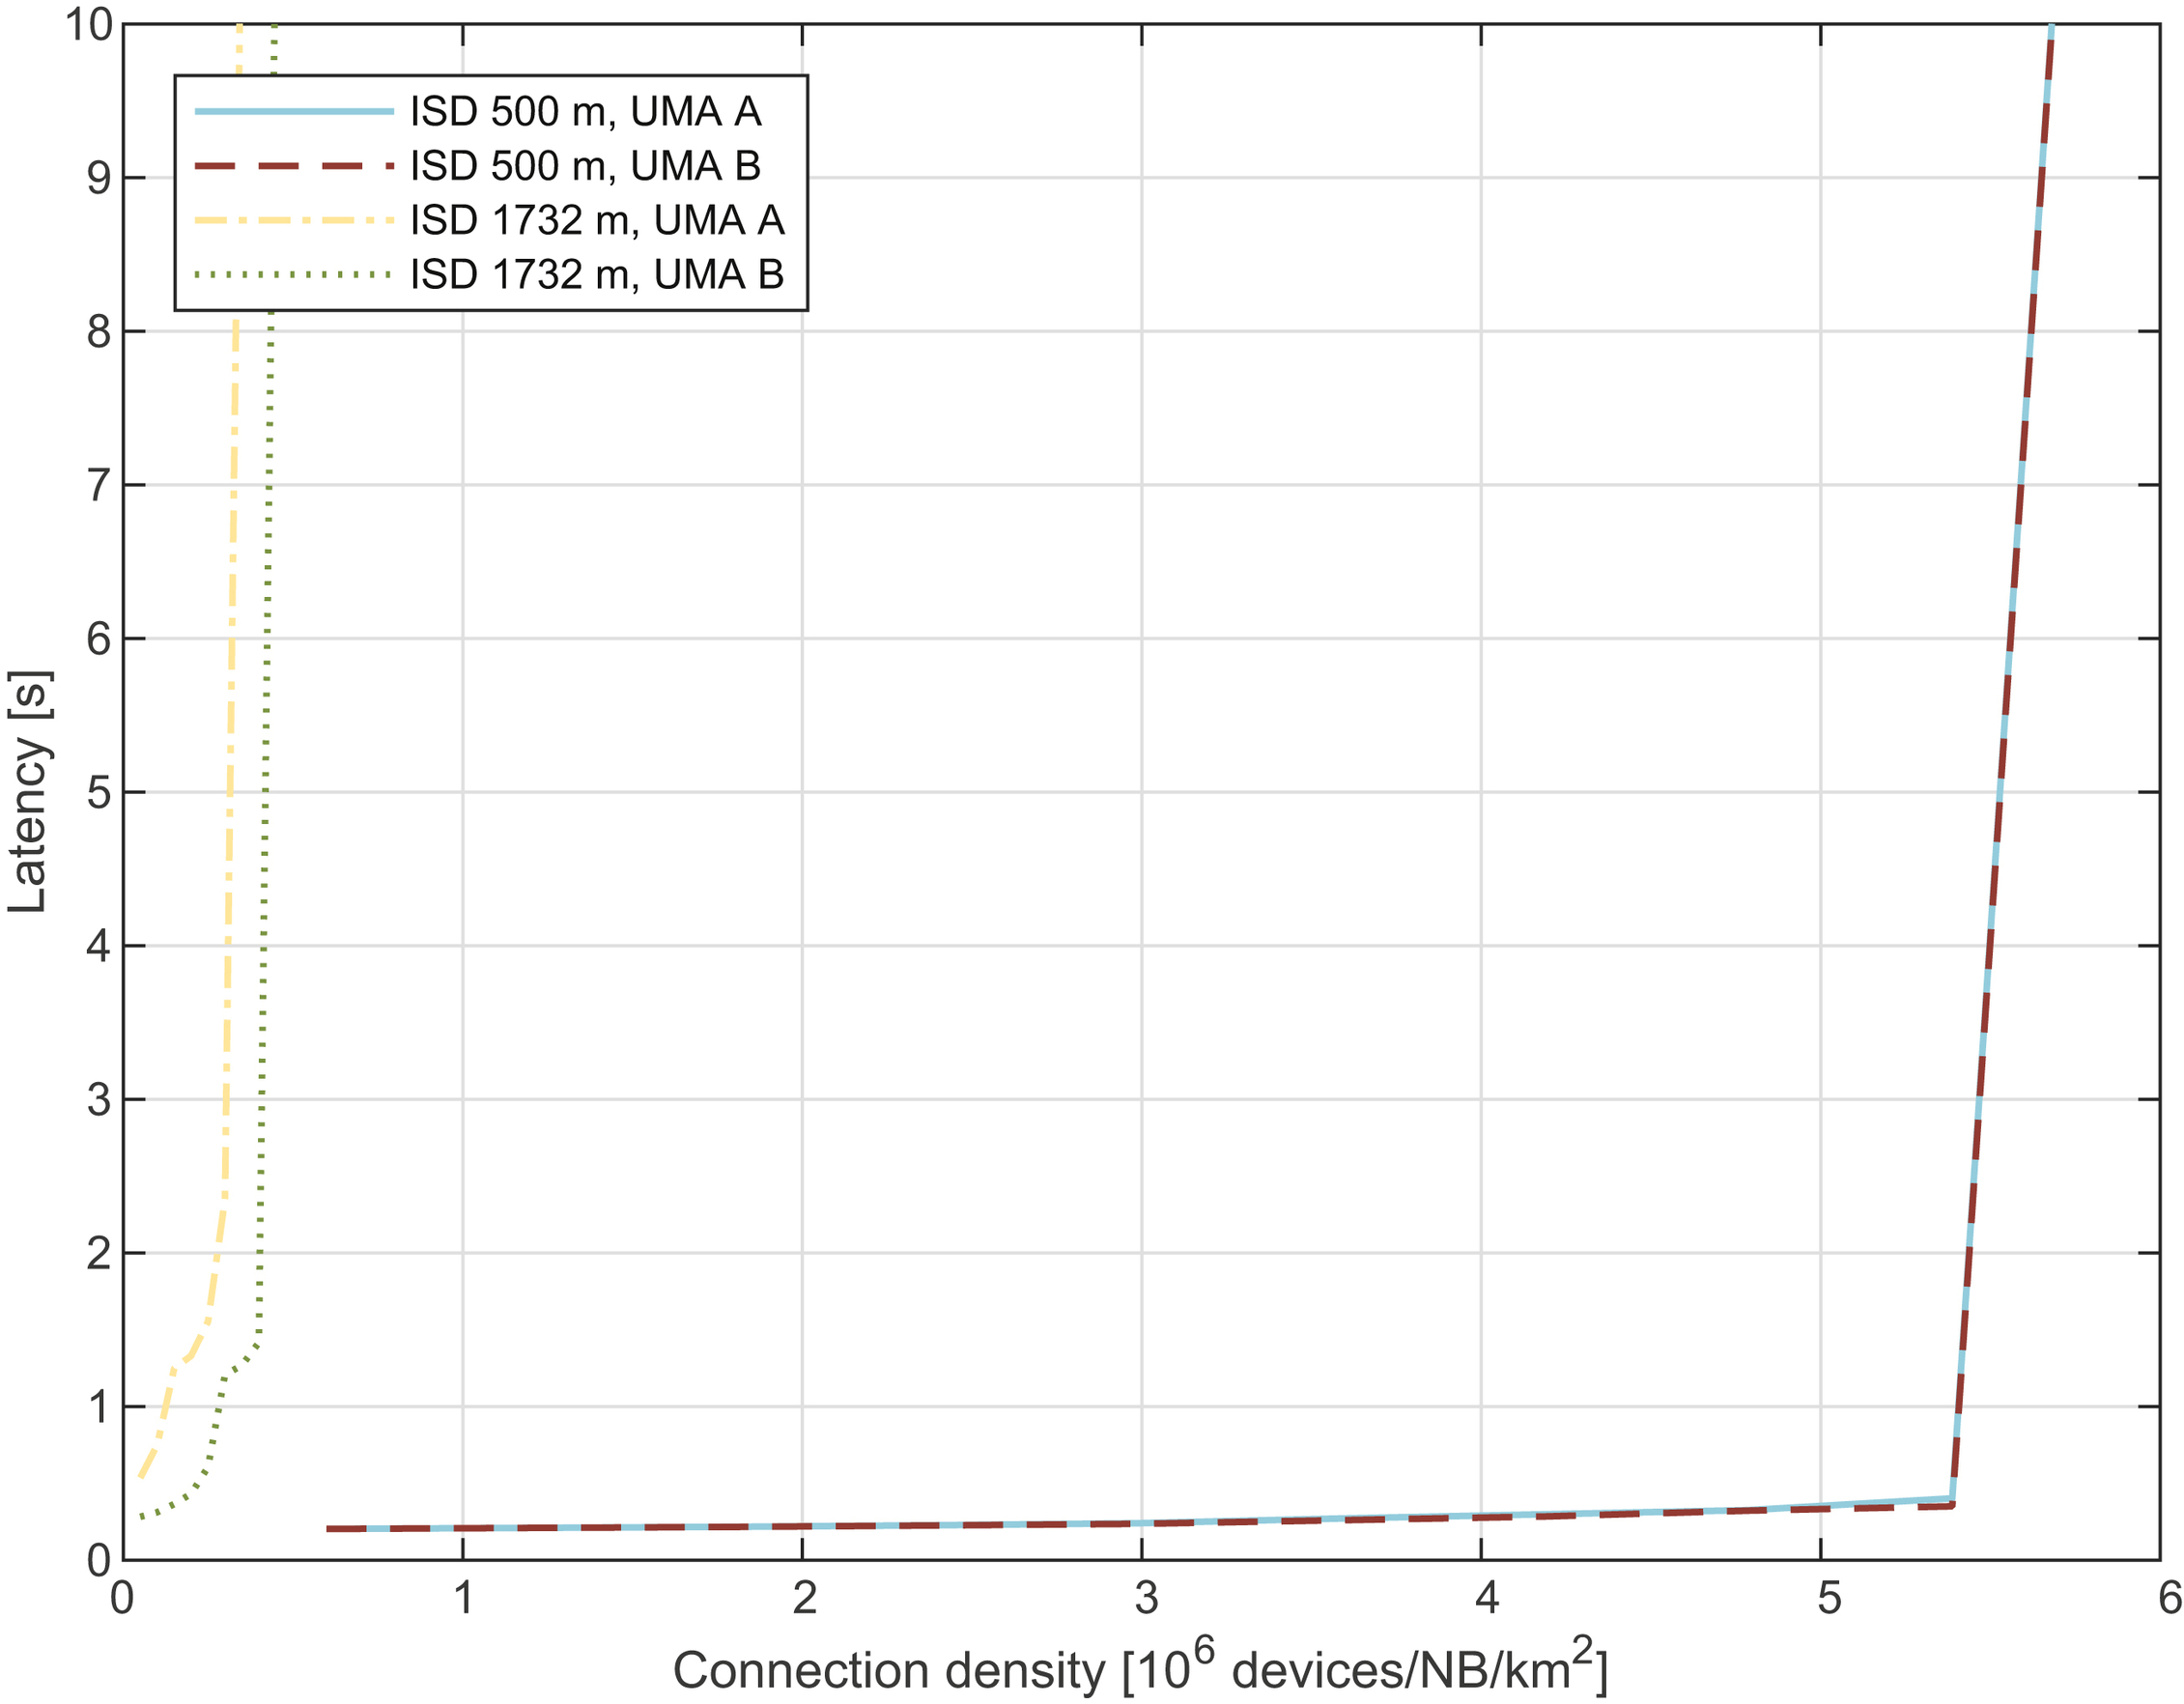
Fig. 6.8 shows the supported connection density per narrowband versus the latency required to successfully deliver the 32-byte packet. LTE-M supports a very high capacity especially in the deployment corresponding to a 500-meter inter-site distance. In this case a single narrowband, not taking PSS, SSS and PBCH transmissions into consideration, can handle more than 5   million connections. For the 1732-m inter-site distance we face a 12 times larger cell size. This explains the reductions in supported connection density observed for the 1732-meter inter-site distance scenarios, which are in the same order of magnitude as the increase in cell size.
Table 6.10 summarizes the achieved connection density per simulated narrowband, and the needed system resource to cater for the required 1,000,000 connections per km2. Note that LTE-M PUCCH transmissions are configured at the edges of the LTE system bandwidth and are typically not part of an LTE-M narrowband. This is indicated by the addition of 2 PRBs in the third column of Table 6.10. The load due to PSS, SSS, PBCH and SI transmissions were also not accounted for in these simulations. A coarse estimation is that these transmissions make use of around 40%–50% of the available downlink resources in a single narrowband within the LTE system bandwidth. It can be noted that the LTE-M capacity can be further improved by means of the PUSCH sub-PRB feature introduced in Release 15 (see Section 5.2.5.4), which was not used in this evaluation.

Table 6.9

System level simulation assumptions.
Parameter Model
Cell structure Hexagonal grid with 3 sectors per size
Cell inter site distance 500 and 1732   m
Frequency band 700   MHz
LTE system bandwidth 10   MHz
Frequency reuse 1
Base station transmit power 46   dBm
Power boosting 0   dB
Base station antenna configuration 2 TX, 2 RX
Base station antenna gain 17 dBi
Device transmit power 23   dBm
Device antenna gain 0 dBi
Device mobility 0   km/h
Pathloss model UMA A, UMA B

Table 6.10

LTE-M connection density [6].
Scenario Connection density Resources to support 1,000,000 connections per km2
ISD 500   m, UMA A 5,680,000 devices/NB 1 NB + 2 PRBs
ISD 500   m, UMA B 5,680,000 devices/NB 1 NB + 2 PRBs
ISD 1732   m, UMA A 342,000 devices/NB 3 NBs + 2 PRBs
ISD 1732   m, UMA B 445,000 devices/NB 3 NBs + 2 PRBs

6.7. Device complexity

The work on LTE-M was triggered by a desired reduction in device cost, and the target was to go down significantly in complexity and cost relative earlier LTE device categories. This enables large-scale deployments of IoT devices, where the system can be competitive in the IoT landscape, competing, for example, with low-power wide-area network alternatives in the unlicensed spectrum domain. LTE-M intends at the same time to address a large range of mMTC use cases, involving high-throughput and low-latency applications. This motivates higher requirements on computational complexity and memory requirements than those adopted for EC-GSM-IoT and NB-IoT.
To get a better understanding of the LTE-M complexity, Table 6.11 summarizes some of the more important features of the LTE-M basic device Cat-M1 that was specified in Release 13.
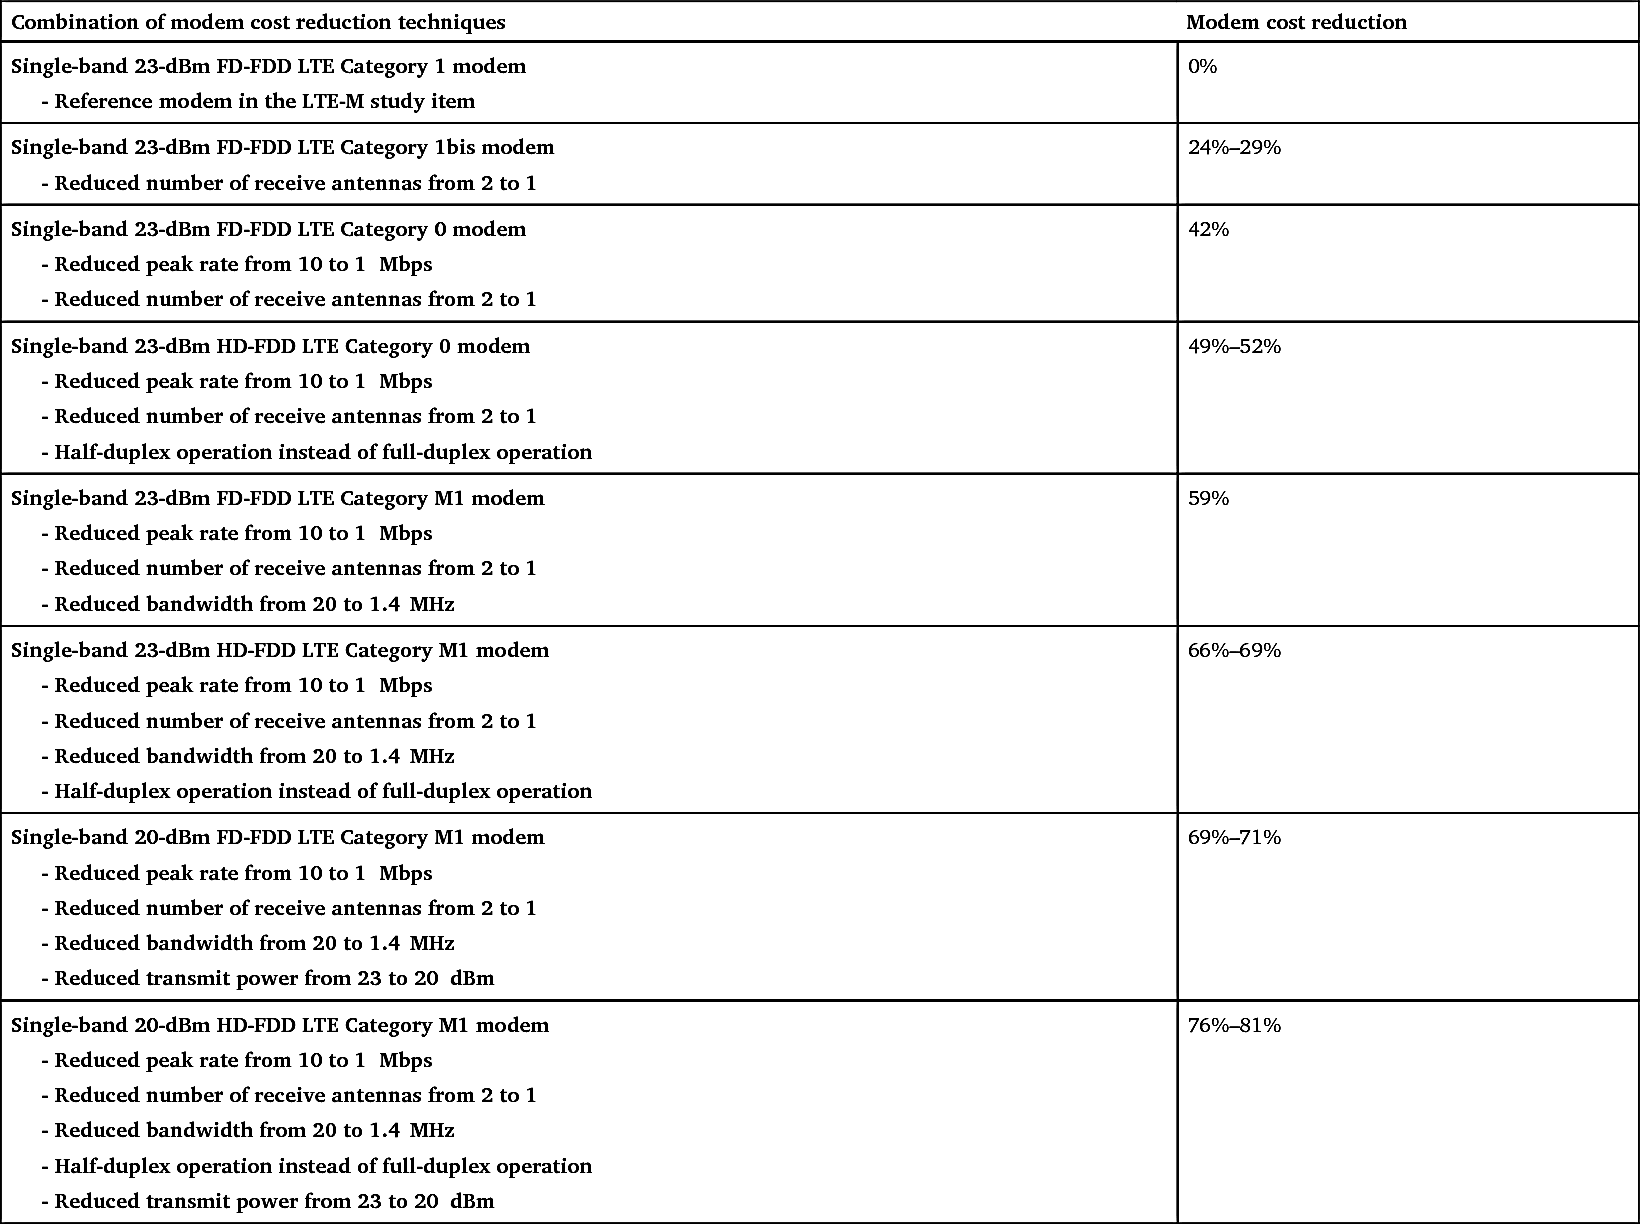
To put the design parameters in Table 6.11 in a context, Table 6.12 estimates the modem cost reduction for the LTE-M device categories introduced in Release 12 (Cat-0) and Release 13 (Cat-M1) based on the cost reduction estimates in Table 7.1 in the LTE-M study item technical report [1]. The cost reductions are expressed in terms of modem cost reduction relative to the simplest LTE device available at the time of the LTE-M study item, which was a Cat-1 device supporting a single frequency band. The LTE-M study item concluded that the bill of material for a modem would need to be reduced to about 1/3 of that for a single-band LTE Cat-1 modem to be on par with that of an EGPRS modem, and as can be seen from Table 6.12,   Cat-M1 has the potential to reach even below this level.

Table 6.11

Overview of Release 13 LTE-M device category M1.
Parameter Value
Duplex modes HD-FDD, FD-FDD, TDD
Half-duplex operation Type B
Number of receive antennas 1
Transmit power class 14, 20, 23   dBm
Maximum DL/UL bandwidth 6 PRB (1.080   MHz)
Highest DL/UL modulation order 16QAM
Maximum number of supported DL/UL spatial layers 1
Maximum DL/UL transport block size 1000 bits
Peak DL/UL physical layer data rate 1   Mbps
DL/UL channel coding type Turbo code
DL physical layer memory requirement 25,344 soft channel bits
Layer 2 memory requirement 20,000 bytes

Table 6.12

Overview of measures supporting an LTE-M modem cost reduction [1].
Combination of modem cost reduction techniques Modem cost reduction
Single-band 23-dBm FD-FDD LTE Category 1 modem

- Reference modem in the LTE-M study item

0%
Single-band 23-dBm FD-FDD LTE Category 1bis modem

- Reduced number of receive antennas from 2 to 1

24%–29%
Single-band 23-dBm FD-FDD LTE Category 0 modem

- Reduced peak rate from 10 to 1   Mbps

- Reduced number of receive antennas from 2 to 1

42%
Single-band 23-dBm HD-FDD LTE Category 0 modem

- Reduced peak rate from 10 to 1   Mbps

- Reduced number of receive antennas from 2 to 1

- Half-duplex operation instead of full-duplex operation

49%–52%
Single-band 23-dBm FD-FDD LTE Category M1 modem

- Reduced peak rate from 10 to 1   Mbps

- Reduced number of receive antennas from 2 to 1

- Reduced bandwidth from 20 to 1.4   MHz

59%
Single-band 23-dBm HD-FDD LTE Category M1 modem

- Reduced peak rate from 10 to 1   Mbps

- Reduced number of receive antennas from 2 to 1

- Reduced bandwidth from 20 to 1.4   MHz

- Half-duplex operation instead of full-duplex operation

66%–69%
Single-band 20-dBm FD-FDD LTE Category M1 modem

- Reduced peak rate from 10 to 1   Mbps

- Reduced number of receive antennas from 2 to 1

- Reduced bandwidth from 20 to 1.4   MHz

- Reduced transmit power from 23 to 20   dBm

69%–71%
Single-band 20-dBm HD-FDD LTE Category M1 modem

- Reduced peak rate from 10 to 1   Mbps

- Reduced number of receive antennas from 2 to 1

- Reduced bandwidth from 20 to 1.4   MHz

- Half-duplex operation instead of full-duplex operation

- Reduced transmit power from 23 to 20   dBm

76%–81%

image

It should be emphasized that the modem baseband and radio frequency cost is only one part of the total device cost. As pointed out for EC-GSM-IoT in Section 4.7, also components to support peripherals, real time clock, central processing unit, and power supply need to be taken into consideration to derive the total cost of a device. The potential of mass production is also highly important. LTE-M, as all LTE-based technologies, has significant benefits in this area due to the widespread use of the technology.