Chapter 12
NR URLLC performance
Abstract
This chapter shows the performance of NR URLLC, comparing the technology to the existing 5G requirements put up by ITU. The performance evaluation includes user plane and control plane latency, reliability evaluations, and spectral efficiency.
Keywords
Third generation partnership project (3GPP); 3GPP RAN; LTE; 4G; 5G; mMTC; Critical MTC; cMTC; URLLC; NR
In this Chapter we will study the performance of NR URLLC, which was presented in detail in Chapter 11, and assess if it lives up to the strict requirements that it was designed for. First, a general evaluation of latency and reliability is presented, based on requirements from IMT-2020 specifications. This is followed by two use case studies of cMTC services
where the URLLC technology is applied to enable new wireless solutions. For explanations of technical terms the reader should refer to the description in Chapter 11.
12.1. Performance objectives
The requirements on URLLC in 5G are set by ITU-R in the IMT-2020 specifications [1], which means that a radio technology that wants to have the 5G certification must fulfill these conditions. Out of the full set of 5G requirements, the ones of interest for URLLC are user plane (UP) latency, control plane (CP) latency and reliability. In the first few sections below, the assessment of these values is done for an NR system. The chosen setup follows the evaluations that have been done in 3GPP [2] as a preparation for submitting NR as a 5G RAT to ITU.
12.1.1. UP latency
The requirement on UP latency is defined from when a source node sends a packet to when the receiving node receives it. The latency is defined from and to the interface between layer 2 and layer 3 in both nodes, corresponding to QoS flows to and from the SDAP layer in NR. It is assumed that the device is in an active state, and therefore assuming no queuing delays.
A 1
ms latency bound is targeted for URLLC, and 4
ms for eMBB. Both directions (uplink and downlink) have the same requirement.
12.1.2. CP latency
The requirement on CP latency is 20
ms, defined from a battery efficient state to when the device is being able to continuously transmit data. Further reduction to 10
ms is encouraged but is not a requirement from ITU.
For NR the interpretation of a battery efficient state is chosen to be RRC INACTIVE, and the CP latency is therefore taken as the transition time from INACTIVE to CONNECTED state.
12.1.3. Reliability
The requirement on reliability is defined as the probability of successful transmission of a packet of a certain size, within a certain latency bound, at a given channel condition. Although it may sound complicated, it is simply that we want the system to guarantee that at a certain SINR we can deliver a certain packet reliably within a latency bound.
For the case of IMT-2020, the requirement on the latency bound, packet size and reliability are 1
ms, 32 bytes and 99.999%, respectively. The minimum SINR where this is achieved is technology specific and depends on the agreed evaluation scenario. However, it is specified that the reliability target as given above should be achievable at the cell-edge of the evaluation scenarios, defined as the fifth percentile of the device SINR distribution.
12.2. Evaluation
This section presents the NR URLLC performance evaluation for each URLLC requirement described in Section 12.1.1–12.1.3, and also an additional evaluation of spectral efficiency for NR URLLC.
12.2.1. Latency
The latency for a cMTC service can be directly evaluated based on the specification of the NR standard. But it is important to remember that in a real system we would need to look beyond the radio interface and account for possible additional delays from scheduling, transport, and core network functionality. We also have to make assumptions on what processing delay is needed at the gNB, as this is not defined in the standard. A simple and useful assumption is that the processing delays are equal in the device and gNB. Again, in a real system this may not be entirely correct, especially in a highly loaded network due to the higher processing load required in the gNB coming from scheduling and handling many devices.
Since we are looking at the latency achievable in critical systems we can confine the study to the maximum latency in a given scenario, meaning that we e.g. make a worst-case assumption when it comes to the waiting time until the next transmission opportunity (alignment delay).
12.2.1.1. Processing delay
Processing delay in the RAN domain is caused at the transmitting node by preparation, e.g. from protocol headers, ciphering, encoding and modulation, of transmission and in the receiving node from e.g. equalizing, decoding and deciphering. For downlink data transmissions the processing delay in the device upon reception of the downlink data on PDSCH includes the reception and decoding procedure. For uplink data transmission on PUSCH with dynamic scheduling, there is a processing delay in the device due to reception and decoding of the downlink control on PDCCH, carrying the uplink grant. In the gNB there is also processing delay as in the device, with the addition that the processing delay in the gNB also needs to comprise delay caused by e.g. scheduling and link adaptation.
The response timing in the gNB between receiving a scheduling request (SR) and transmitting a PDCCH containing an uplink grant, and between downlink HARQ reception and downlink PDSCH retransmission, is assumed in integer units of transmission time interval (TTI), meaning the used slot or mini-slot duration (the time between PDCCH occasions). For higher subcarrier spacings (SCS) and fewer symbols in the mini-slot, the TTI duration is shorter, and more TTIs are needed for processing. The assumed delays for the gNB side are given in OFDM symbols (OS) in Table 12.1. This processing consists of three main components:
For simplicity we refer to gNB processing time (
t
b
 ) as the total processing time and further that the processing time is equal always. For example, the same processing time is assumed for scheduling first transmission and re-transmission. Same processing time is also assumed for downlink transmission and uplink reception.
 ) as the total processing time and further that the processing time is equal always. For example, the same processing time is assumed for scheduling first transmission and re-transmission. Same processing time is also assumed for downlink transmission and uplink reception.
The minimum response timing in the device between PDSCH reception and PUCCH downlink HARQ transmission, and between reception of a PDCCH containing an uplink grant and PUSCH transmission was discussed in Section 11.2.3.5. In downlink, the device processing time is according to the
d
1
 value (Table 12.2) while for uplink the device processing time is according to
d
2
 value (Table 12.3) for device capability 2. For 120
kHz SCS there's no Capability 2 values agreed so we use the Capability 1 values. For
d
1
 it is assumed here that PDCCH and PDSCH overlap on 1 OFDM symbol, and that 1 DMRS symbol is used in PDSCH. For
d
2
 it is assumed that the first PUSCH symbol is only used for DMRS.
 value (Table 12.2) while for uplink the device processing time is according to
 value (Table 12.3) for device capability 2. For 120
kHz SCS there's no Capability 2 values agreed so we use the Capability 1 values. For
 it is assumed here that PDCCH and PDSCH overlap on 1 OFDM symbol, and that 1 DMRS symbol is used in PDSCH. For
 it is assumed that the first PUSCH symbol is only used for DMRS.
12.2.1.2. UP latency
For data transfer we can single out three cases:
Of these, it is natural to expect that downlink data transmission is the fastest since the PDSCH data can (at least in theory) be sent by the gNB in the next available transmission opportunity in direct connection to the downlink control on PDCCH. In case of uplink data transmission on PUSCH, we should expect a higher latency, either due to the additional signaling and delay from SR and uplink grant, or because the gNB have configured scheduling opportunities with a higher interval compared to downlink opportunities. However, in the latter case it is possible to match the scheduling opportunities with the data periodicity
(for periodic traffic) or give the device an opportunity to transmit in every TTI (for random traffic). Here, we will study this more optimally configured case for configured uplink data. Similarly, for SR-based uplink data transmission we assume that the device has an SR opportunity on PUCCH in every uplink TTI.
Table 12.2

Table 12.3

The components of UP latency for uplink and downlink data are shown in a signaling flow chart in Fig. 12.1, including the processing delay discussed in the previous section, the alignment delay from the TTI structure, and the delay from the transmission duration itself.
In the following we will analyze the worst-case UP latency after a first transmission and up to three HARQ retransmissions. We will follow the ITU definition for UP latency as outlined
in Section 12.1.1. Since 60
kHz is an optional SCS for FR1 in NR Release-15 we here focus on evaluating the UP latencies for 15, 30, and 120
kHz SCS, which will anyway show the full span of achievable latency.

For downlink HARQ and SR we assume a 2-symbol PUCCH (Format 0) placed at the end of the uplink TTI. PDCCH opportunities and PUCCH opportunities are assumed to be present in every scheduled TTI.
The alignment delay is the time required after being ready to transmit until a transmission can start. We assume the worst-case latency, meaning the alignment delay is assumed to be the longest possible given the transmission opportunities.
On the device side we assume the full processing delays
d
1
 and
and
d
2
 , also for decoding the downlink data without transmitting HARQ feedback, and when preparing for a first CG-based uplink data transmission.
 and
and
 , also for decoding the downlink data without transmitting HARQ feedback, and when preparing for a first CG-based uplink data transmission.
12.2.1.2.1. Data latency in FDD
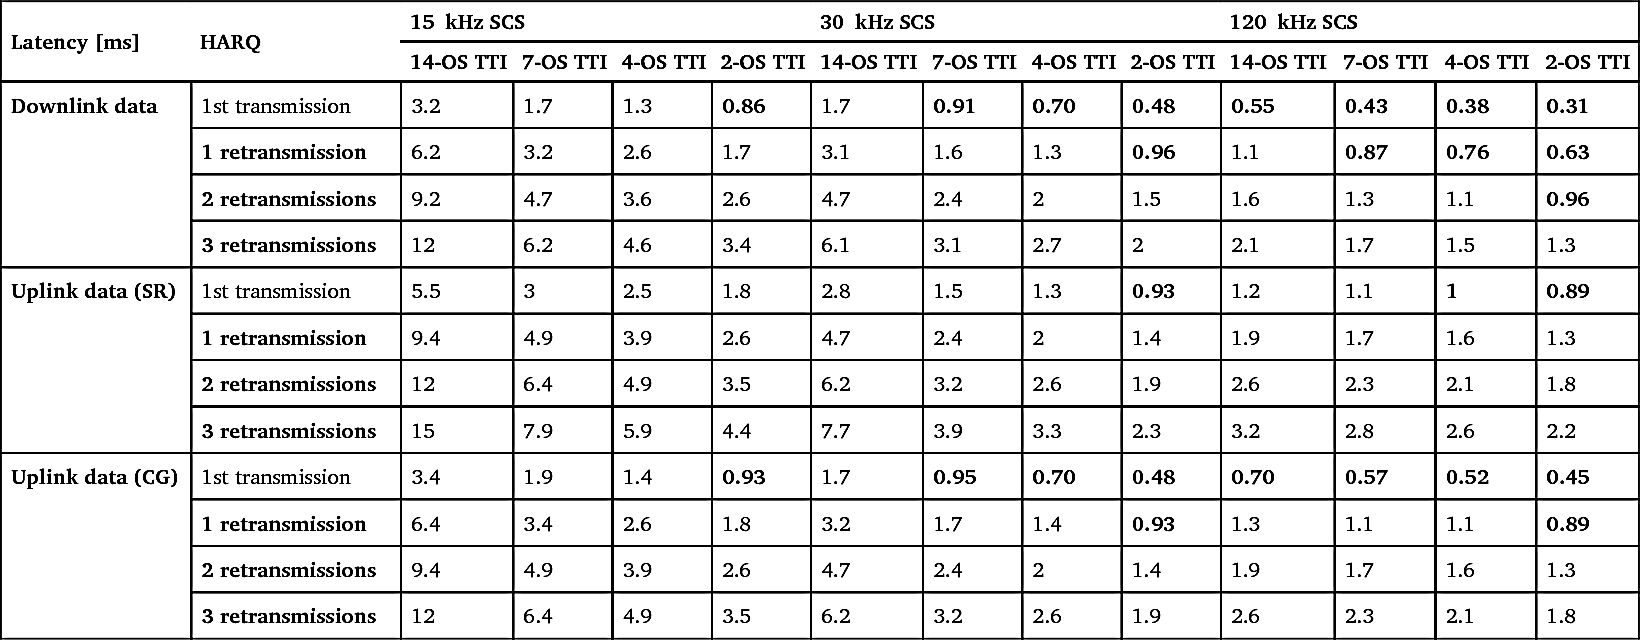
The resulting UP latency for a SCS of 15, 30 and 120
kHz in FDD is shown in Table 12.4. As can be seen, the 1
ms requirement can be reached for SCS 15
kHz and higher depending on
mini-slot configuration. With uplink CG the latency is considerably reduced compared to SR-based scheduling.
Table 12.4
12.2.1.2.2. Data latency in TDD
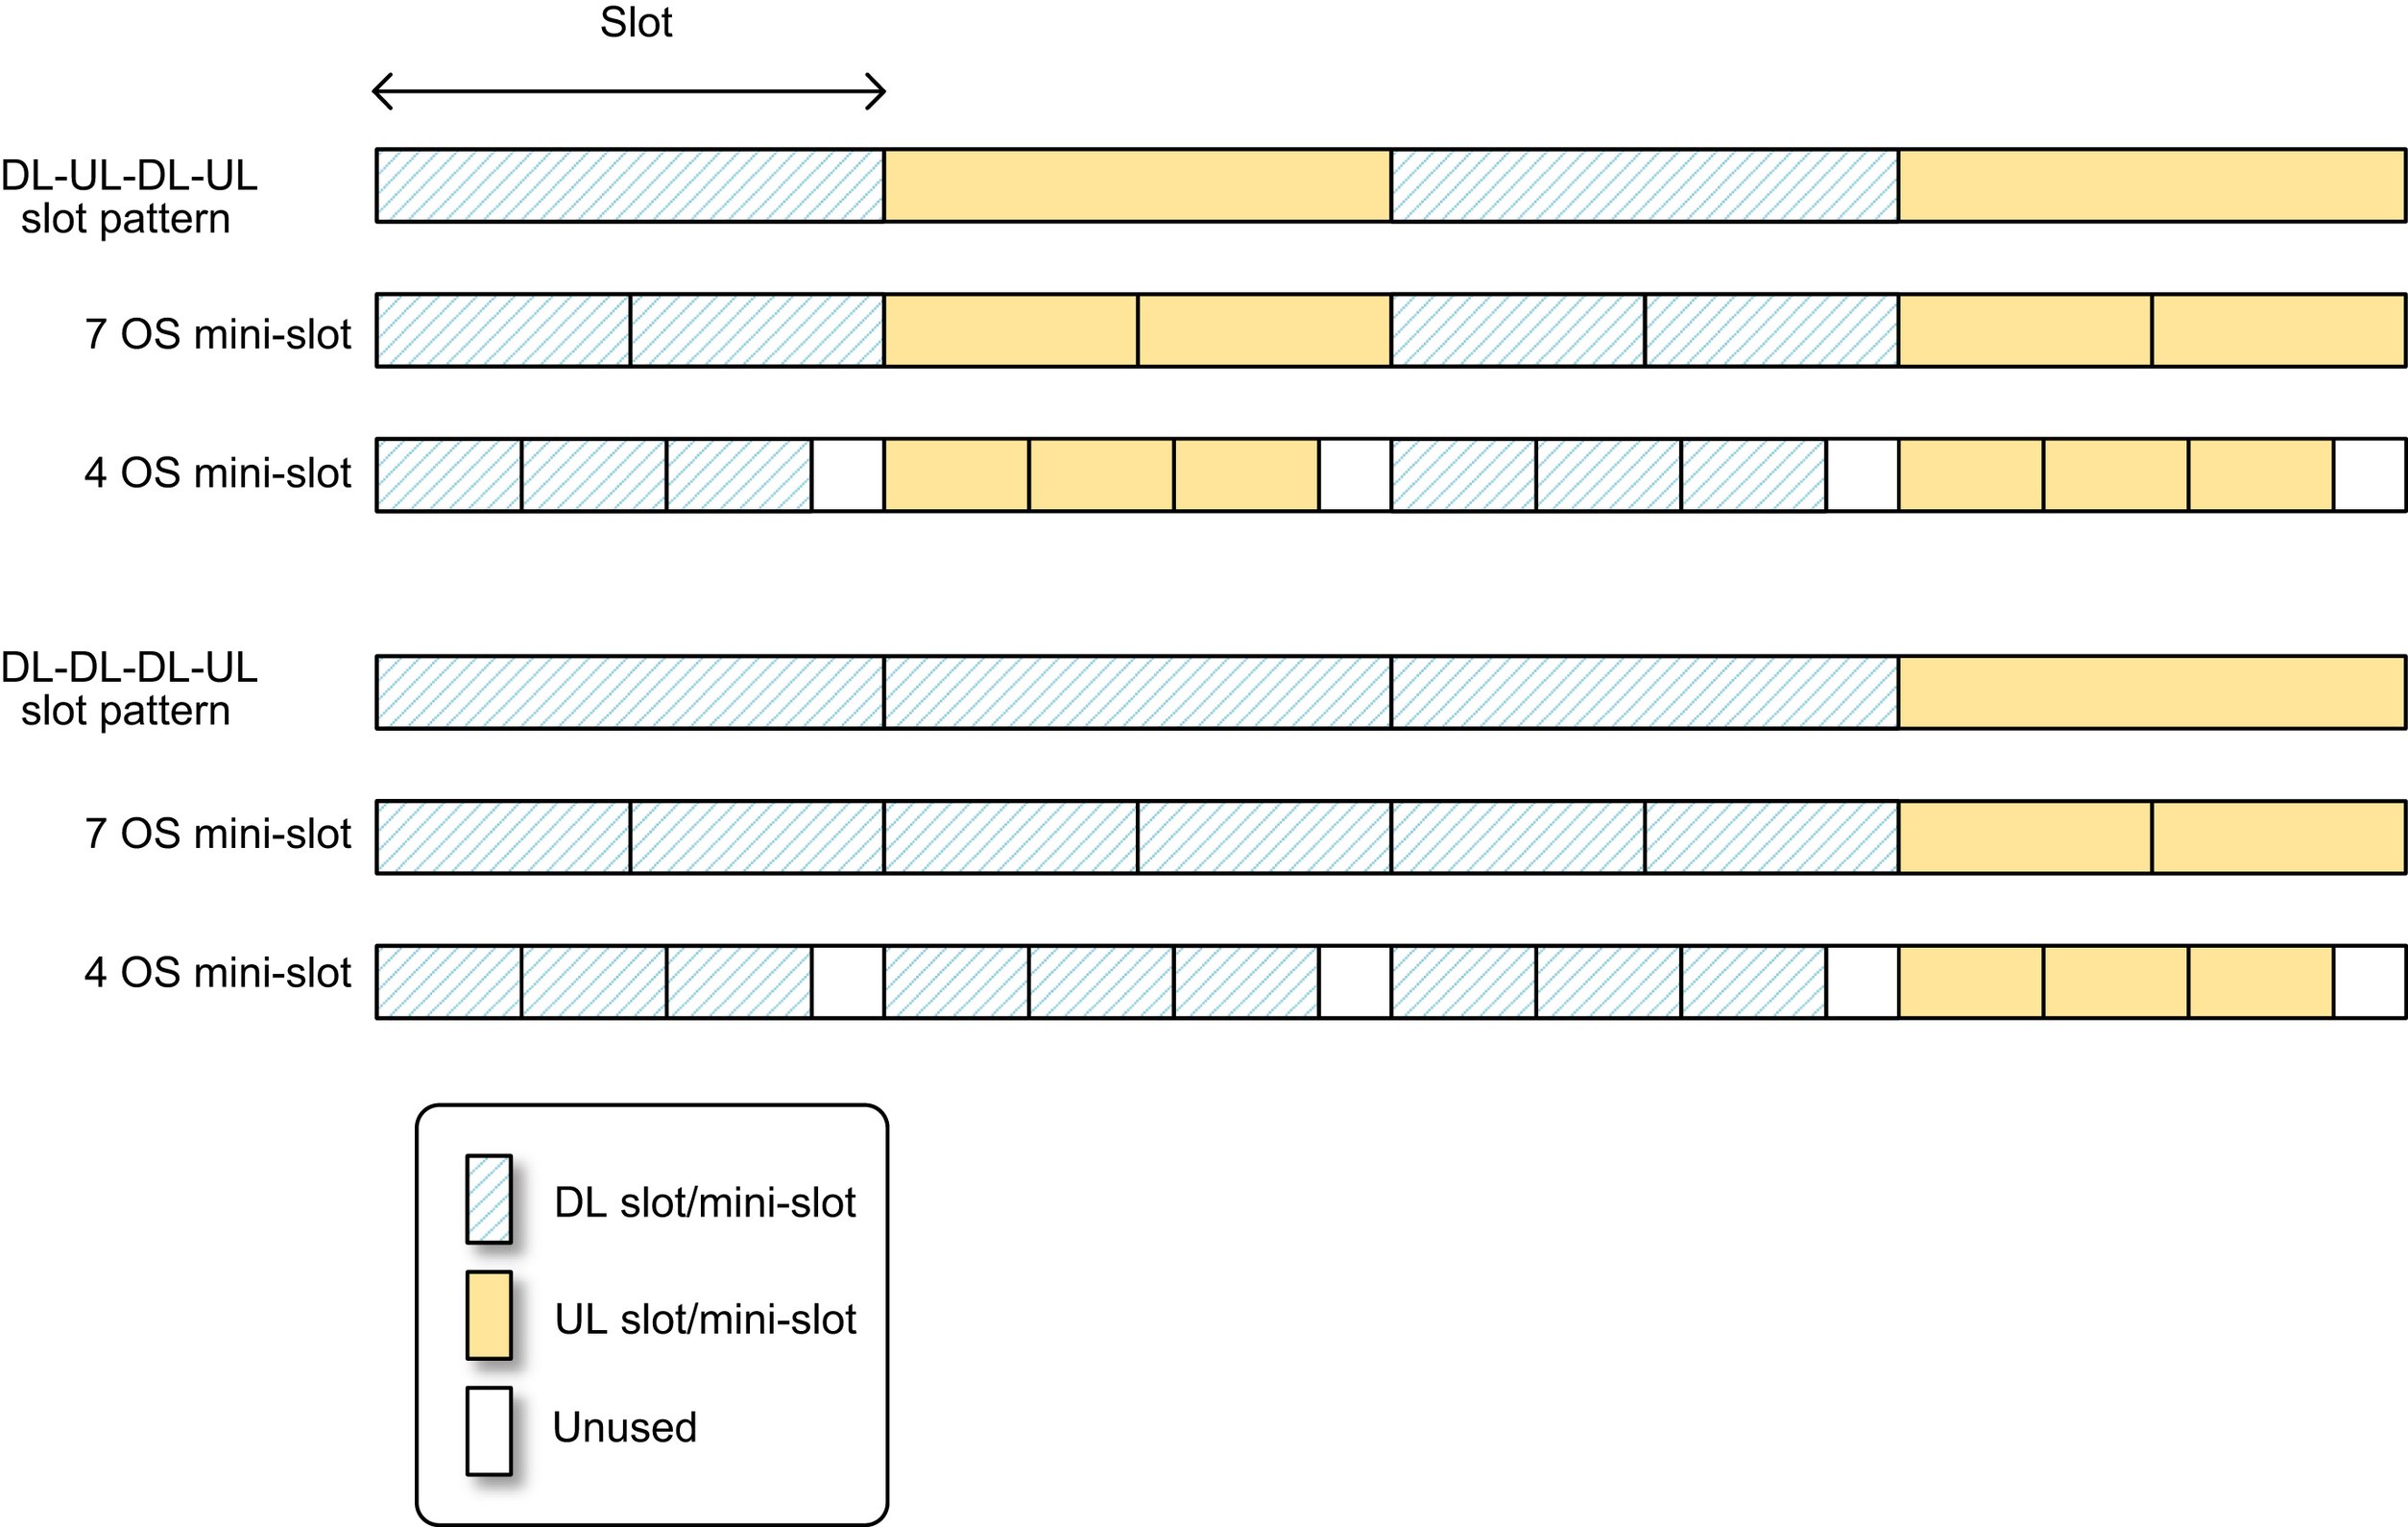
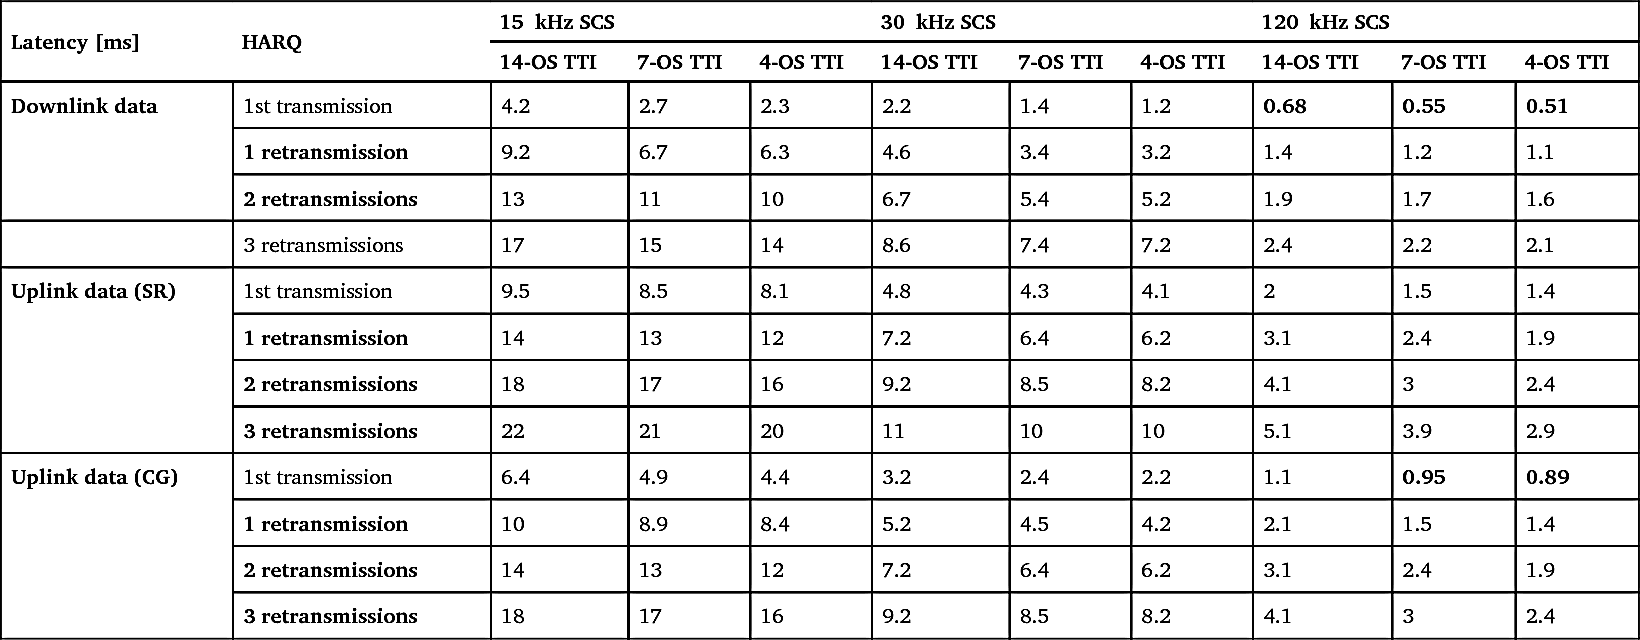
With TDD, there are additional alignment delays caused by the sequence of downlink and uplink slots. Depending on when the data arrives in the transmit buffer the latency may be the same or longer than the FDD latency. It should be noted that the pattern of downlink and uplink is fixed in slot periods of 14 symbols, and having mini-slot scheduling periods will not impact the direction: one downlink slot may consist of 2 or more mini-slots but no uplink mini-slot, as is illustrated in Fig. 12.2. This means that the alignment delay from the downlink/uplink pattern is only moderately reduced with mini-slots.
For a DL-UL-DL-UL slot pattern the resulting latency is as indicated in Table 12.5. As can be seen in the table, the 4
ms target for eMBB data can be reached with a SCS of 15
kHz for 7-symbol mini slot, while 30
kHz SCS is possible also with slot length transmission. The 1
ms target for URLLC data can be reached with 120
kHz SCS and mini-slots for downlink data and uplink data with CG. With a more downlink-heavy slot pattern as DL-DL-DL-UL the latency increases for uplink data due to the extra alignment delay, as is seen in Table 12.6.
12.2.1.3. CP latency
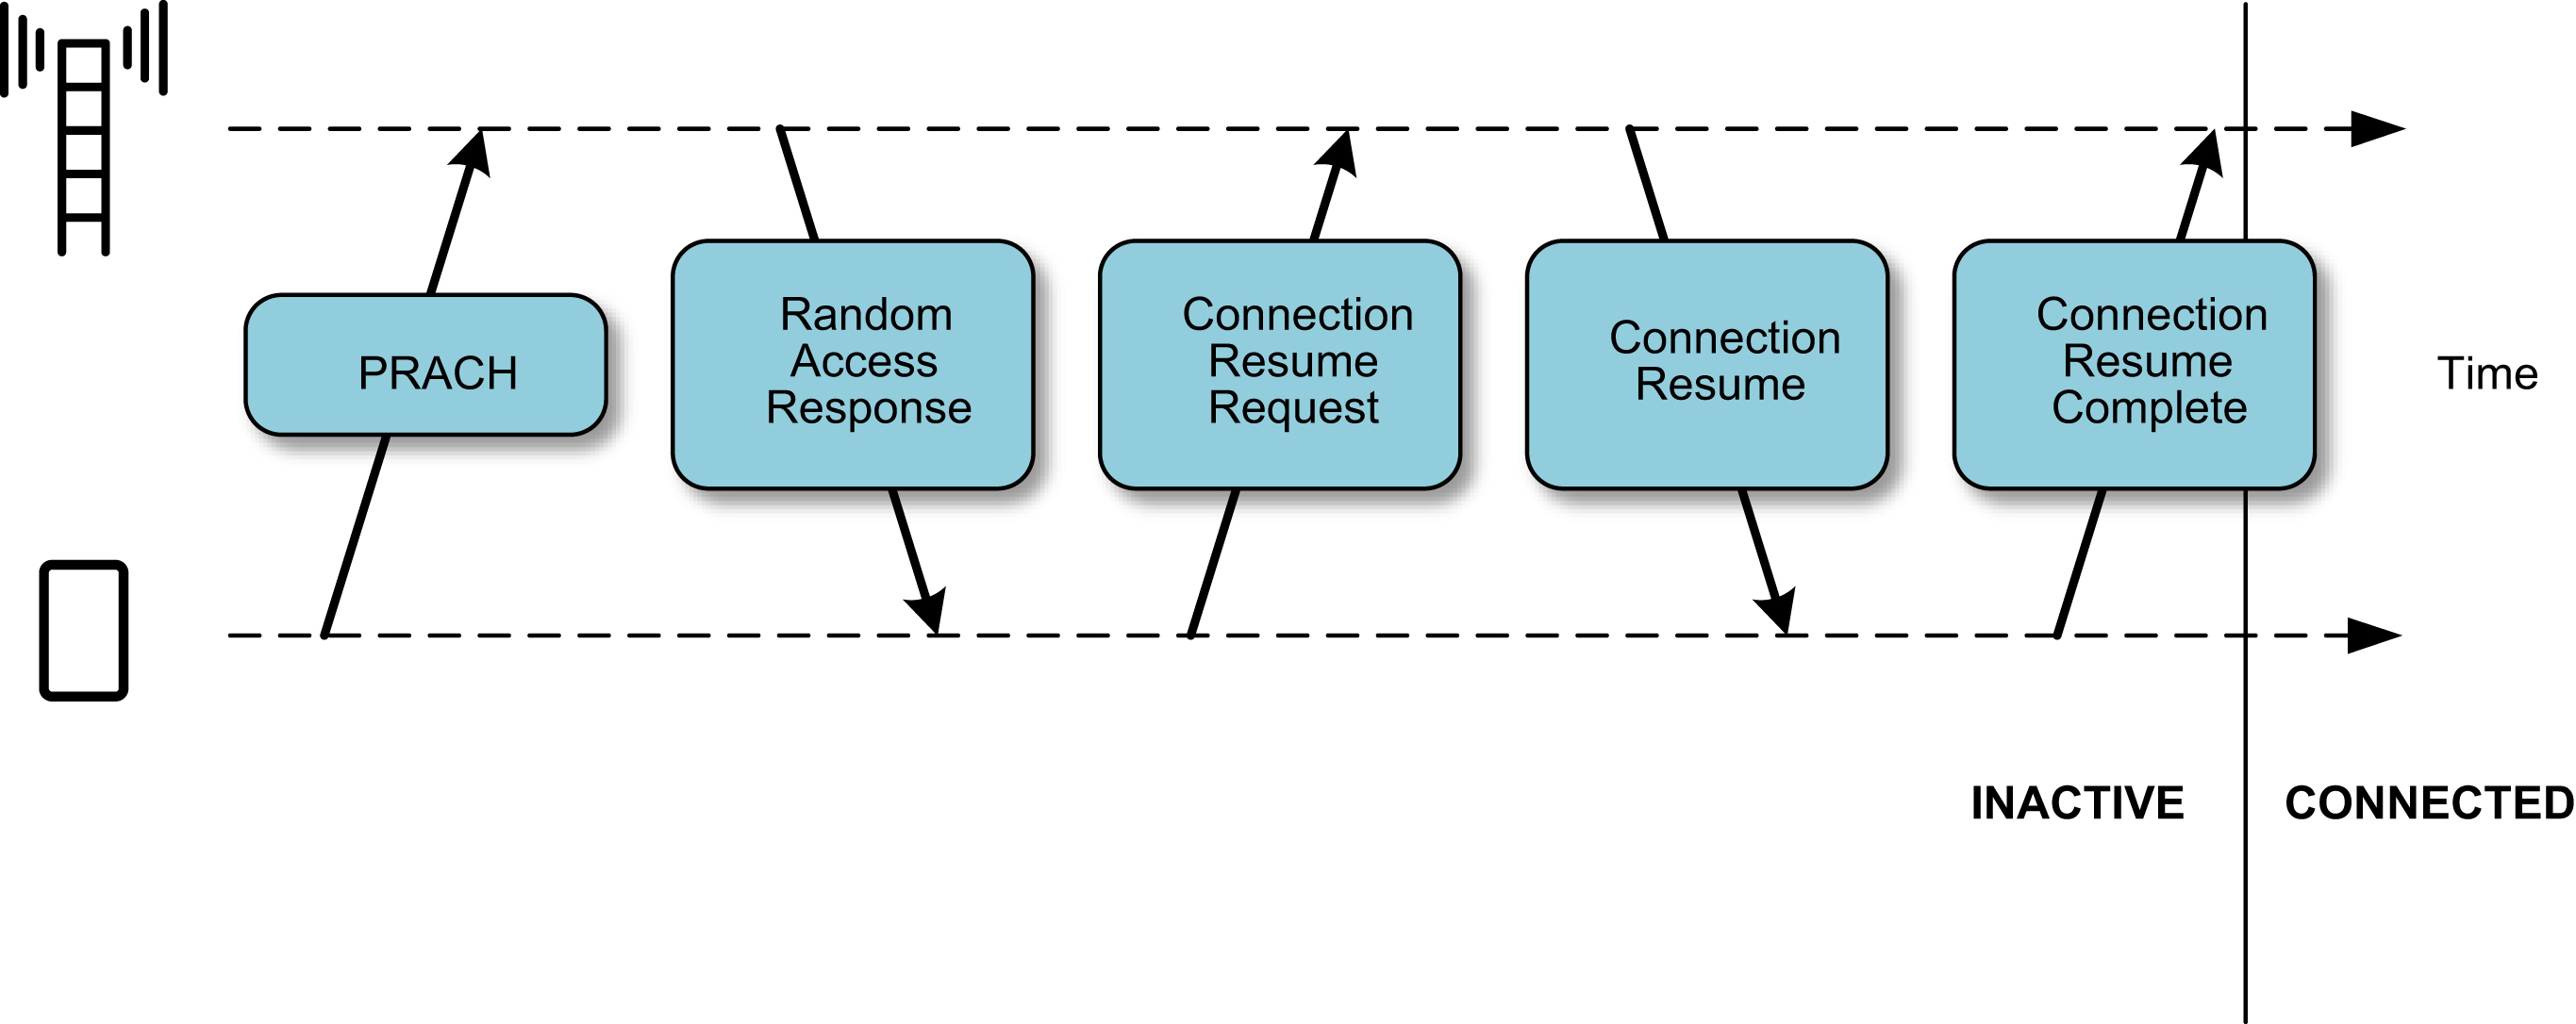
As was outlined in Section 12.1.2 the study of CP latency is taken to be the study of the latency for the transition from INACTIVE to CONNECTED state. This delay represents passing through the random access sequence and will be present during handover between cells,
and also during RRC reconfiguration for state transition and uplink synchronization, as was mentioned in Chapter 11. The sequence of signals exchanged during the state transition is illustrated in Fig. 12.3, and we assume that the latency covers the time from waiting for a PRACH opportunity in the device until RRC Connection Resume Request is processed in the gNB.
Table 12.5
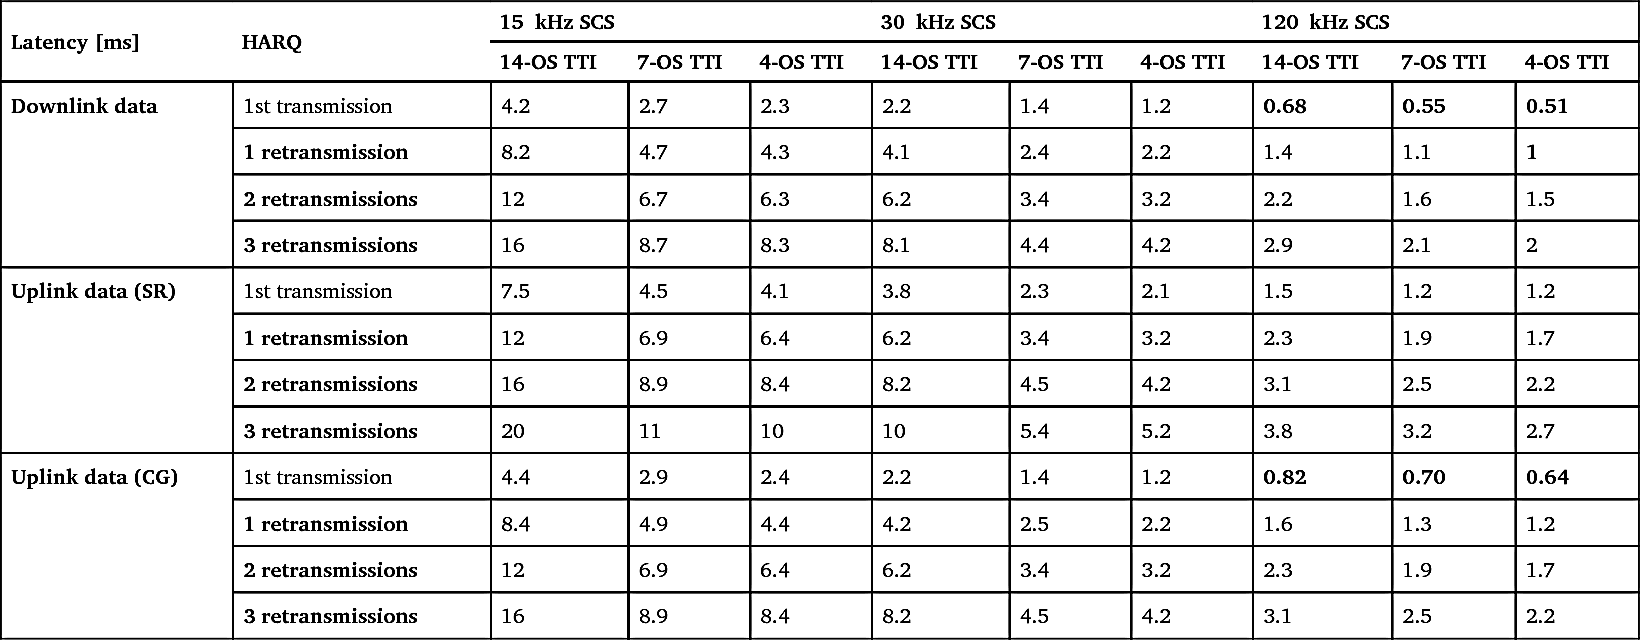
Table 12.6
The latency associated with the CP signaling can be estimated from the same delays used for UP data, i.e. assuming the same processing (
t
b
 and
and
d
2
 ) and slot alignment delays as in Section 12.2.1.2. But we must also take the significant processing associated with RRC updates, which is assumed to be a 3
ms additional delay on both device and gNB sides [3]. The different signaling steps are presented in Table 12.7, together with values for the processing components. For PRACH it is assumed here that a short preamble is used with a format fitting within the TTI (with or without repetition), so that one entire TTI is used for transmitting it.
 and
and
 ) and slot alignment delays as in Section 12.2.1.2. But we must also take the significant processing associated with RRC updates, which is assumed to be a 3
ms additional delay on both device and gNB sides [3]. The different signaling steps are presented in Table 12.7, together with values for the processing components. For PRACH it is assumed here that a short preamble is used with a format fitting within the TTI (with or without repetition), so that one entire TTI is used for transmitting it.
) and slot alignment delays as in Section 12.2.1.2. But we must also take the significant processing associated with RRC updates, which is assumed to be a 3
ms additional delay on both device and gNB sides [3]. The different signaling steps are presented in Table 12.7, together with values for the processing components. For PRACH it is assumed here that a short preamble is used with a format fitting within the TTI (with or without repetition), so that one entire TTI is used for transmitting it.We study the latency for slot (14 OS) and 7 OS mini-slot. With different numerologies and therefrom depending TTI duration the CP latency will differ strongly due to the many steps, as is seen in Table 12.8 for FDD, where the accuracy in the calculation is on OFDM symbol level instead. The latency levels required (20
ms) and encouraged (10
ms) by ITU are seen to be comfortably fulfilled for all (20
ms)/most (10
ms) of the possible configurations in NR.
Also with TDD these targets for CP latency can be reached, but the levels are higher than with FDD, as expected from the additional downlink-uplink alignment delay. The values for an alternating DL-UL-DL-UL slot pattern are given in Table 12.9, and for a downlink-heavier DL-DL-DL-UL slot pattern in Table 12.10, also here with a symbol level accuracy in the calculation.
12.2.2. Reliability
What we are interested in when it comes to reliability is that a certain data packet (of a certain size) is delivered to the receiver with high probability, considering an upper latency bound, as outlined in Section 12.1.3. The total reliability of the packet delivery can be seen as
increasing over time with an increasing number of transmission attempts (HARQ retransmissions). In other words, the task is then to be able to estimate the probability of success in the receiver as a function of attempts within the latency bound. While doing this we should take the potential failure of all essential physical channels into account. In this evaluation we will only consider FDD, since reaching the reliability target with one configuration is sufficient.
Table 12.7
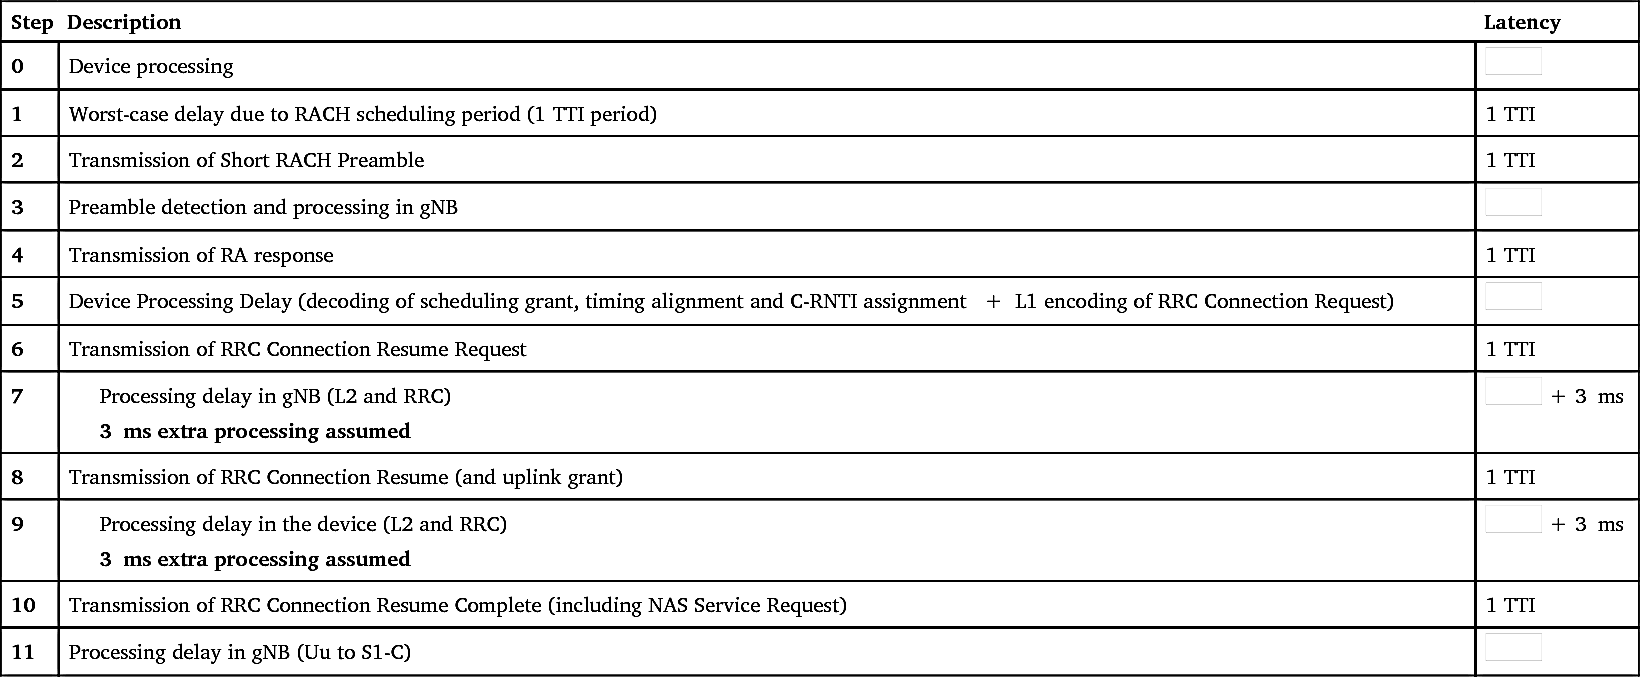
Table 12.8
| CP latency (ms) | 15 kHz SCS | 30 kHz SCS | 60 kHz SCS | 120 kHz SCS |
|---|---|---|---|---|
| Slot (14-symbol TTI) | 15.4 | 10.7 | 8.4 | 7.9 |
| Mini-slot (7-symbol TTI) | 10.9 | 8.4 | 7.9 | 7.7 |

Table 12.9
| CP latency (ms) | 15 kHz SCS | 30 kHz SCS | 60 kHz SCS | 120 kHz SCS |
|---|---|---|---|---|
| Slot (14-symbol TTI) | 18.4 | 12.2 | 9.2 | 8.3 |
| Mini-slot (7-symbol TTI) | 12.9 | 9.4 | 8.4 | 7.9 |

Table 12.10
| CP latency (ms) | 15 kHz SCS | 30 kHz SCS | 60 kHz SCS | 120 kHz SCS |
|---|---|---|---|---|
| Slot (14-symbol TTI) | 20.4 | 13.2 | 9.7 | 9.1 |
| Mini-slot (7-symbol TTI) | 18.4 | 12.2 | 9.4 | 8.4 |

12.2.2.1. Reliability of physical channels
First, we need to study the success rate of the physical channels we described in Chapter 11: PDCCH, PDSCH, PUSCH, and PUCCH. This is done through link simulations where the SNR level is swept by changing the noise within the interesting range for mobile communication. By collecting statistics of many simulated transmissions, we can find the error rate as a function of SNR for the relevant channels. Since we know that the success rate will depend not only on SNR but also on code rate, the study is done for a set of modulation and coding schemes (MCSs) for data, and a set of aggregation levels (ALs) for the downlink control in PDCCH.
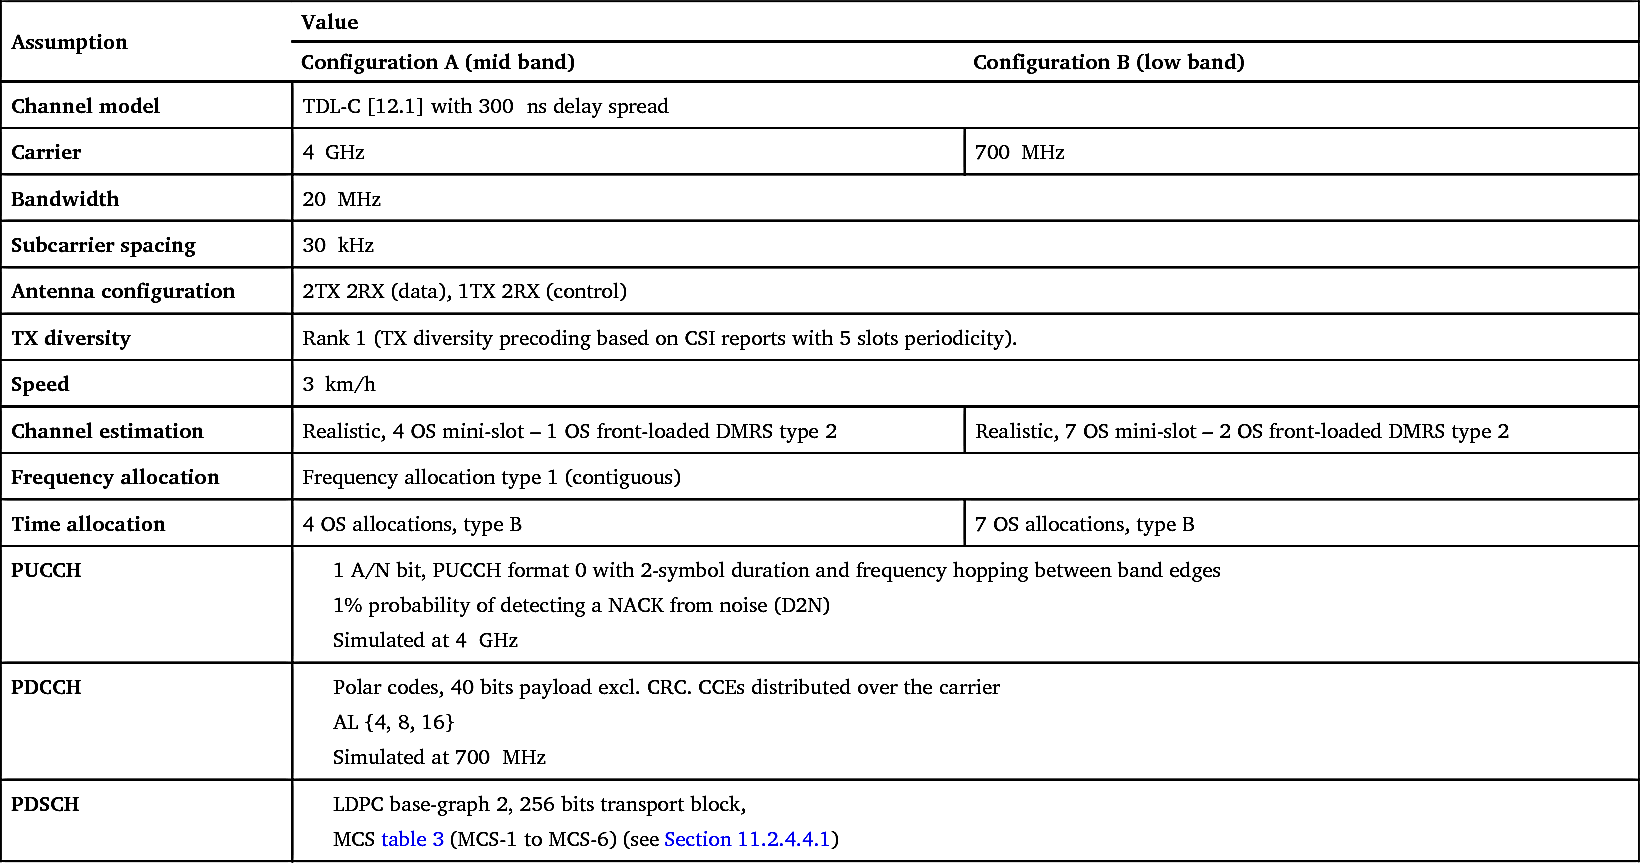
The assumptions for the link level simulations are given in Table 12.11. Three separate simulation data sets are used to represent data, downlink control, and uplink control. For
downlink (PDSCH) and uplink (PUSCH) data the same link evaluation is used, which is possible since the coding, channel estimation, and MCS tables are the same for these channels. For PDCCH a downlink control information (DCI) message of size 40 bits excluding CRC is assumed. For the uplink control on PUCCH we have assumed 1 bit uplink control information (UCI) carried by PUCCH format 0 with 2 OS duration and frequency hopping.
Table 12.11
| Assumption | Value | |
|---|---|---|
| Configuration A (mid band) | Configuration B (low band) | |
| Channel model | TDL-C [12.1] with 300 ns delay spread | |
| Carrier | 4 GHz | 700 MHz |
| Bandwidth | 20 MHz | |
| Subcarrier spacing | 30 kHz | |
| Antenna configuration | 2TX 2RX (data), 1TX 2RX (control) | |
| TX diversity | Rank 1 (TX diversity precoding based on CSI reports with 5 slots periodicity). | |
| Speed | 3 km/h | |
| Channel estimation | Realistic, 4 OS mini-slot – 1 OS front-loaded DMRS type 2 | Realistic, 7 OS mini-slot – 2 OS front-loaded DMRS type 2 |
| Frequency allocation | Frequency allocation type 1 (contiguous) | |
| Time allocation | 4 OS allocations, type B | 7 OS allocations, type B |
| PUCCH |
1 A/N bit, PUCCH format 0 with 2-symbol duration and frequency hopping between band edges
1% probability of detecting a NACK from noise (D2N)
Simulated at 4
GHz
|
|
| PDCCH |
Polar codes, 40 bits payload excl. CRC. CCEs distributed over the carrier
AL {4, 8, 16}
Simulated at 700
MHz
|
|
| PDSCH |
LDPC base-graph 2, 256 bits transport block,
MCS table 3 (MCS-1 to MCS-6) (see Section 11.2.4.4.1)
|
|
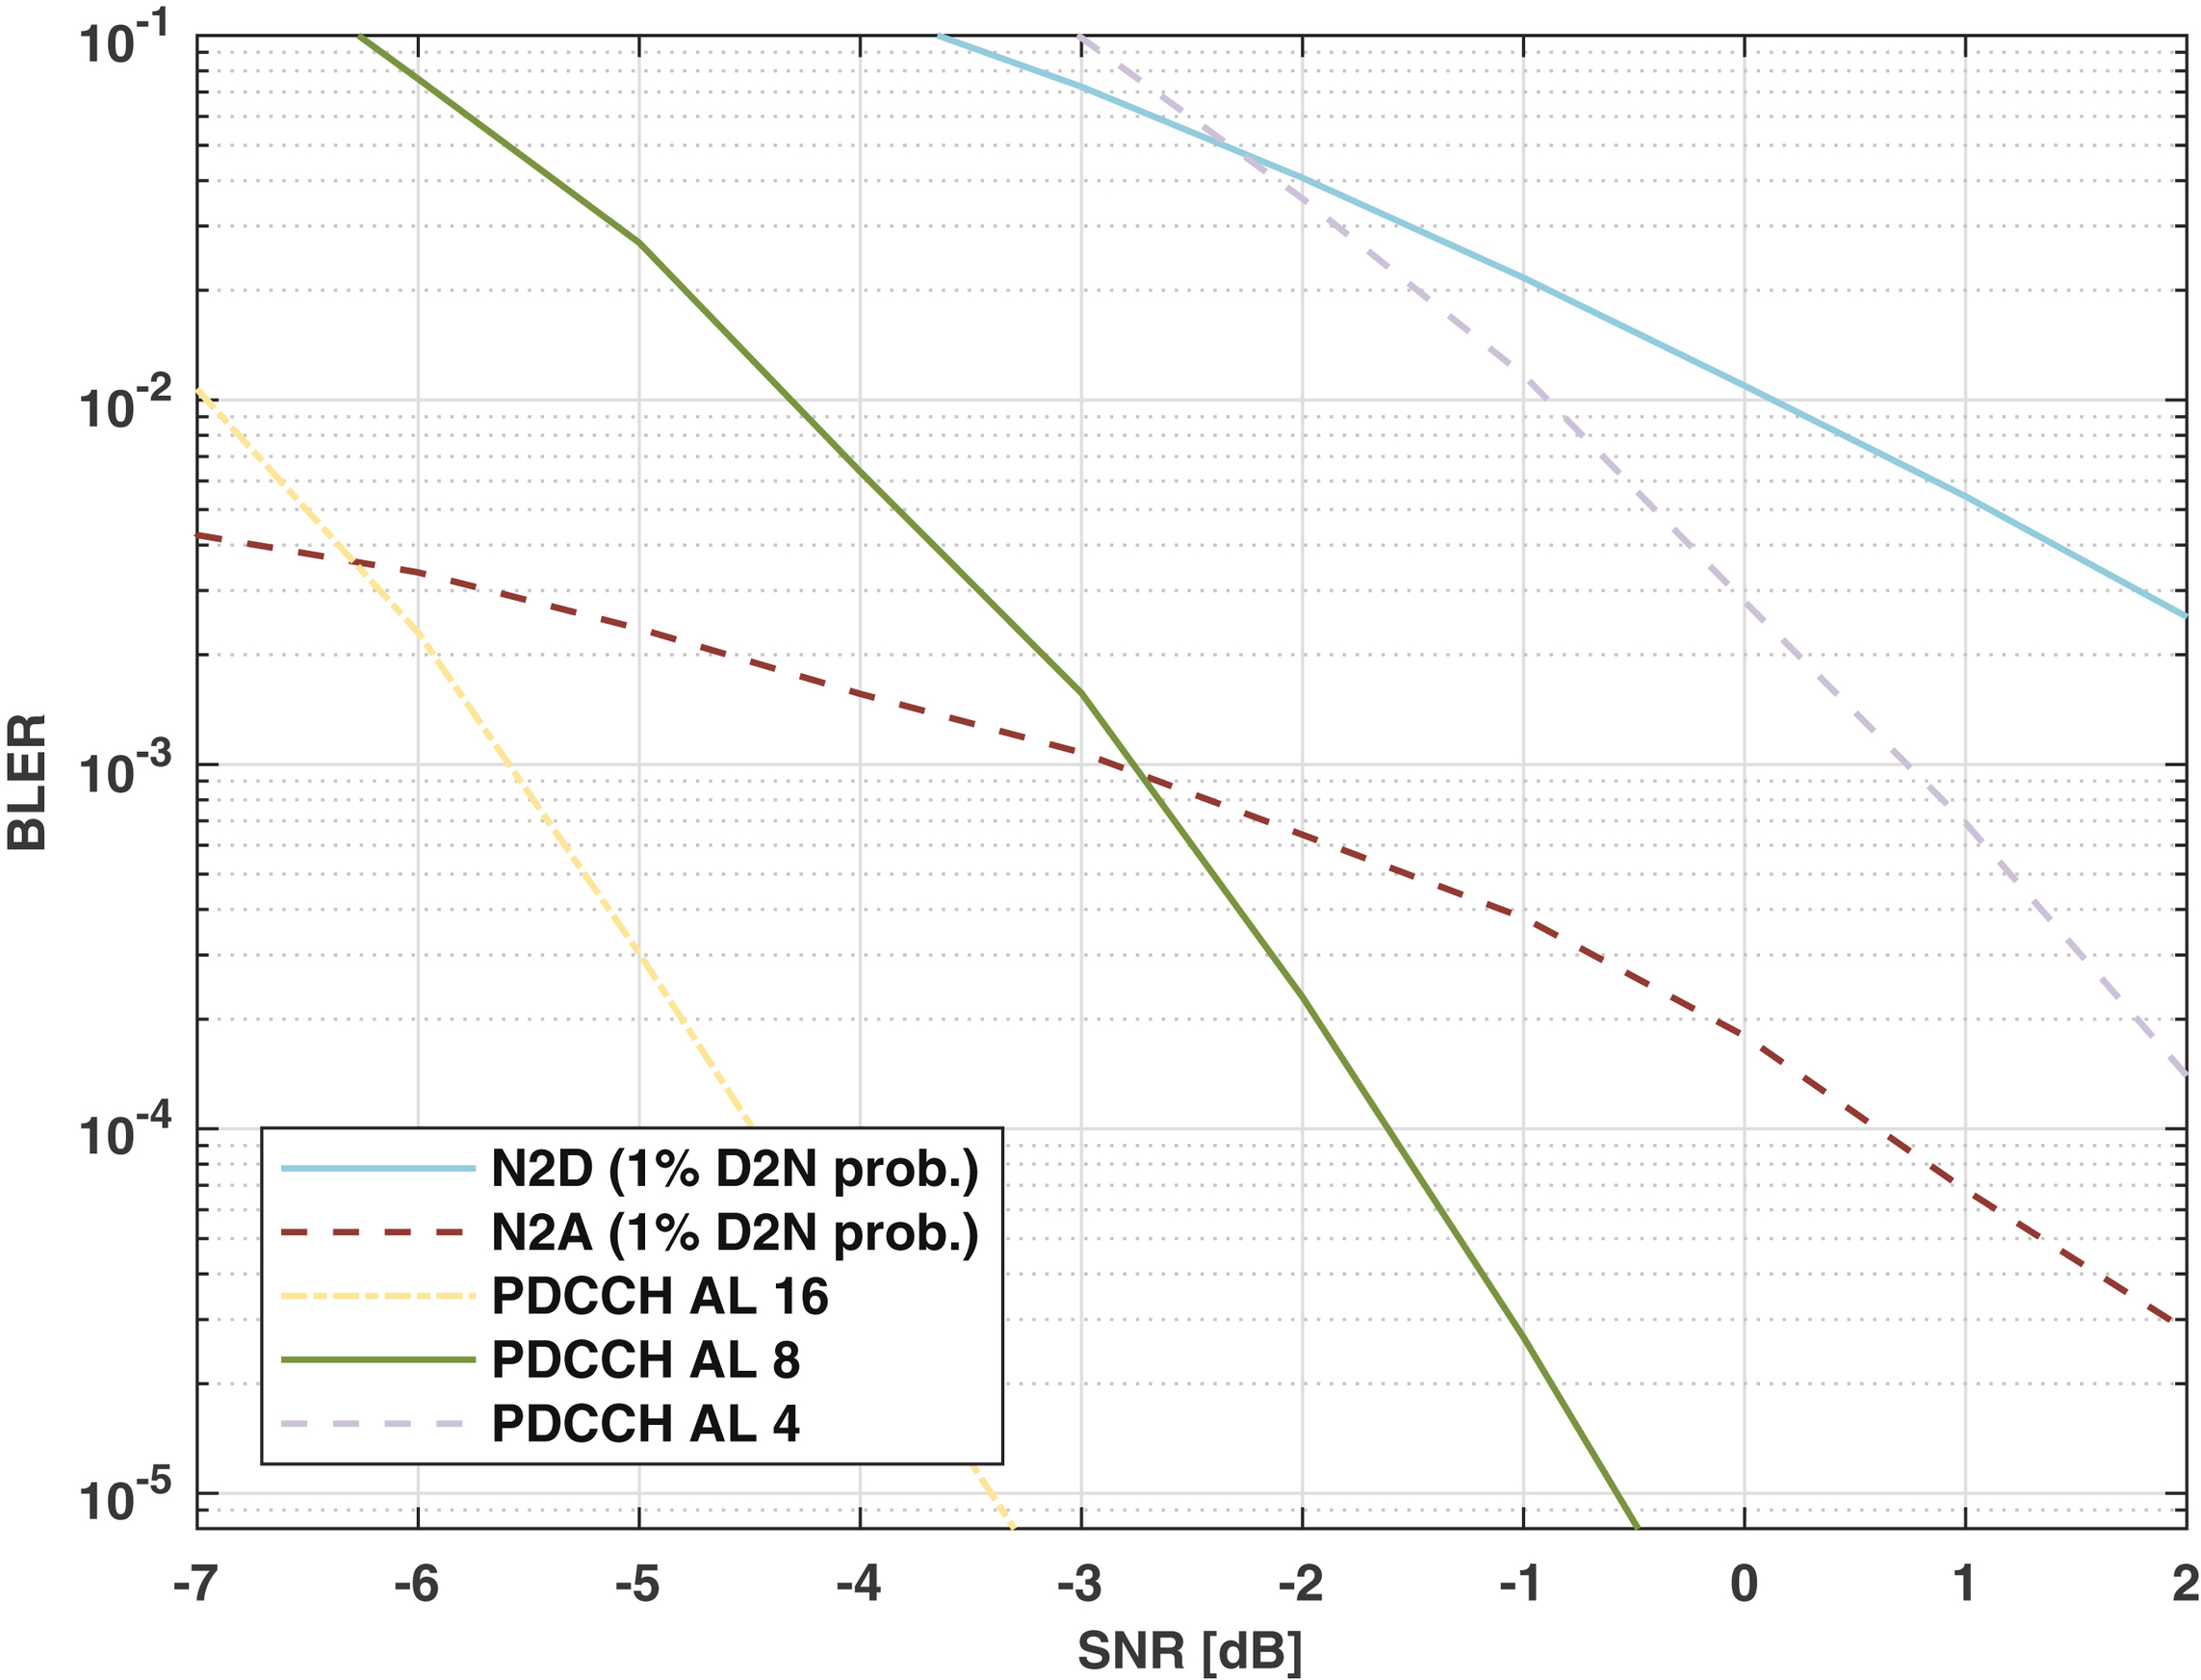
Resulting block-level error rates (BLER) as function of SNR for the control channels are shown in Fig. 12.4, for failed PDCCH and two types of PUCCH errors: N2A, where a NACK is interpreted as an ACK, and N2D where a NACK is not detected. It should be noted that delivering a HARQ ACK is not required for the data to be correctly received, so this step is not taken into account in the latency and reliability calculation. For downlink and uplink control the same evaluation data is used to represent both configurations, which is a reasonable assumption given low expected impact from doppler spread in a short PUCCH transmissions, and since the PDCCH is spread out over the same bandwidth in both cases.
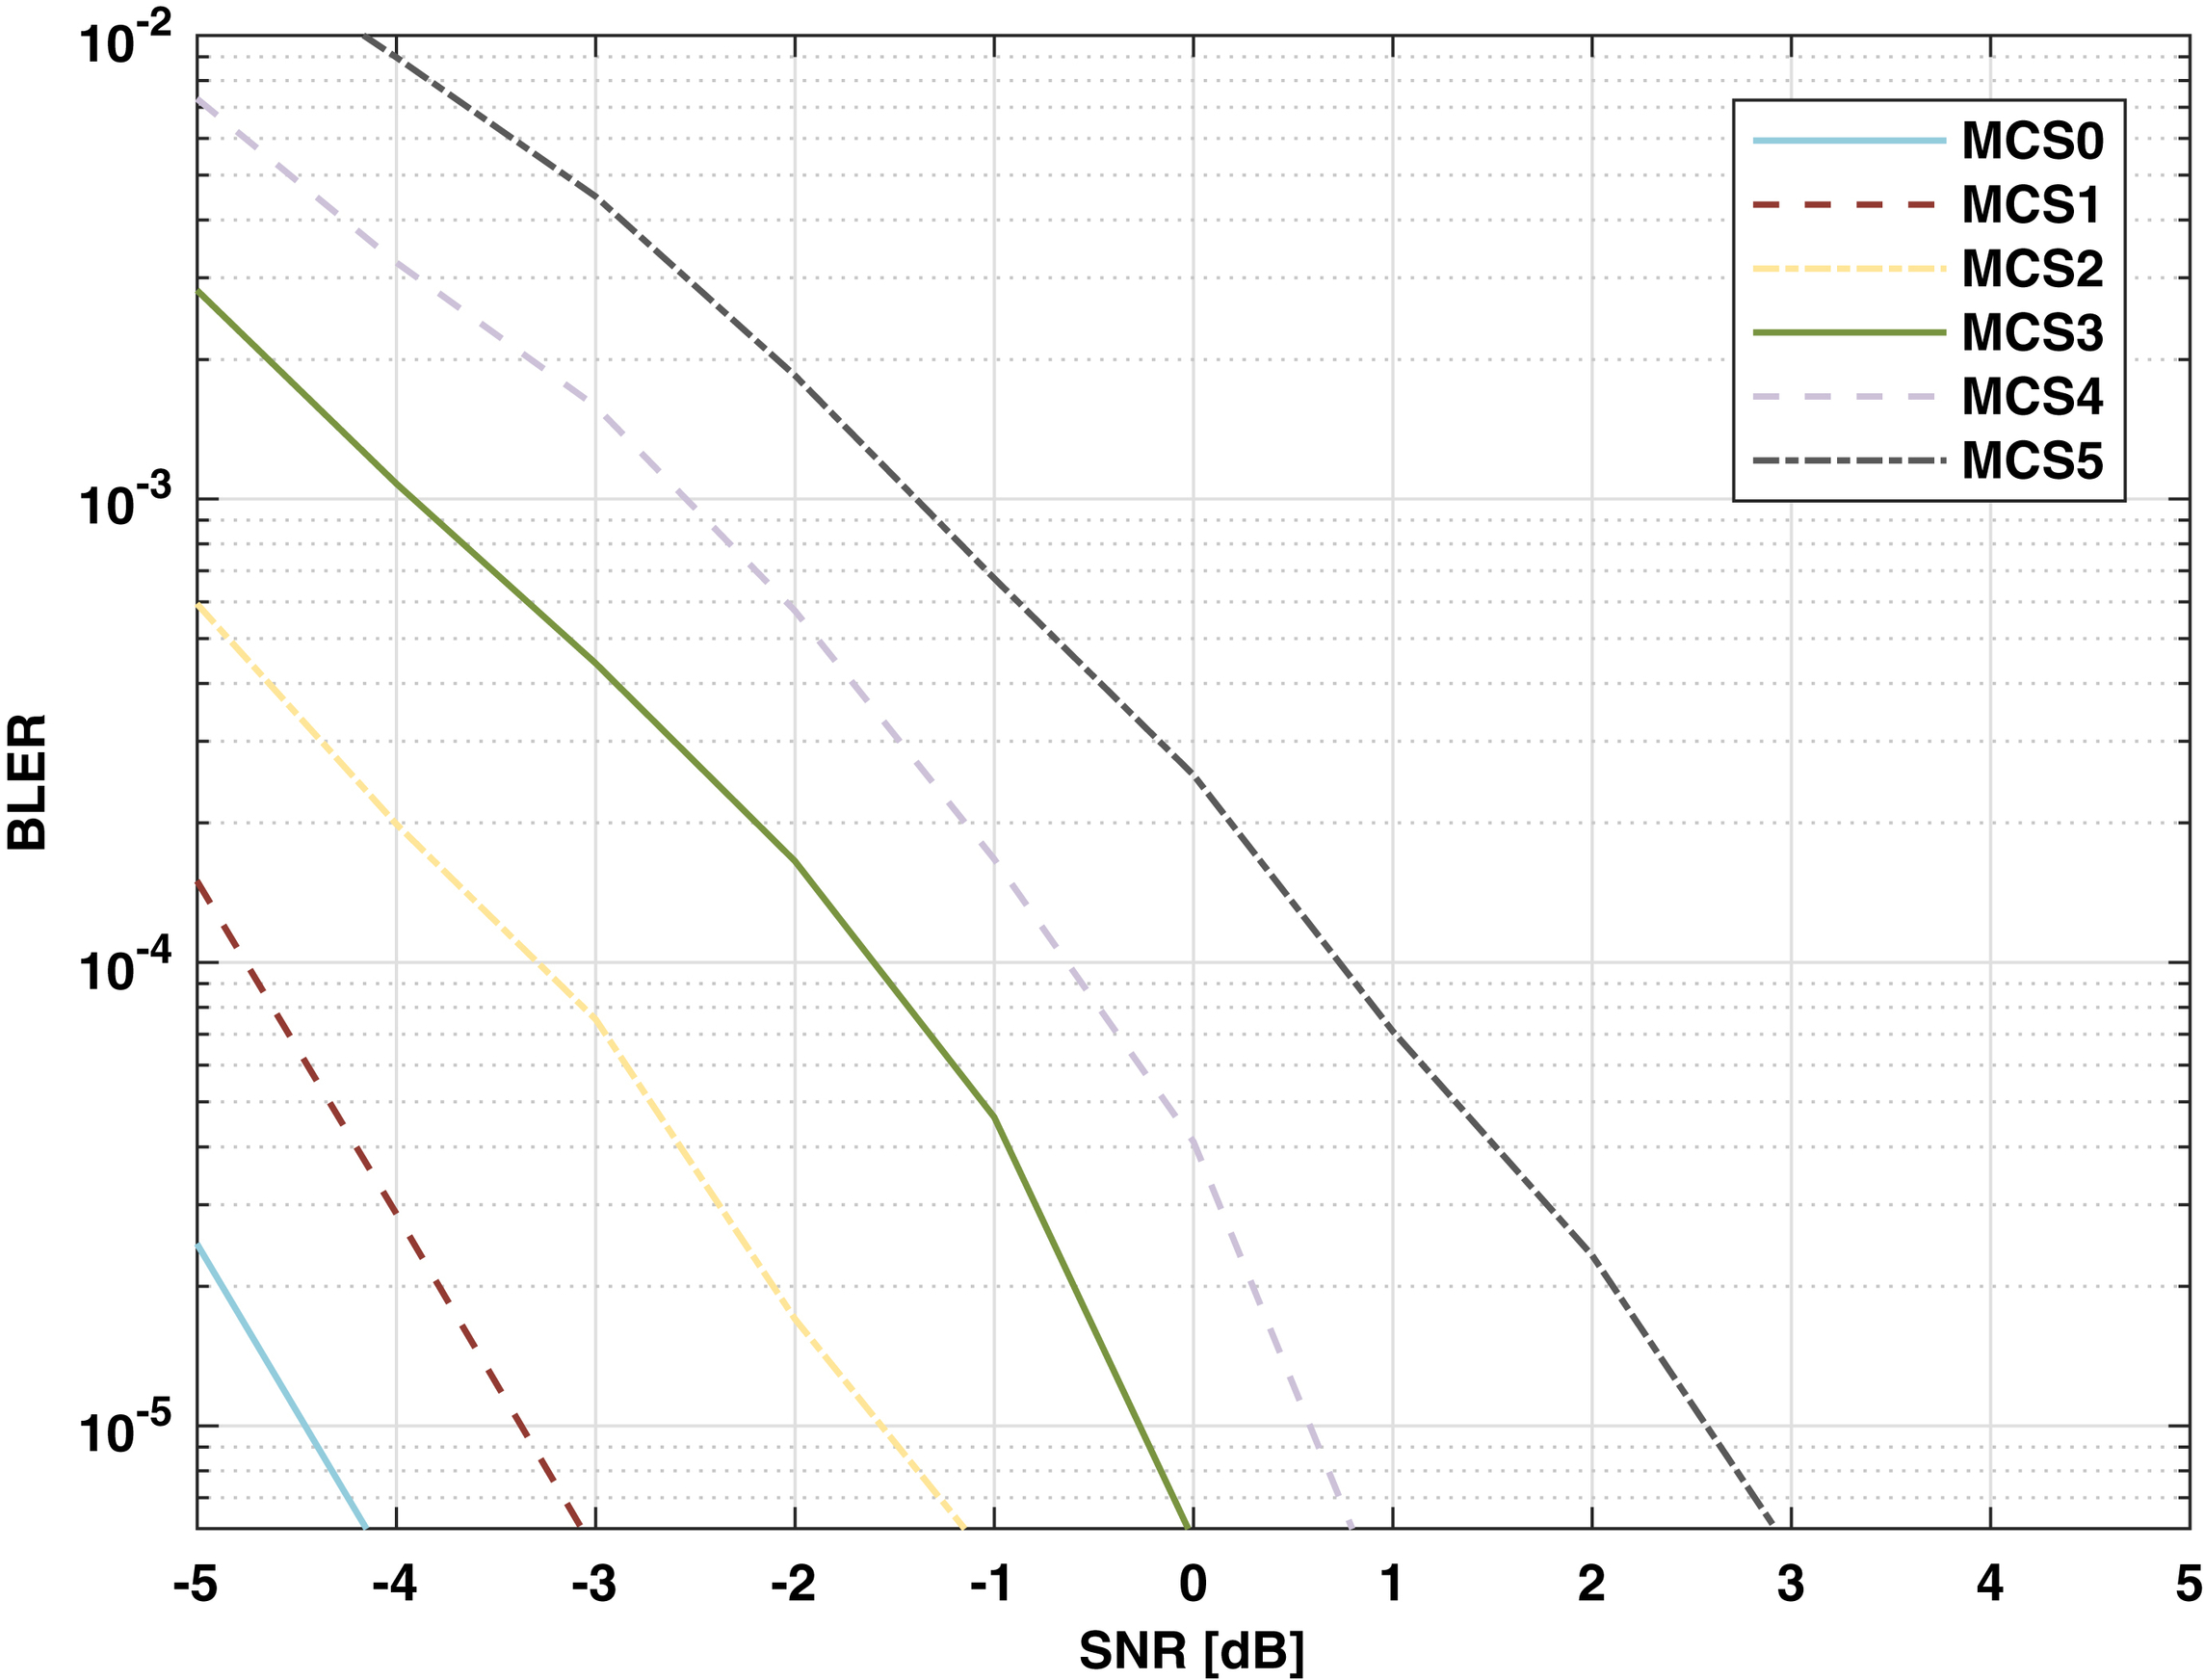
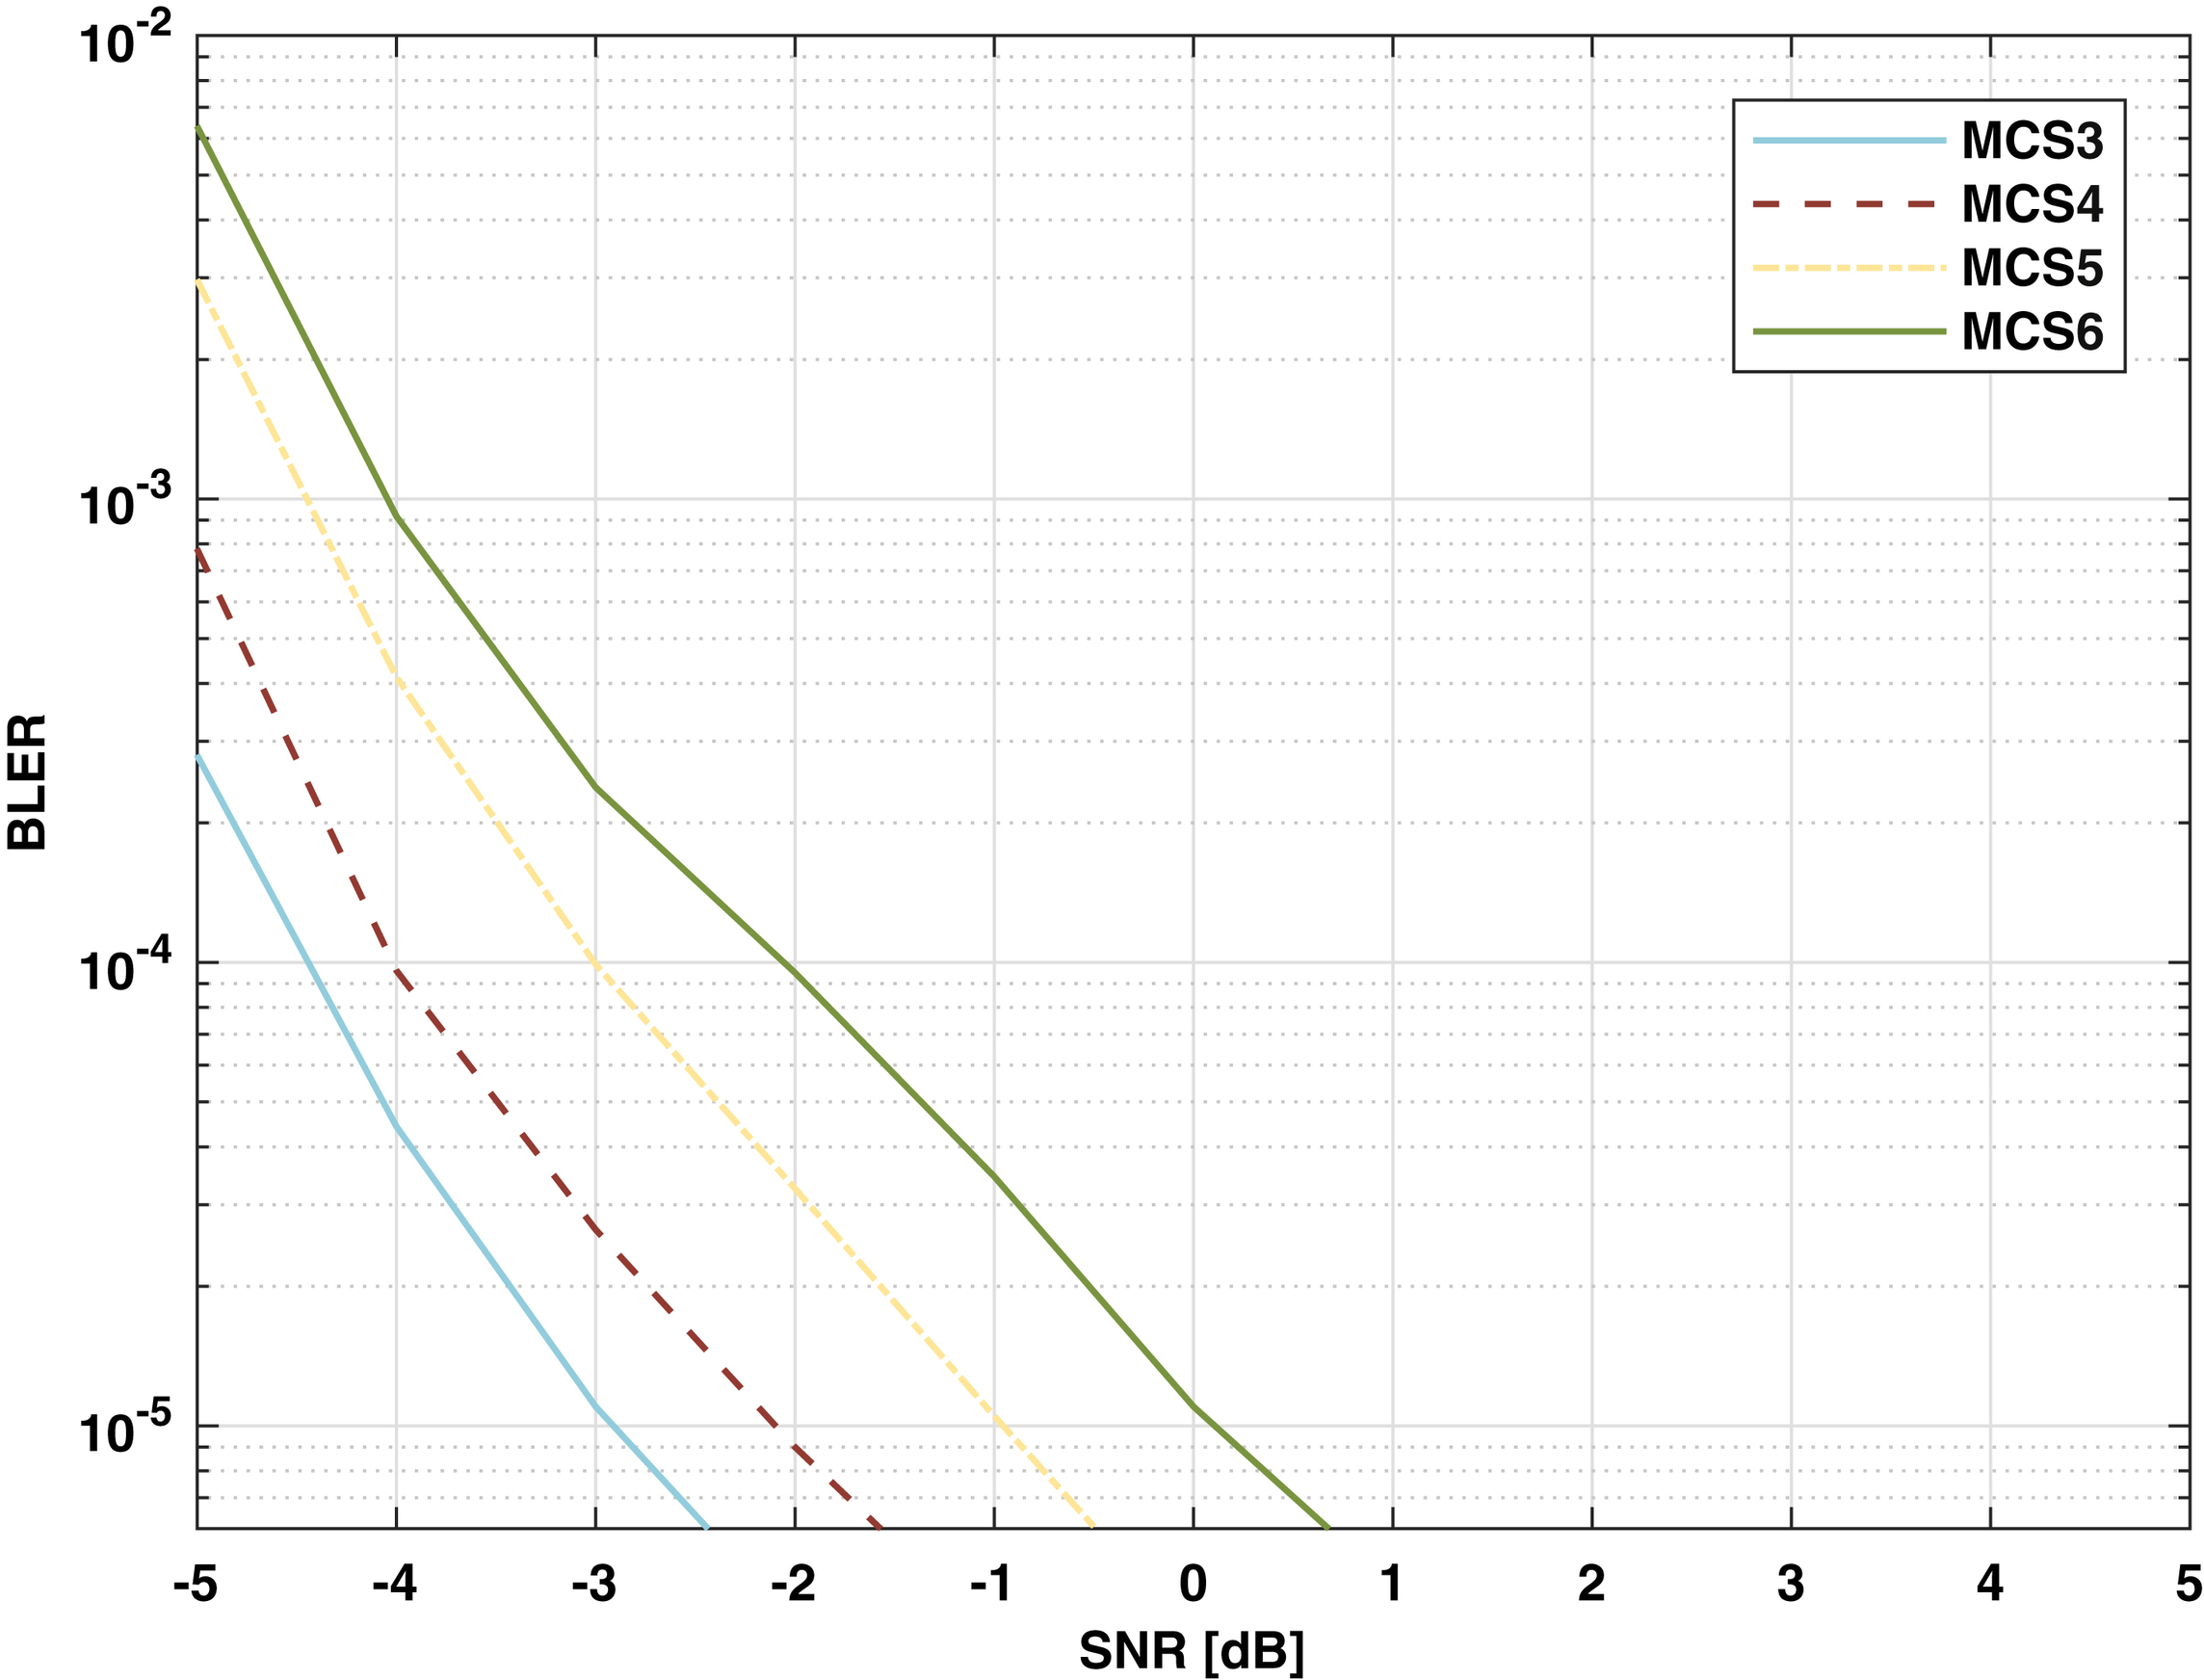
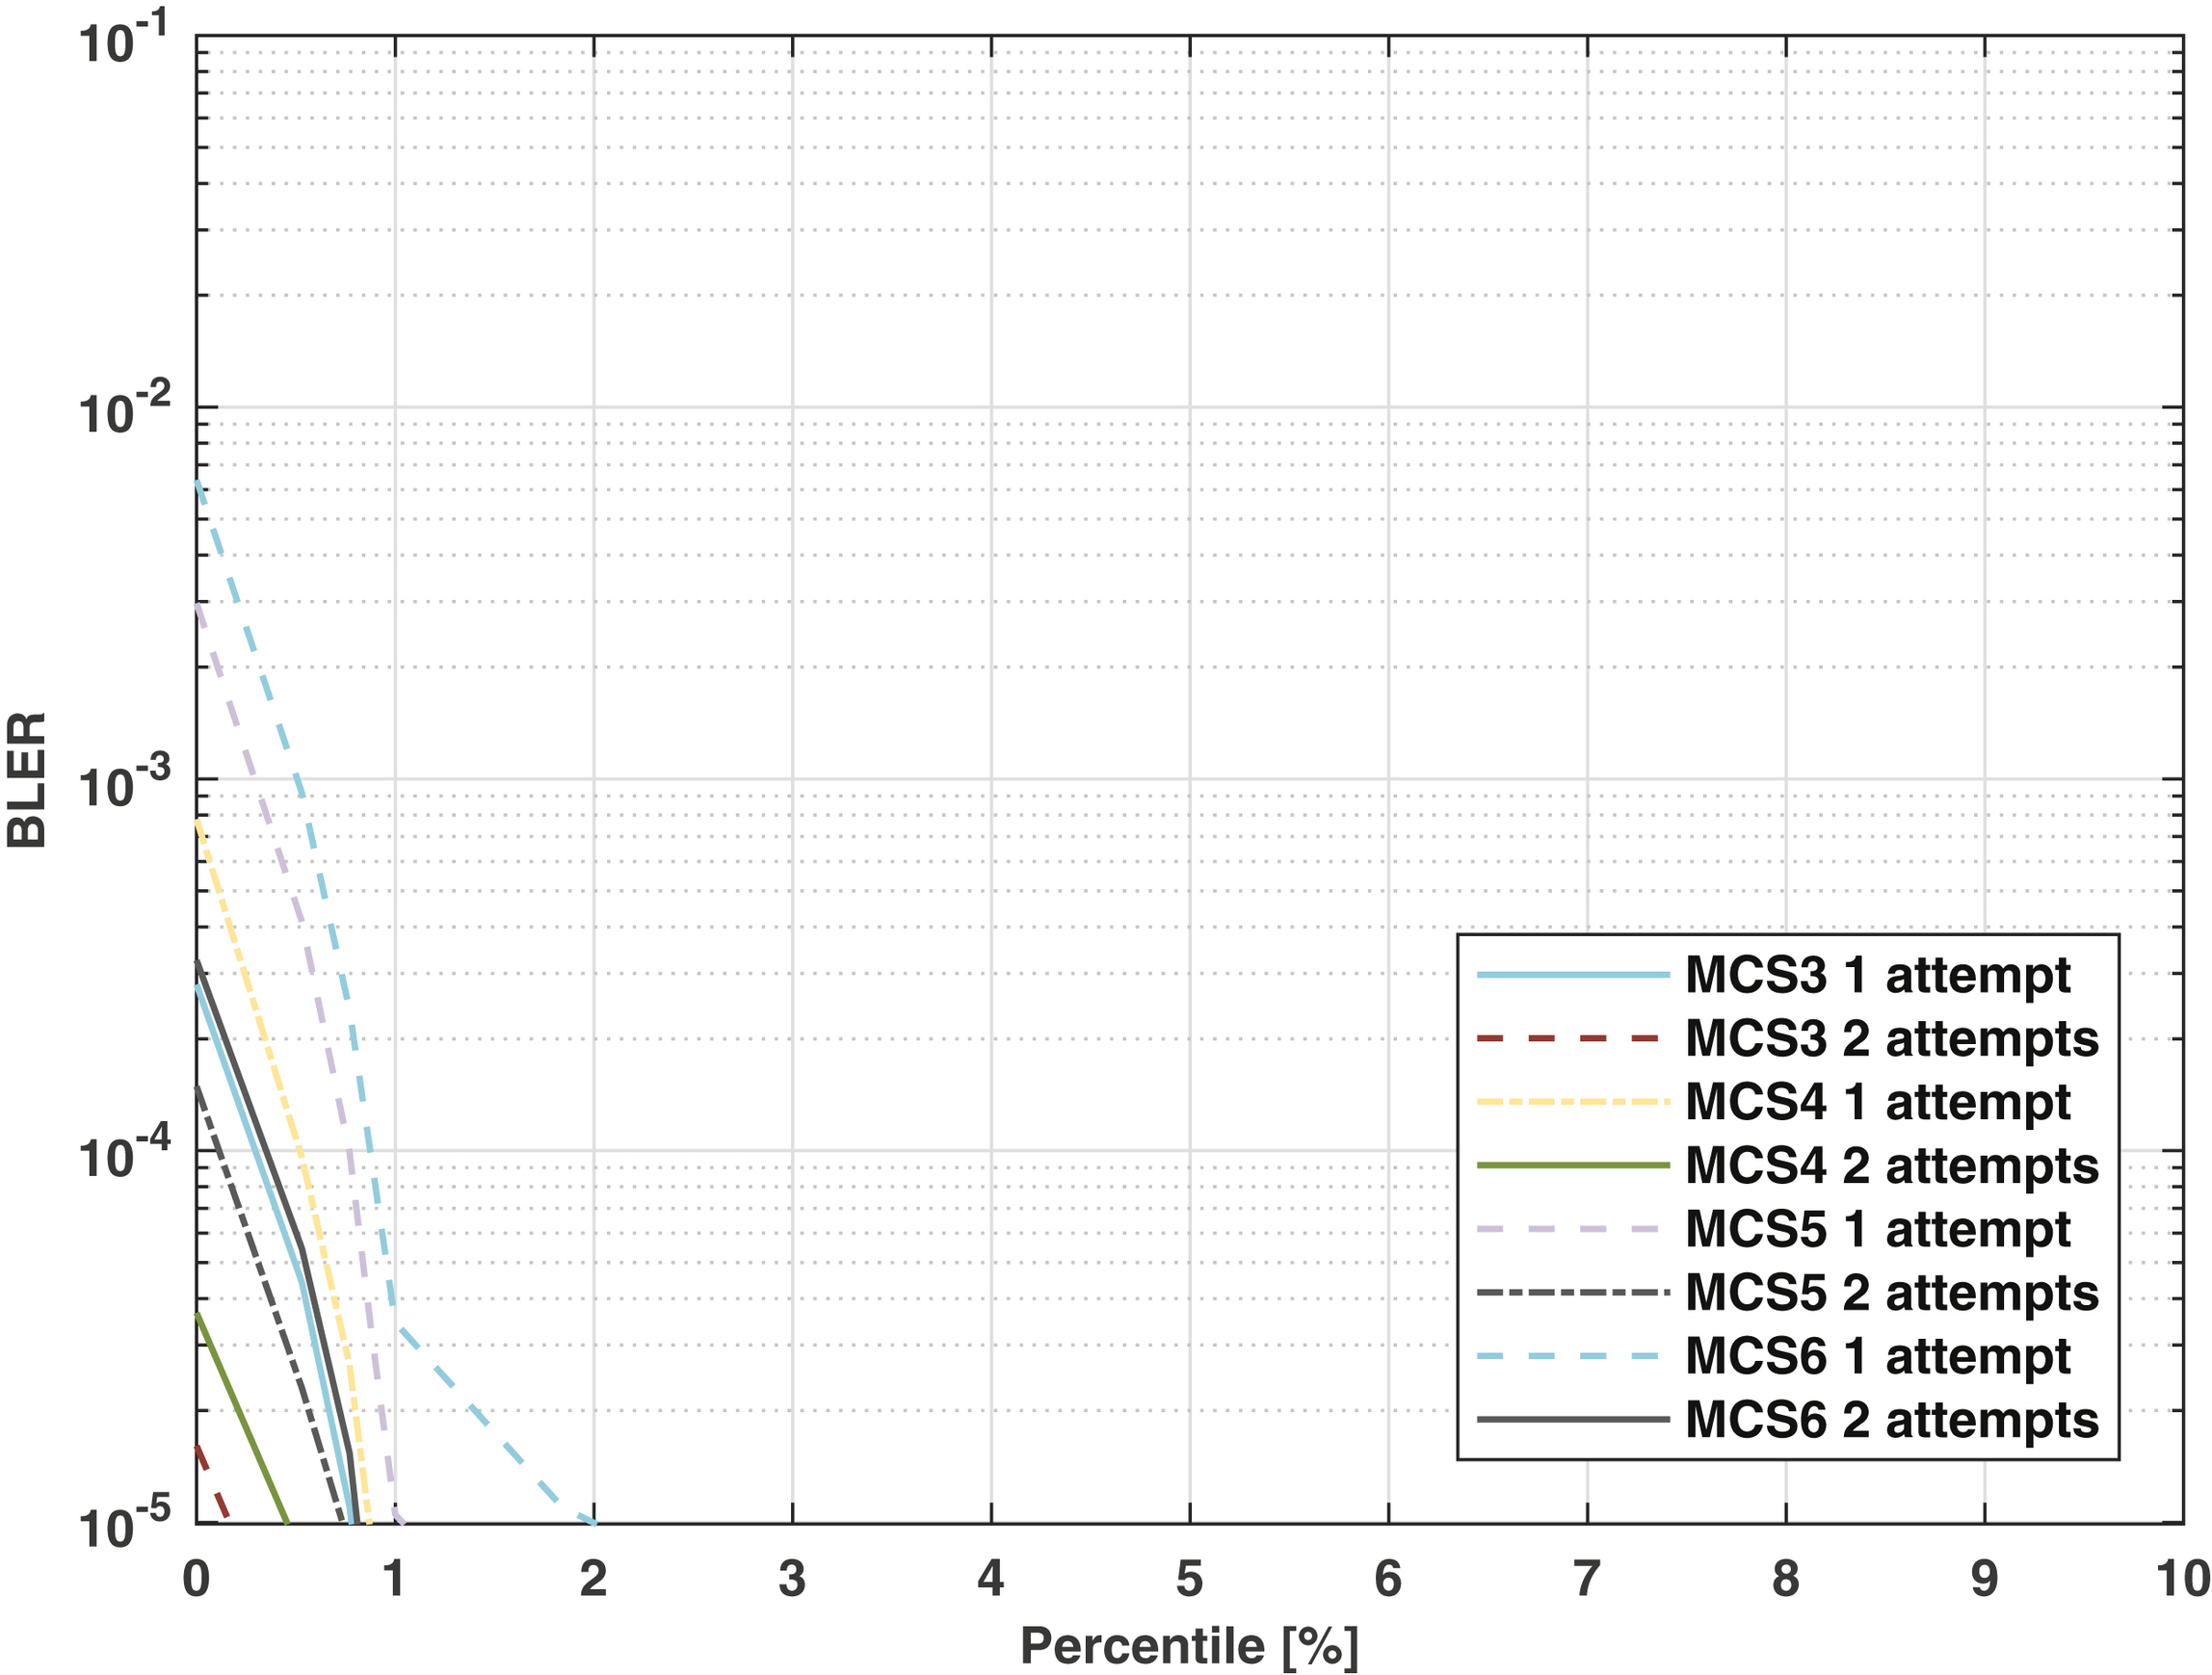
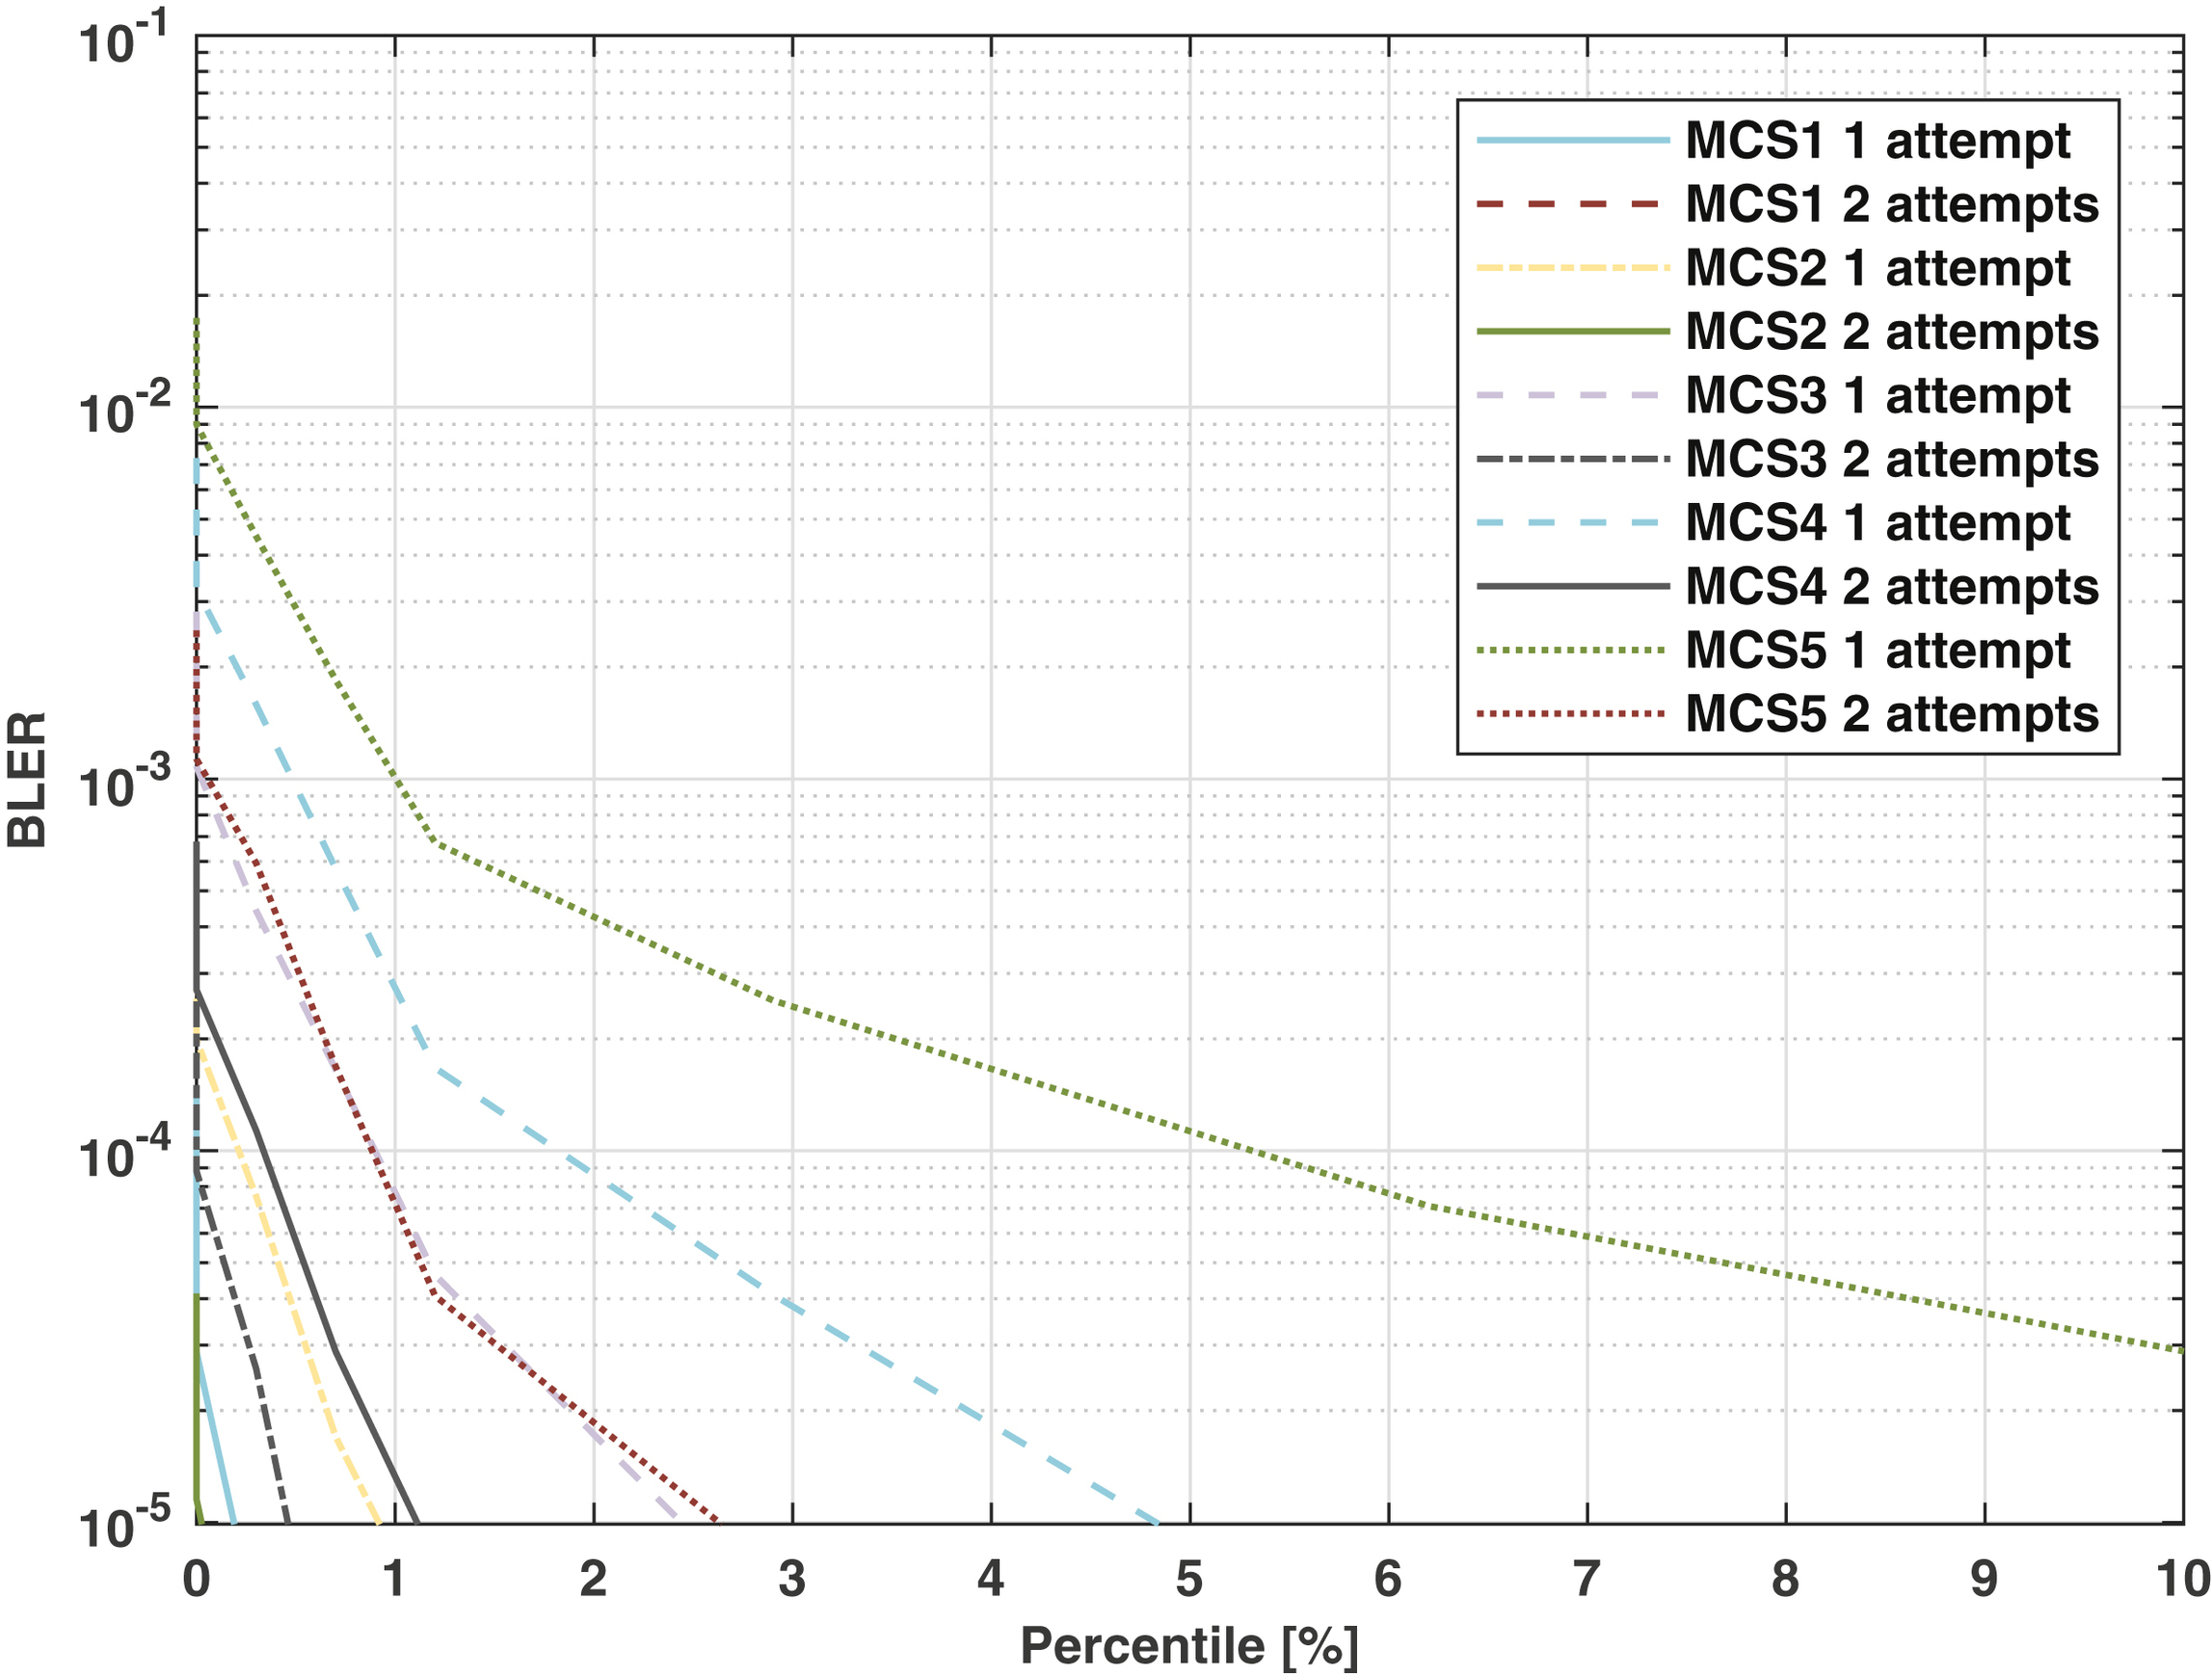
With PDSCH and PUSCH, for first transmission attempt with data in the two configurations, the BLER as function of SNR for the highest MCS in the relevant range are shown in
Fig. 12.5. The relevant SNR range is found from lower percentiles of the system simulations presented below.
12.2.2.2. SINR distributions
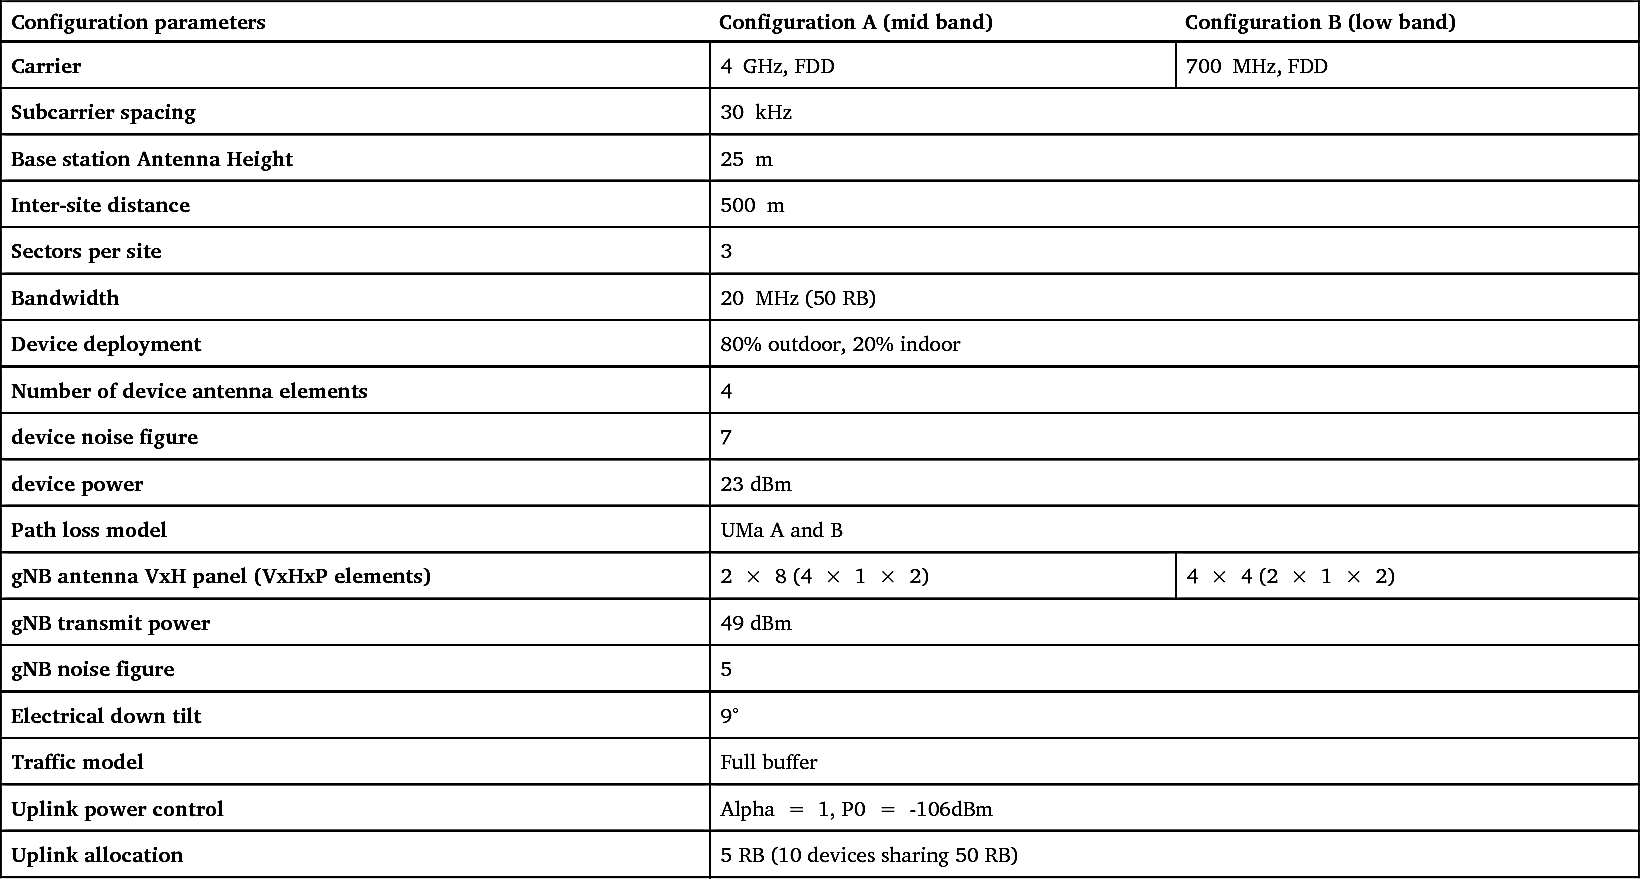
The assumptions for the system level simulations, aimed at finding the SINR distributions for a deployment scenario, are given in Table 12.12, with values that have been aligned with the 3GPP calibration campaign for the evaluation toward the 5G requirements.
The scenario was simulated for the Urban Macro URLLC configuration A (4
GHz) and configuration B (700
MHz) [1], and was evaluated separately for channel models UMa A and UMa B [1]. For Configuration A, the gNB antenna was set to be an array of 2
×
8 vertical x horizontal (VxH) panels each consisting of 4
×
1 V
×
H cross-polarized antenna elements, while in Configuration B it was set to be an array of 4
×
4 V
×
H panels, each consisting of 2
×
1 V
×
H cross-polarized antenna elements. Each array panel corresponds to one antenna port per polarization (P).
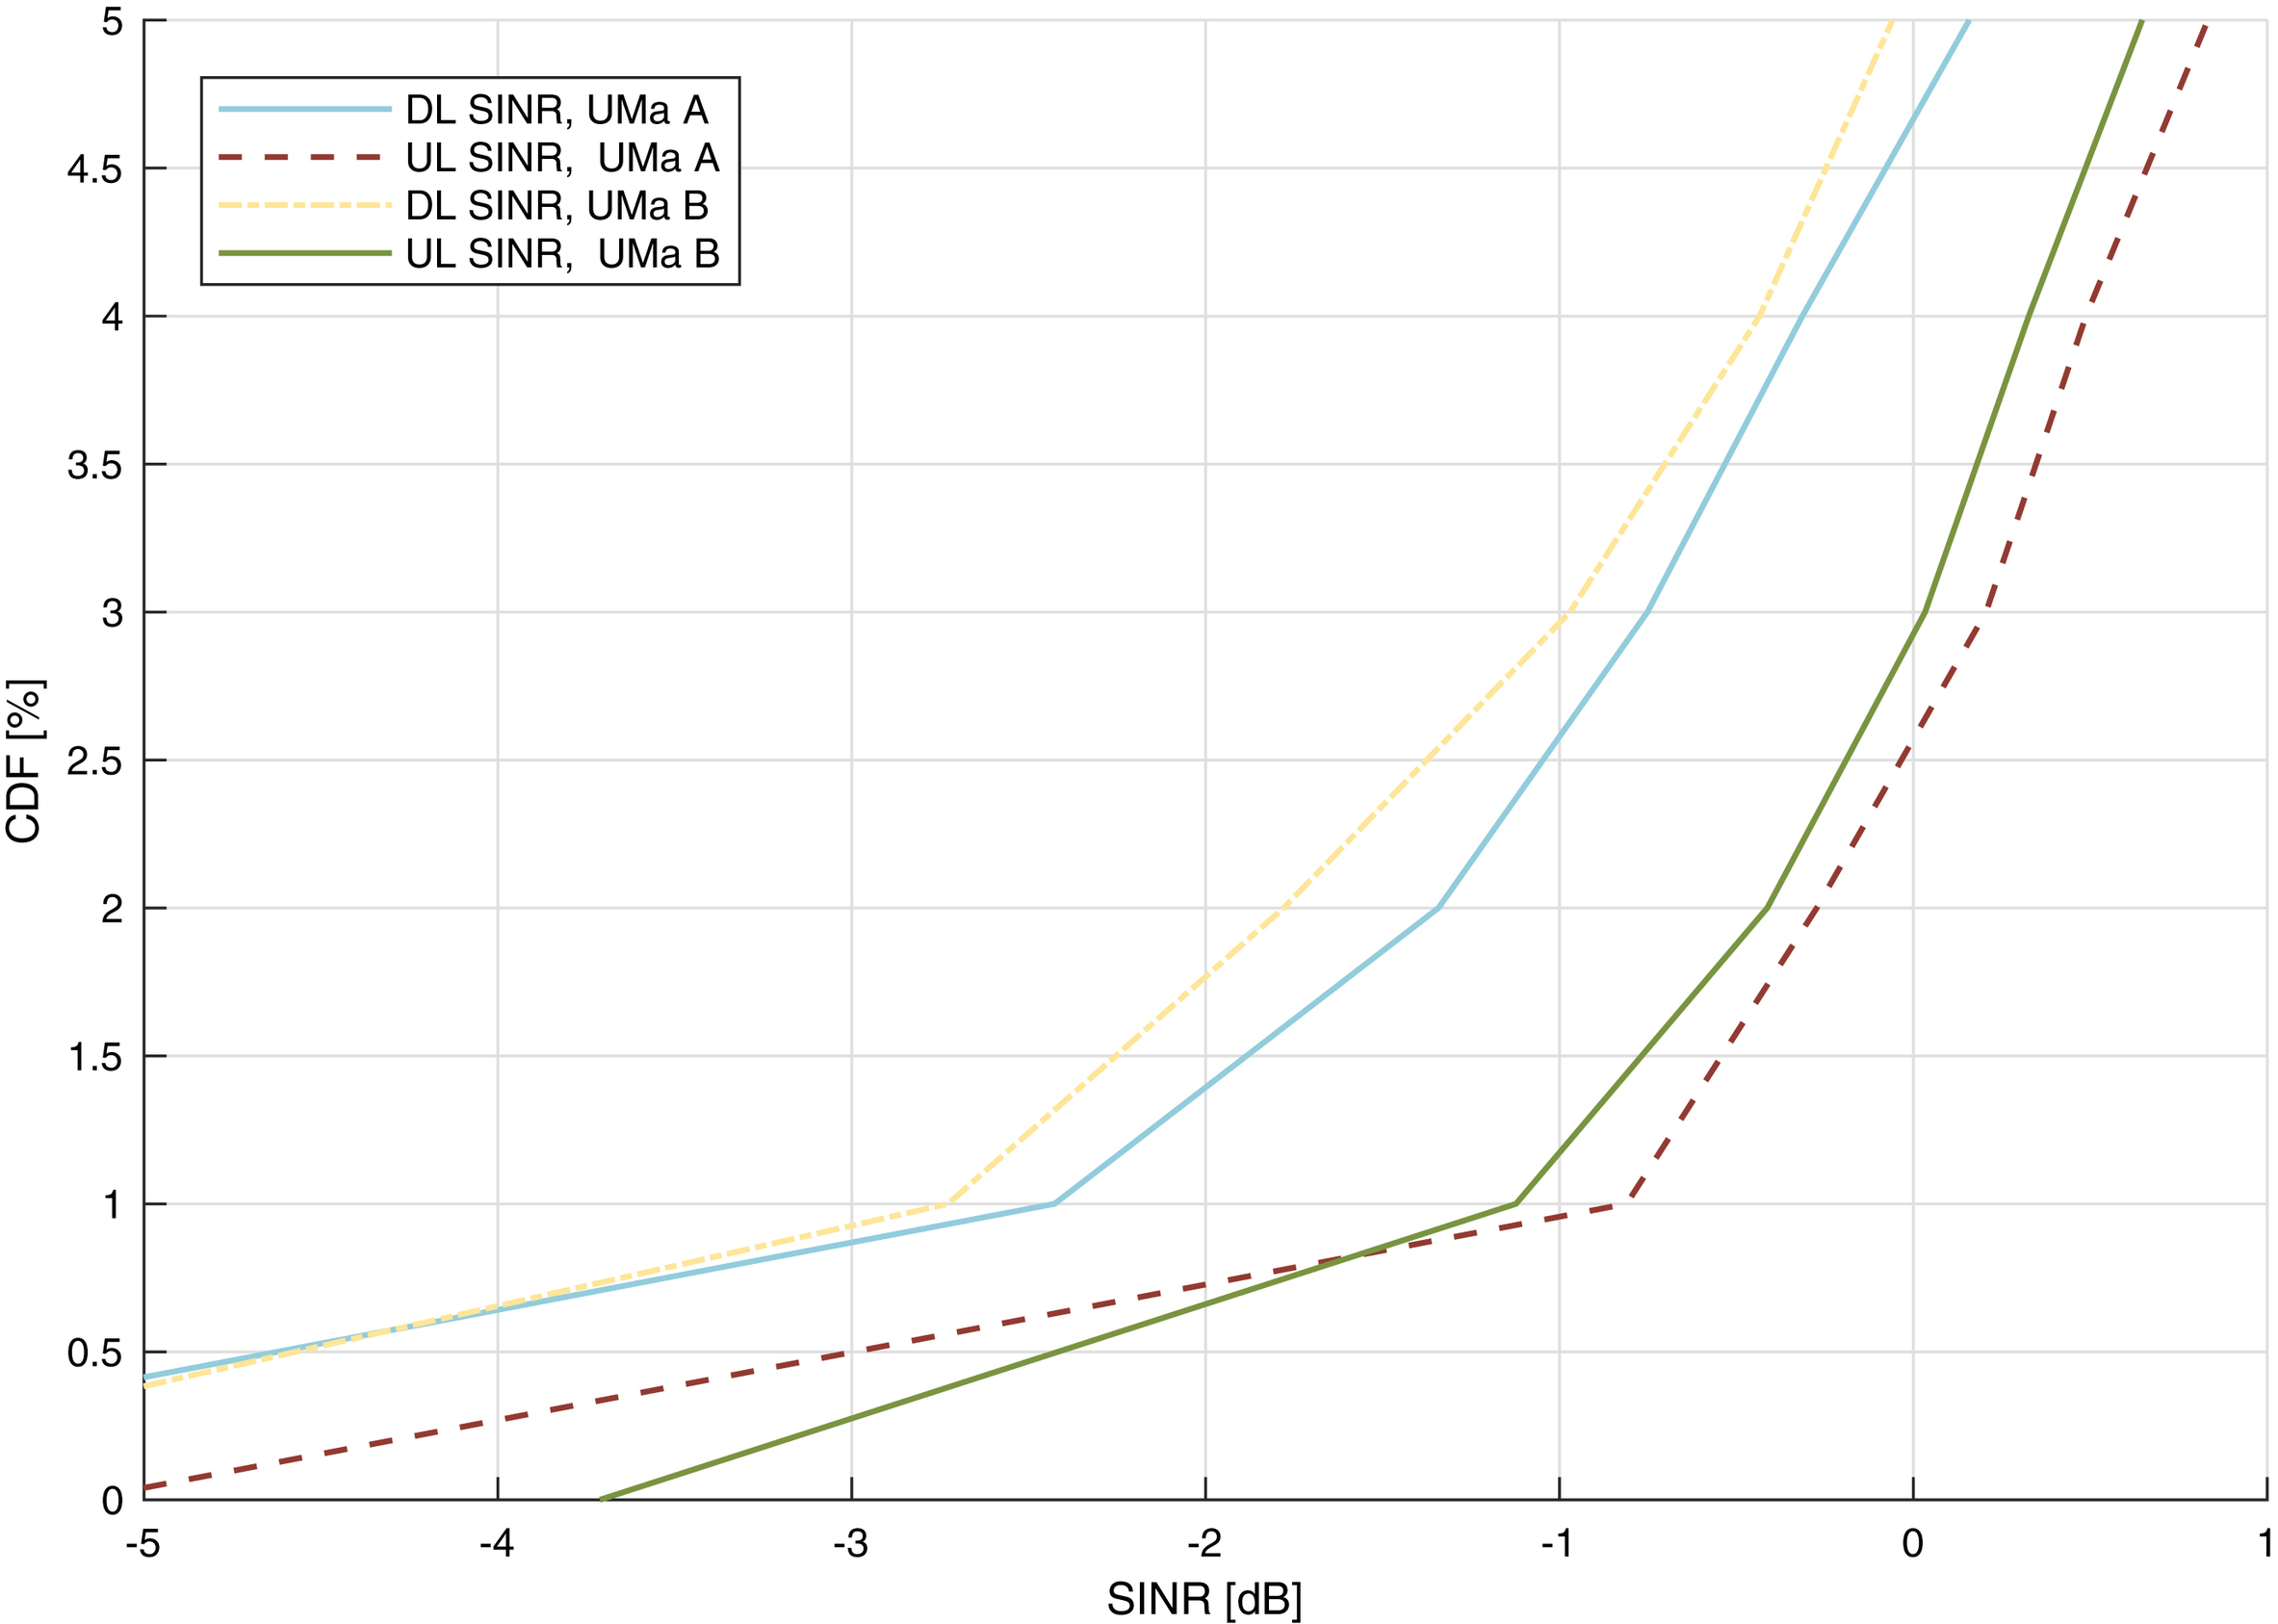
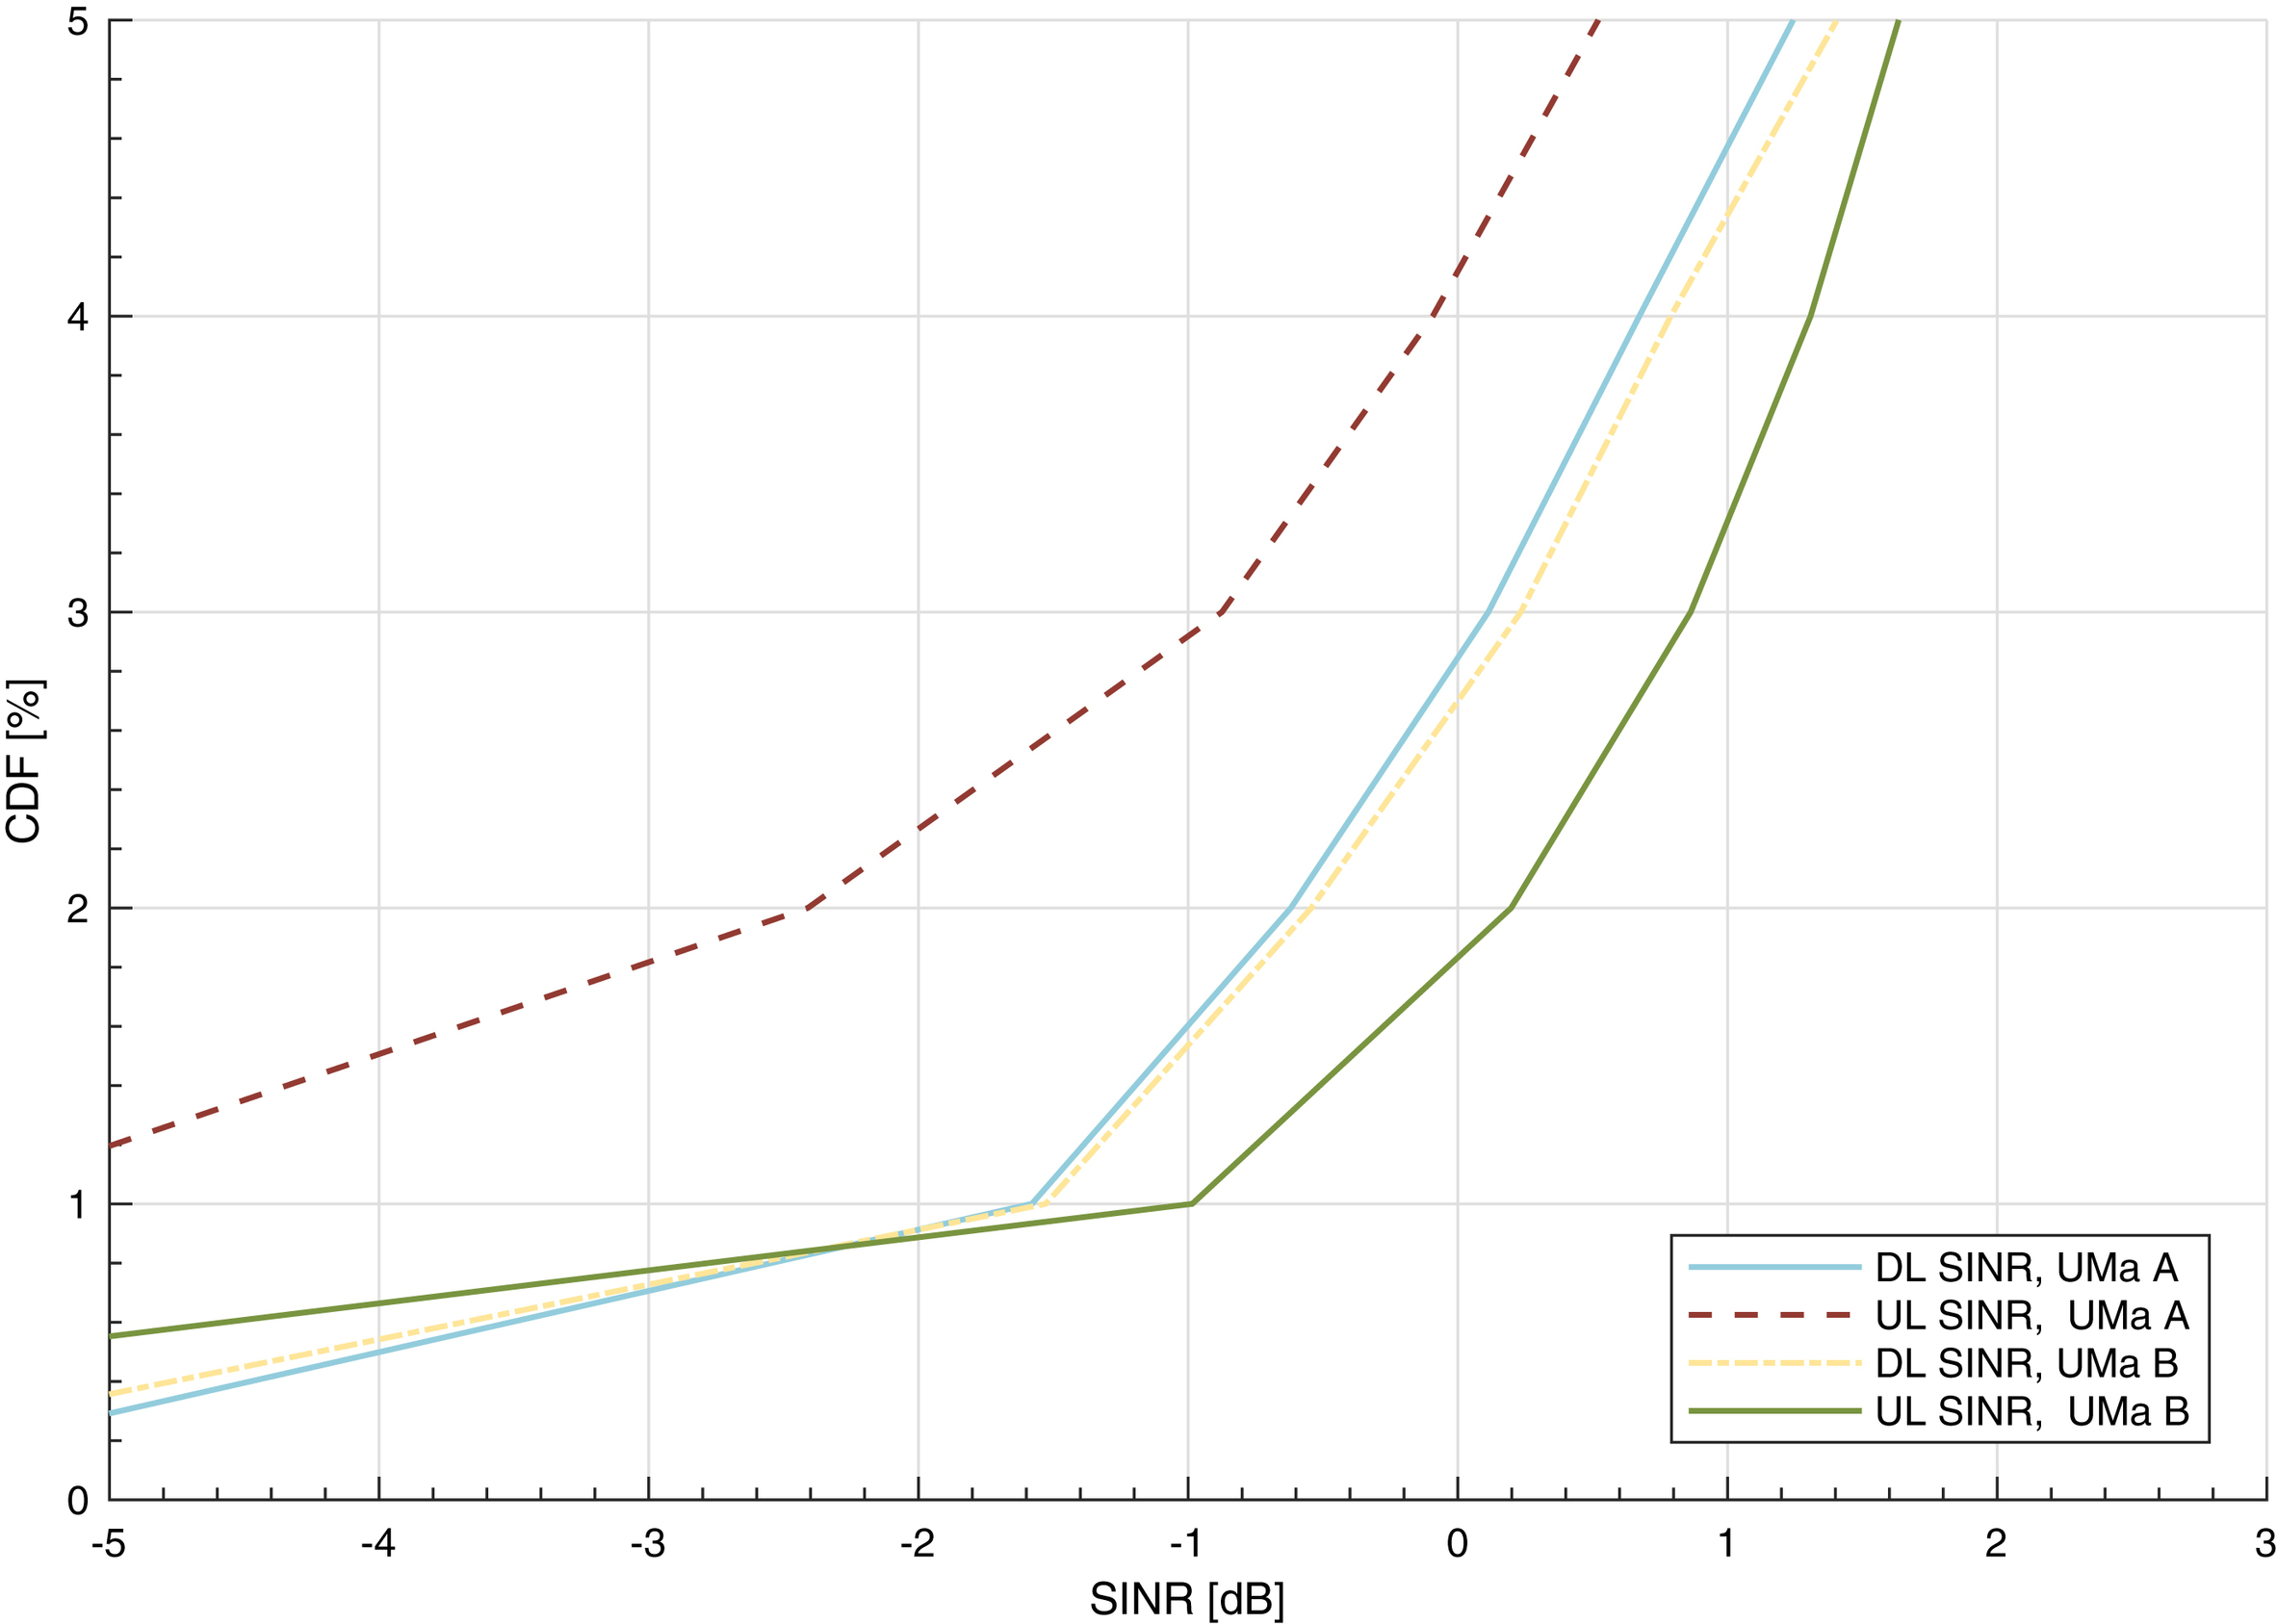
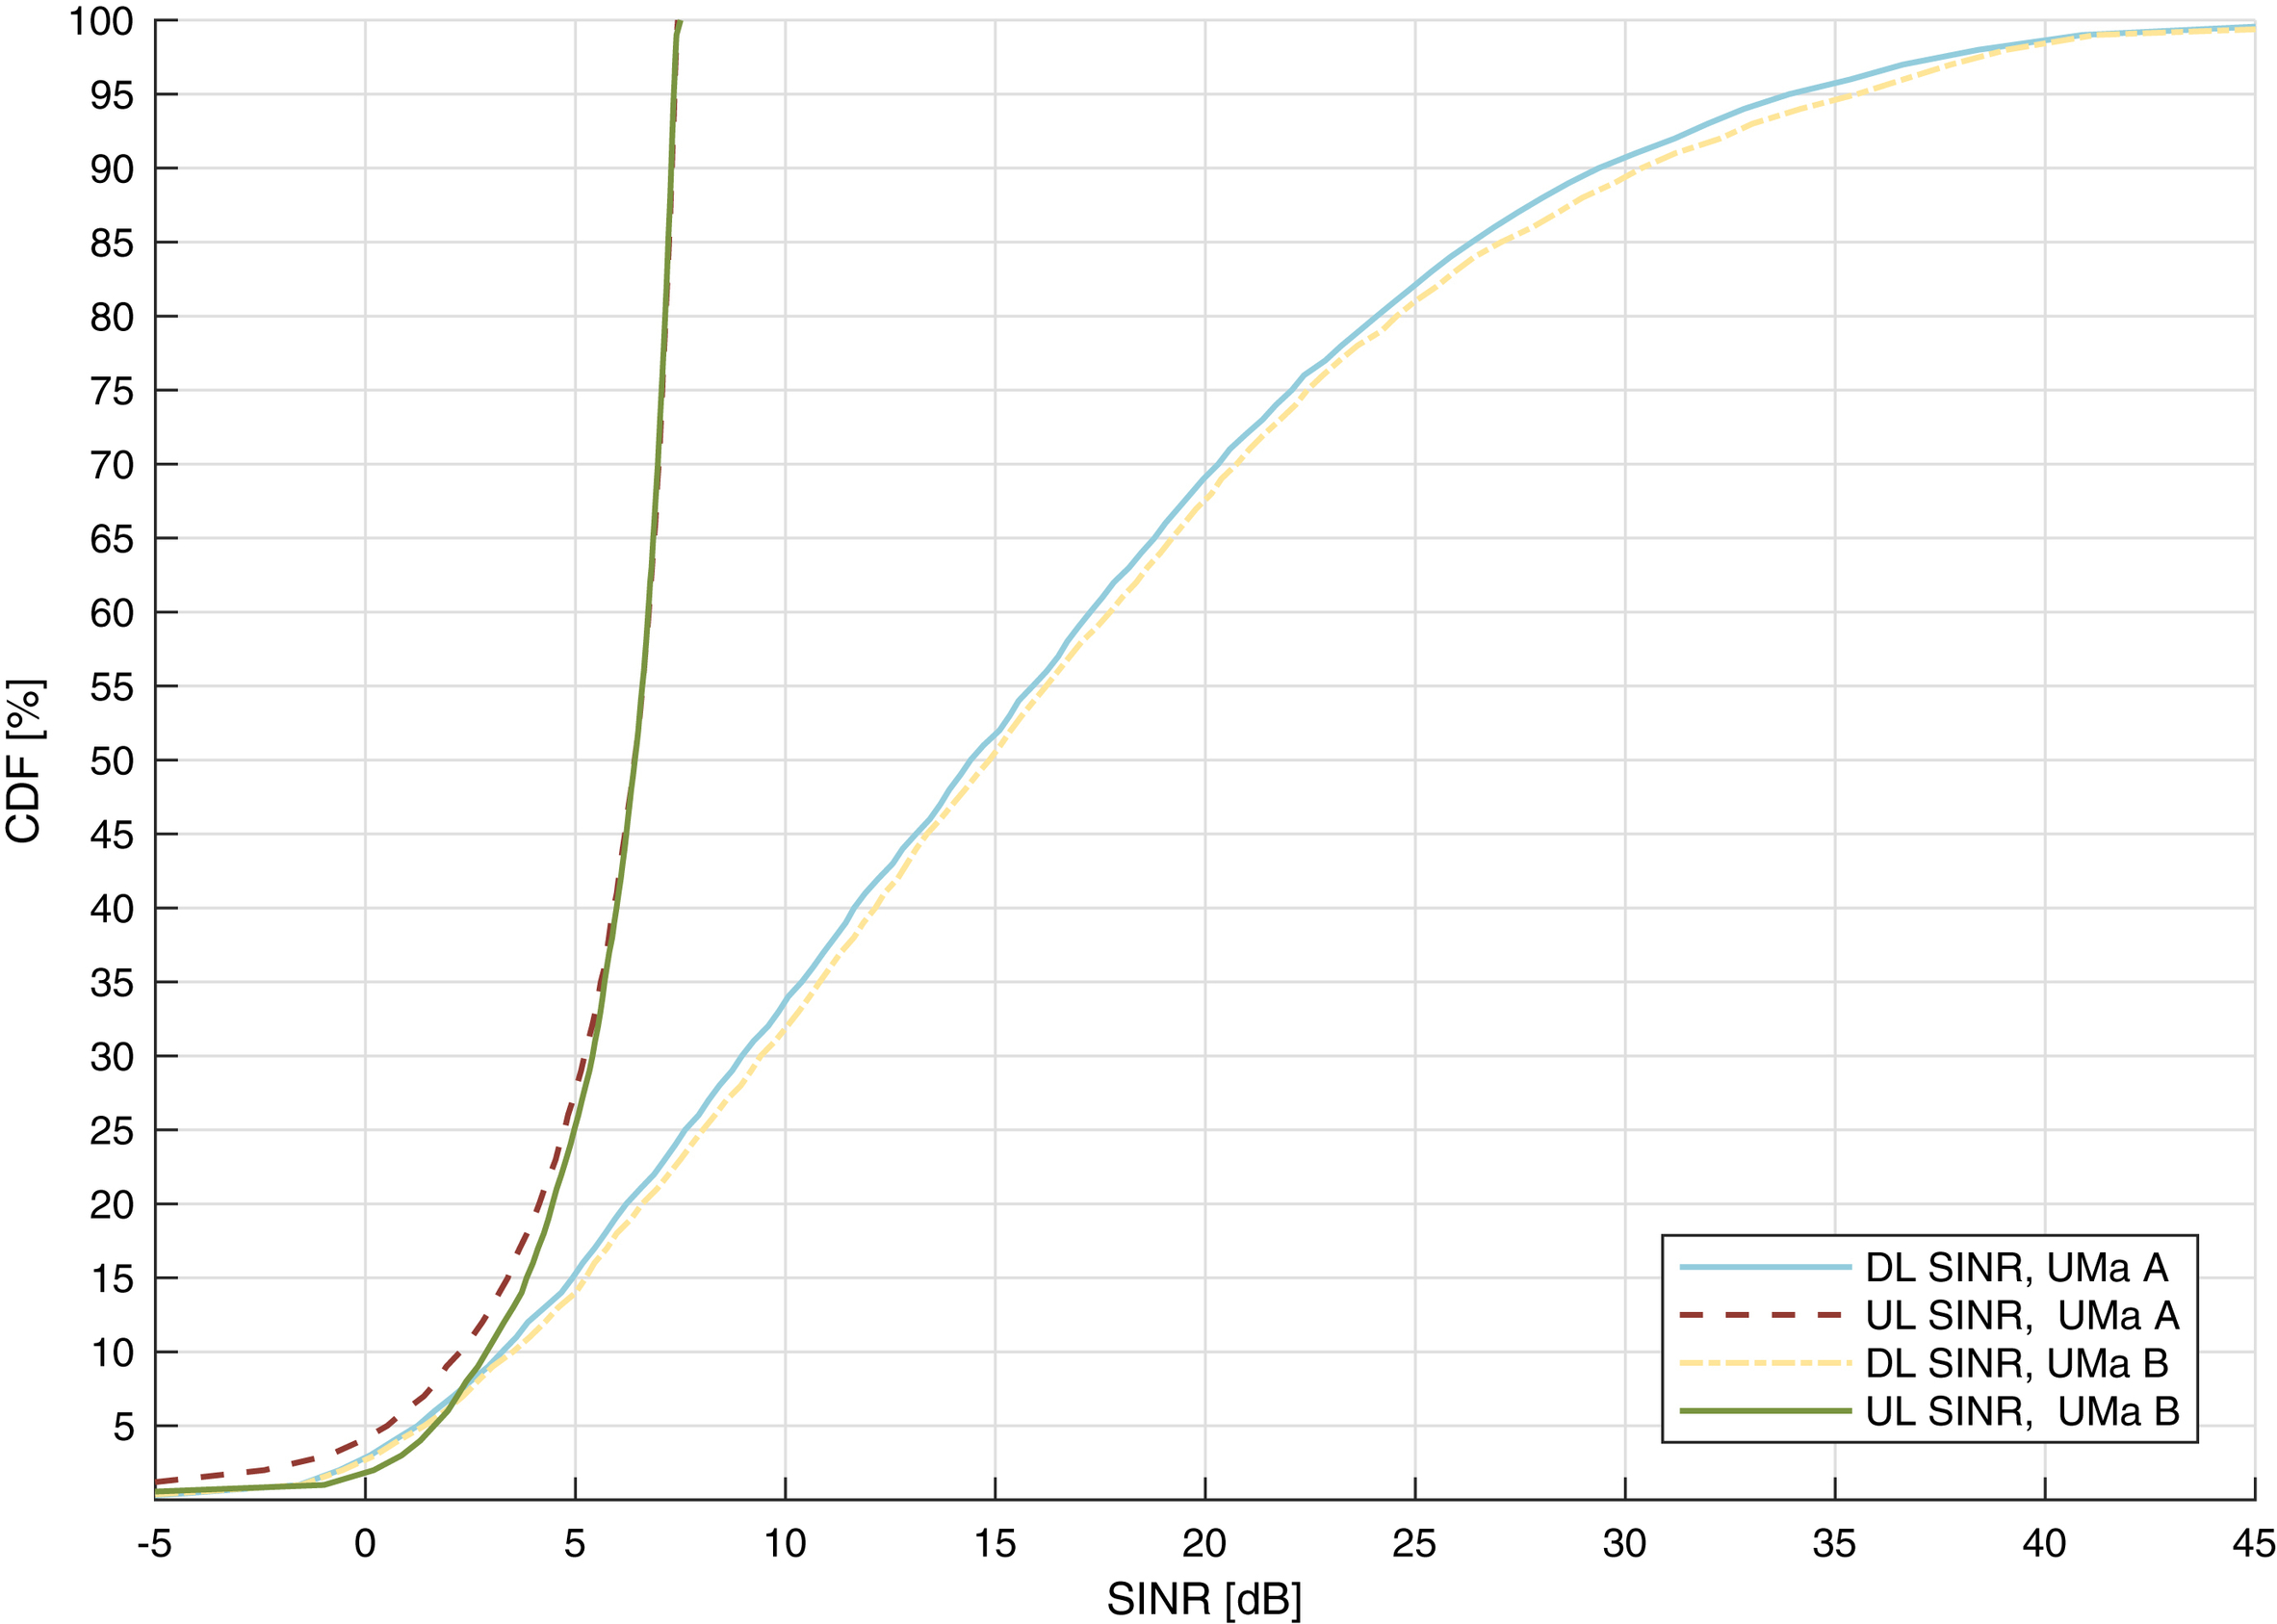
For configuration A the resulting SINR distribution at full load (100% cell utilization) is drawn in Fig. 12.6, and for configuration B in Fig. 12.7. The cell-edge (fifth percentile) SINR values for uplink and downlink are collected in Table 12.13, and these are the target Q-values for the reliability evaluation, as discussed in Section 12.1.3.
12.2.2.3. Total reliability
As the end result, we want to estimate the total reliability or success rate, at the tail of the SINR distribution. In the following section, analytical expressions for total reliability are derived. The definitions of physical channel success probabilities used in the expressions are given in Table 12.14, and based on these we will estimate the total success rate
p
t
=
1
−
ε
 , where
ε
 is the residual error rate.
 , where
 is the residual error rate.
One may perhaps immediately expect that the total error translates into a requirement on all physical channels, such that they should have a reliability exceeding
p
t
 . But this is a simplification and an exaggeration, which is only relevant for the simplest case of having only one
transmission attempt. In this case, for downlink transmission data, under the assumption of independent errors, we can expect the combined success rate of PDCCH and PDSCH to be:
 . But this is a simplification and an exaggeration, which is only relevant for the simplest case of having only one
transmission attempt. In this case, for downlink transmission data, under the assumption of independent errors, we can expect the combined success rate of PDCCH and PDSCH to be:
. But this is a simplification and an exaggeration, which is only relevant for the simplest case of having only one
transmission attempt. In this case, for downlink transmission data, under the assumption of independent errors, we can expect the combined success rate of PDCCH and PDSCH to be:Table 12.12

This expression can then describe the success rate of a one-shot attempt, where we do not consider feedback or subsequent attempts.
How can we formulate the total success rate in the case of multiple attempts? First, we must have a model for how the attempts differ from each other. There are two extremes that are useful to consider here:
- • Uncorrelated transmissions. In this case, the attempts are independent of each other and can be treated as separate probability processes. This could correspond to the case of two transmissions either separated in time more than the coherence time (e.g. when performing retransmissions while moving at high speed) - which is less relevant for URLLC - or separated in frequency more than the coherence bandwidth. It could also correspond to a duplication of the packet sent over two independent channels from e.g. different nodes. Two different attempts would therefore experience different channel conditions and therefore different SINR.
- • Completely correlated transmissions. In this case the channel characteristics (i.e. the experienced SINR) are exactly the same in all transmission attempts. The gain from having more than one attempt of data transmission is then that the accumulated code rate can be reduced (using incremental redundancy), giving a higher success rate at the given SINR.
In an actual scenario, two transmission attempts would be partially correlated, meaning that the channel conditions will have changed somewhat between attempts, but the main characteristics of the channel will likely largely remain. By tracking the channel in time and frequency between attempts we can capture this correlation. The effect a channel correlation will have is that success rates become coupled to earlier success rates and therefore to the number of attempts.
In downlink, we need to take PDCCH and PUCCH control into account besides PDSCH data, and we can formulate the total reliability for N transmission attempts as (using the definitions in Table 12.14):

where for any positive integer k,
p
2
,
k
 is the probability of a data block being correctly received after exactly k transmissions have been soft combined. In this expression the downlink and uplink control transmissions are seen as uncorrelated with each other and with data. This is an approximation, but it can be motivated by e.g. shifting the frequency placement of PDCCH between attempts. The downlink data attempts are correlated with each other according to the tracking of the used channel model.
 is the probability of a data block being correctly received after exactly k transmissions have been soft combined. In this expression the downlink and uplink control transmissions are seen as uncorrelated with each other and with data. This is an approximation, but it can be motivated by e.g. shifting the frequency placement of PDCCH between attempts. The downlink data attempts are correlated with each other according to the tracking of the used channel model.
With SR-based uplink transmissions we also need to take both PDCCH and PUCCH performance in to account besides PUSCH performance. For m SR attempts followed by N uplink data transmission attempts the total reliability would be:

With CG-based uplink scheduling instead we remove the SR step over PUCCH and the first downlink control for uplink grant, and the total reliability after N uplink data transmission attempts can be described as:

Here the PDCCH reliability only comes in starting from the first retransmission. In line with expectations, perfect energy detection performance on the PUSCH resource is assumed, meaning that gNB will always correctly identify the device from the first uplink transmission based on scheduled allocation.
With these expressions at hand we can construct the total reliability plots from the physical channel BLER plots, as function of the SINR experienced in the studied scenario (here only for the UMa B path loss model). As was mentioned in Section 12.1.3, the IMT-2020 requirement is that the reliability target should be achieved at the fifth percentile of the SINR distribution, given by Table 12.13. To achieve a simple plot, we make the assumption that the percentile of uplink and downlink SINR is equivalent, meaning that we assume that a user is on the fifth percentile of both the uplink and downlink SINR distributions at the same time. This is of course a strong simplification which we do not expect to generally hold, but not completely unrealistic and it allows us to study the main trends and more importantly the fulfilment of the requirement. For downlink control it is assumed that AL 8 is used. In both downlink and uplink frontloaded DMRS is assumed.
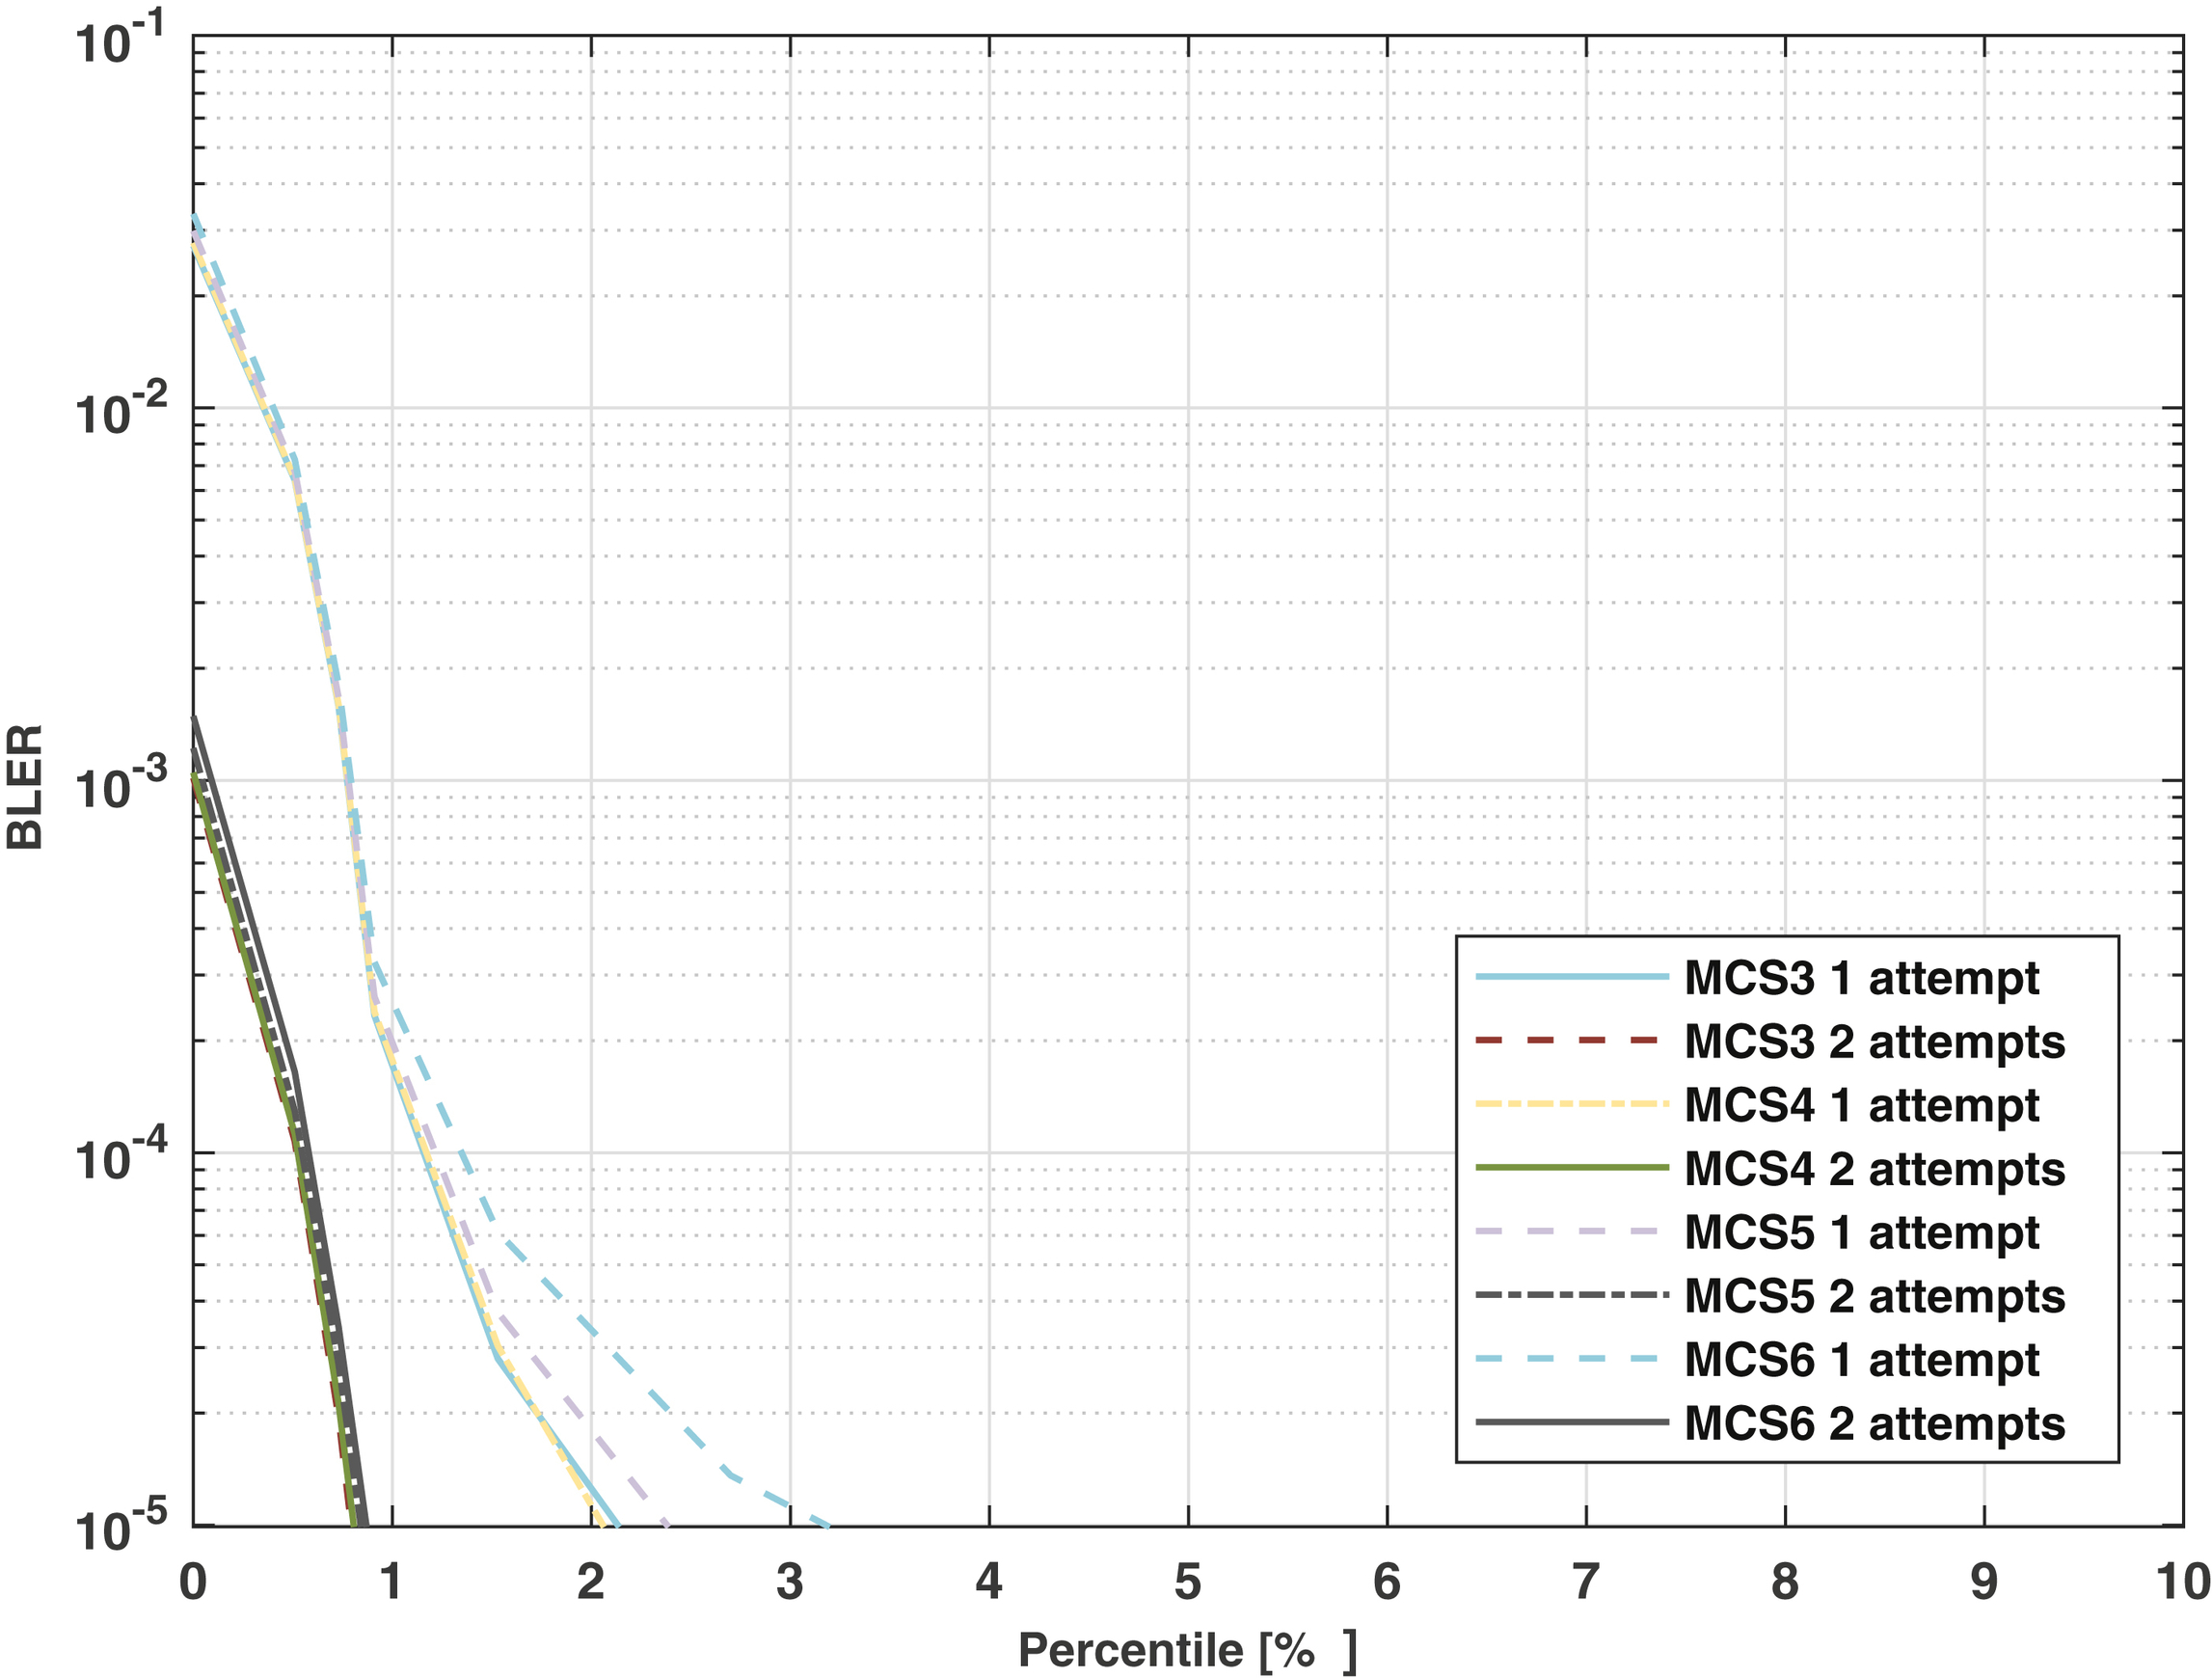
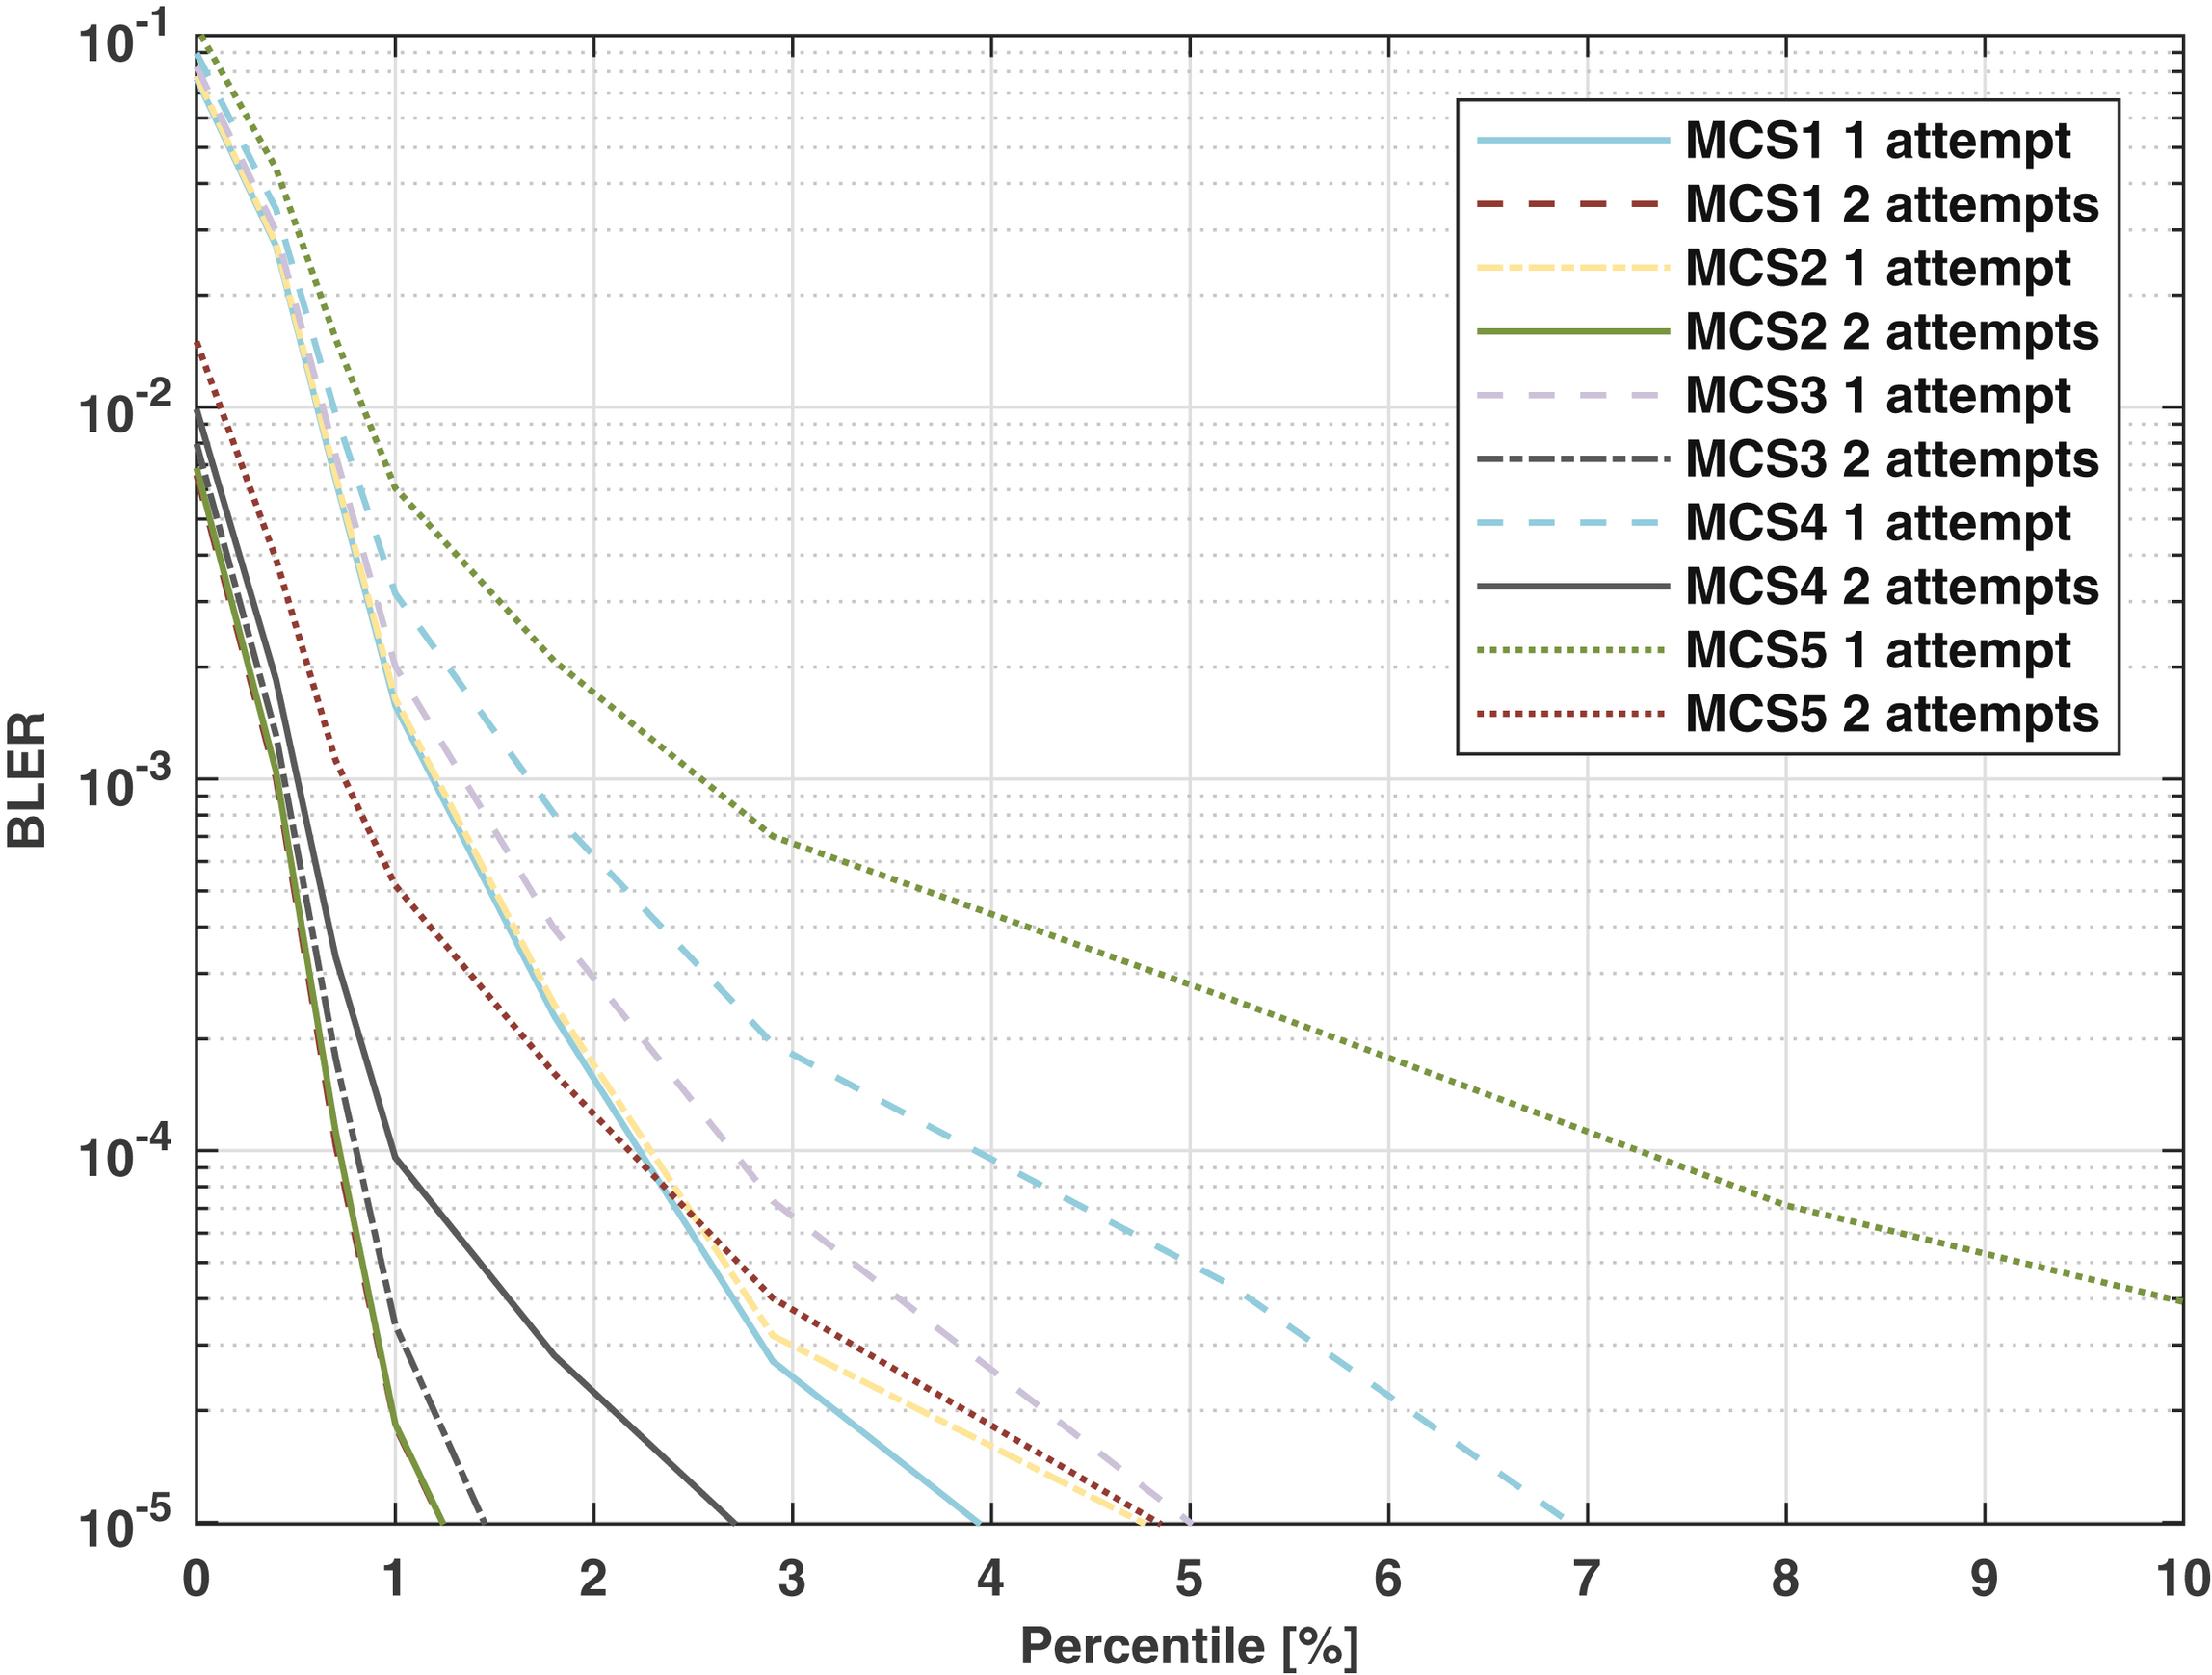
For downlink data the total reliability for Configuration A and B is given in Fig. 12.8, and for uplink data with CG the total reliability is given in Fig. 12.9. In these plots we can see that the required reliability can be reached below the fifth percentile of the SINR distribution with only one transmission attempt, using a range of MCSs for both configurations, and in both directions.
The IMT-2020 requirement states further that the reliability target should be fulfilled for a packet of 32 bytes, within 1
ms. With QPSK modulation and a code rate according to MCS-1 to MCS-6 and overhead from downlink control (AL-8) and DMRS (one full symbol in uplink, every second subcarrier in one symbol in downlink), the total required transmission allocation in resource blocks (RB) per such transmission is given in Table 12.15. These allocations should then be compared with the carrier bandwidth of 20
MHz, giving 50 RB with 30
kHz SCS. Here, the TBS is assumed to be exactly 32 bytes, and CRC is not considered.
Studying now specific configurations we can check if the total requirement is fulfilled:
- • In Configuration A with UMa B with a 4 OS mini-slot, one transmission attempt with MCS-6 fulfills the reliability requirement in downlink and uplink (Figs. 12.8 and 12.9). This would require 40 RB in downlink and 31 RB in uplink (Table 12.15) and take 0.7 ms (Table 12.4).
- • In Configuration B with UMa B with a 7 OS mini-slot, one transmission attempt with MCS-3 in downlink and MCS-4 in uplink fulfills the reliability requirements (Figs. 12.8 and 12.9). This would require 34 RB in downlink and 24 RB in uplink (Table 12.15) and take 0.9 ms (Table 12.4).
Since the reliability, latency, and payload requirements can be met we can therefore conclude that the IMT-2020 requirements for URLLC in 5G are fulfilled with NR URLLC.
12.2.3. Spectral efficiency
Apart from the required performance on latency and reliability, another key value for any RAT is the spectral efficiency; the achievable bitrate per spectrum unit. The expectations on achievable URLLC rates should be set low from start, at least when compared to eMBB. This is because we know that reliability has additional cost arising from redundancy, which naturally means lower rates. While eMBB data packets can be sent with high code rate,
high modulation, and using multiple MIMO layers, the URLLC data would be sent with robust transmission choices. On the other hand, the URLLC packets are expected to be much smaller than typical eMBB packets, and traffic is expected to be lower, and therefore the impact on network performance can therefore be expected to be moderate despite the lower rates.
Because of the smaller data packets, the relative overhead from control and reference signals becomes higher, and this also reduces the spectral efficiency of cMTC services. For downlink data, we can count on one DCI per data packet regardless of the size of the data packet. In uplink, the same is true for dynamic scheduling, but with configured uplink grants there is no additional downlink control overhead. However, in practice there could be a significant inefficiency with CGs if these are over-provisioned compared to the actual uplink data, meaning that we reserve transmission opportunities even if we are not sure the device will use them.
Table 12.15

Naturally, the observed spectral efficiency of a certain cMTC service depends on the scenario it is deployed in. Good coverage and high SINR means higher MCS can be used with higher resulting efficiency. We can estimate the spectral efficiency for a certain MCS at a certain SINR point. To be able to derive a simple plot we assume the HARQ feedback is sent on a channel with the same SINR as the data, that is the downlink and uplink SINR is set to be equivalent.
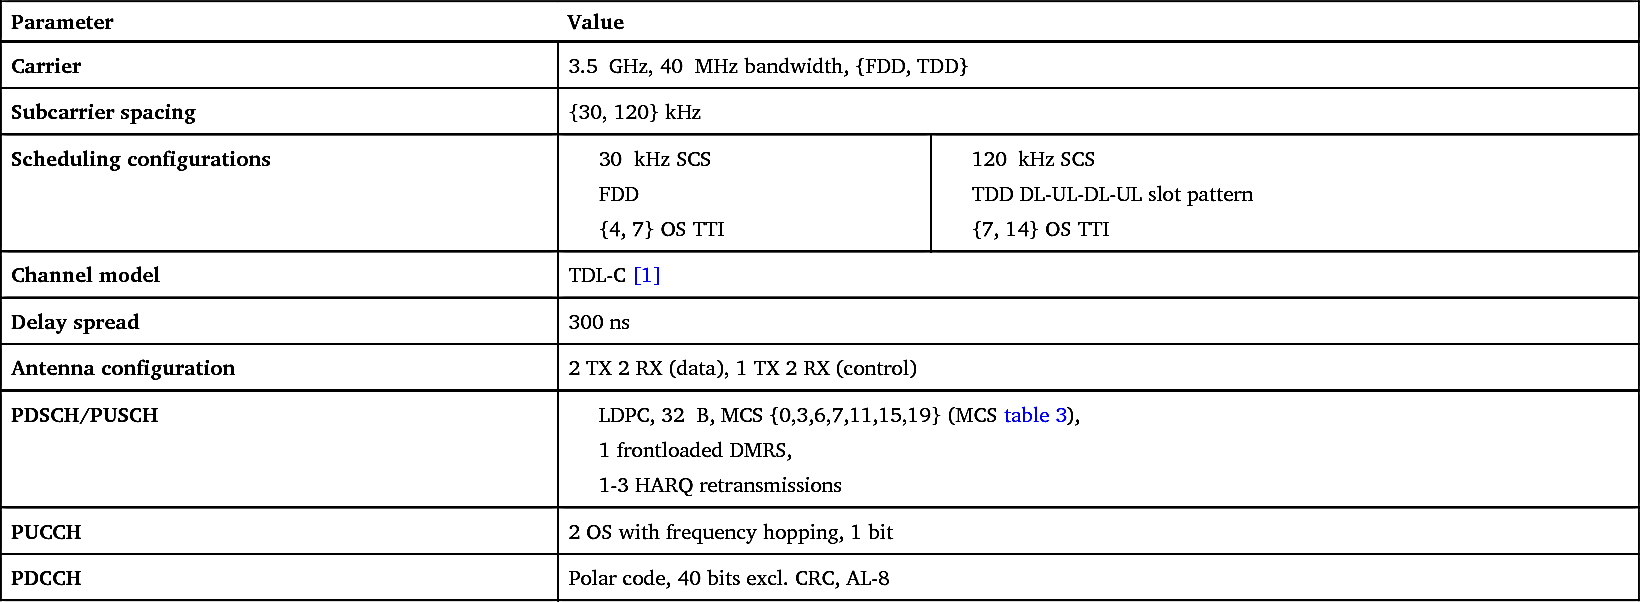
The evaluation is based on link simulation results with parameters according to Table 12.16. It should be noted that for the assumed carrier frequency of 3.5
GHz there are no defined FDD bands, and in addition 120
kHz SCS is only defined for FR2. Nevertheless, this frequency choice serves as a good representation of the performance of FDD in FR1 and 120
kHz TDD in the lower bands of FR2. To evaluate the total reliability, we follow the description in Section 12.2.2.3 for downlink data and for uplink data with CGs, using the same assumptions for scheduling. Here we study two different latency requirements, 1
ms and 2.5
ms, allowing for retransmissions in the higher latency case to reach the 99.999% total reliability target. The spectral efficiency is found from the highest MCS fulfilling the latency and reliability targets, while allowing up to 2 HARQ retransmissions, and subtracting for overhead from DMRS and PDCCH following the parameters in Table 12.16.
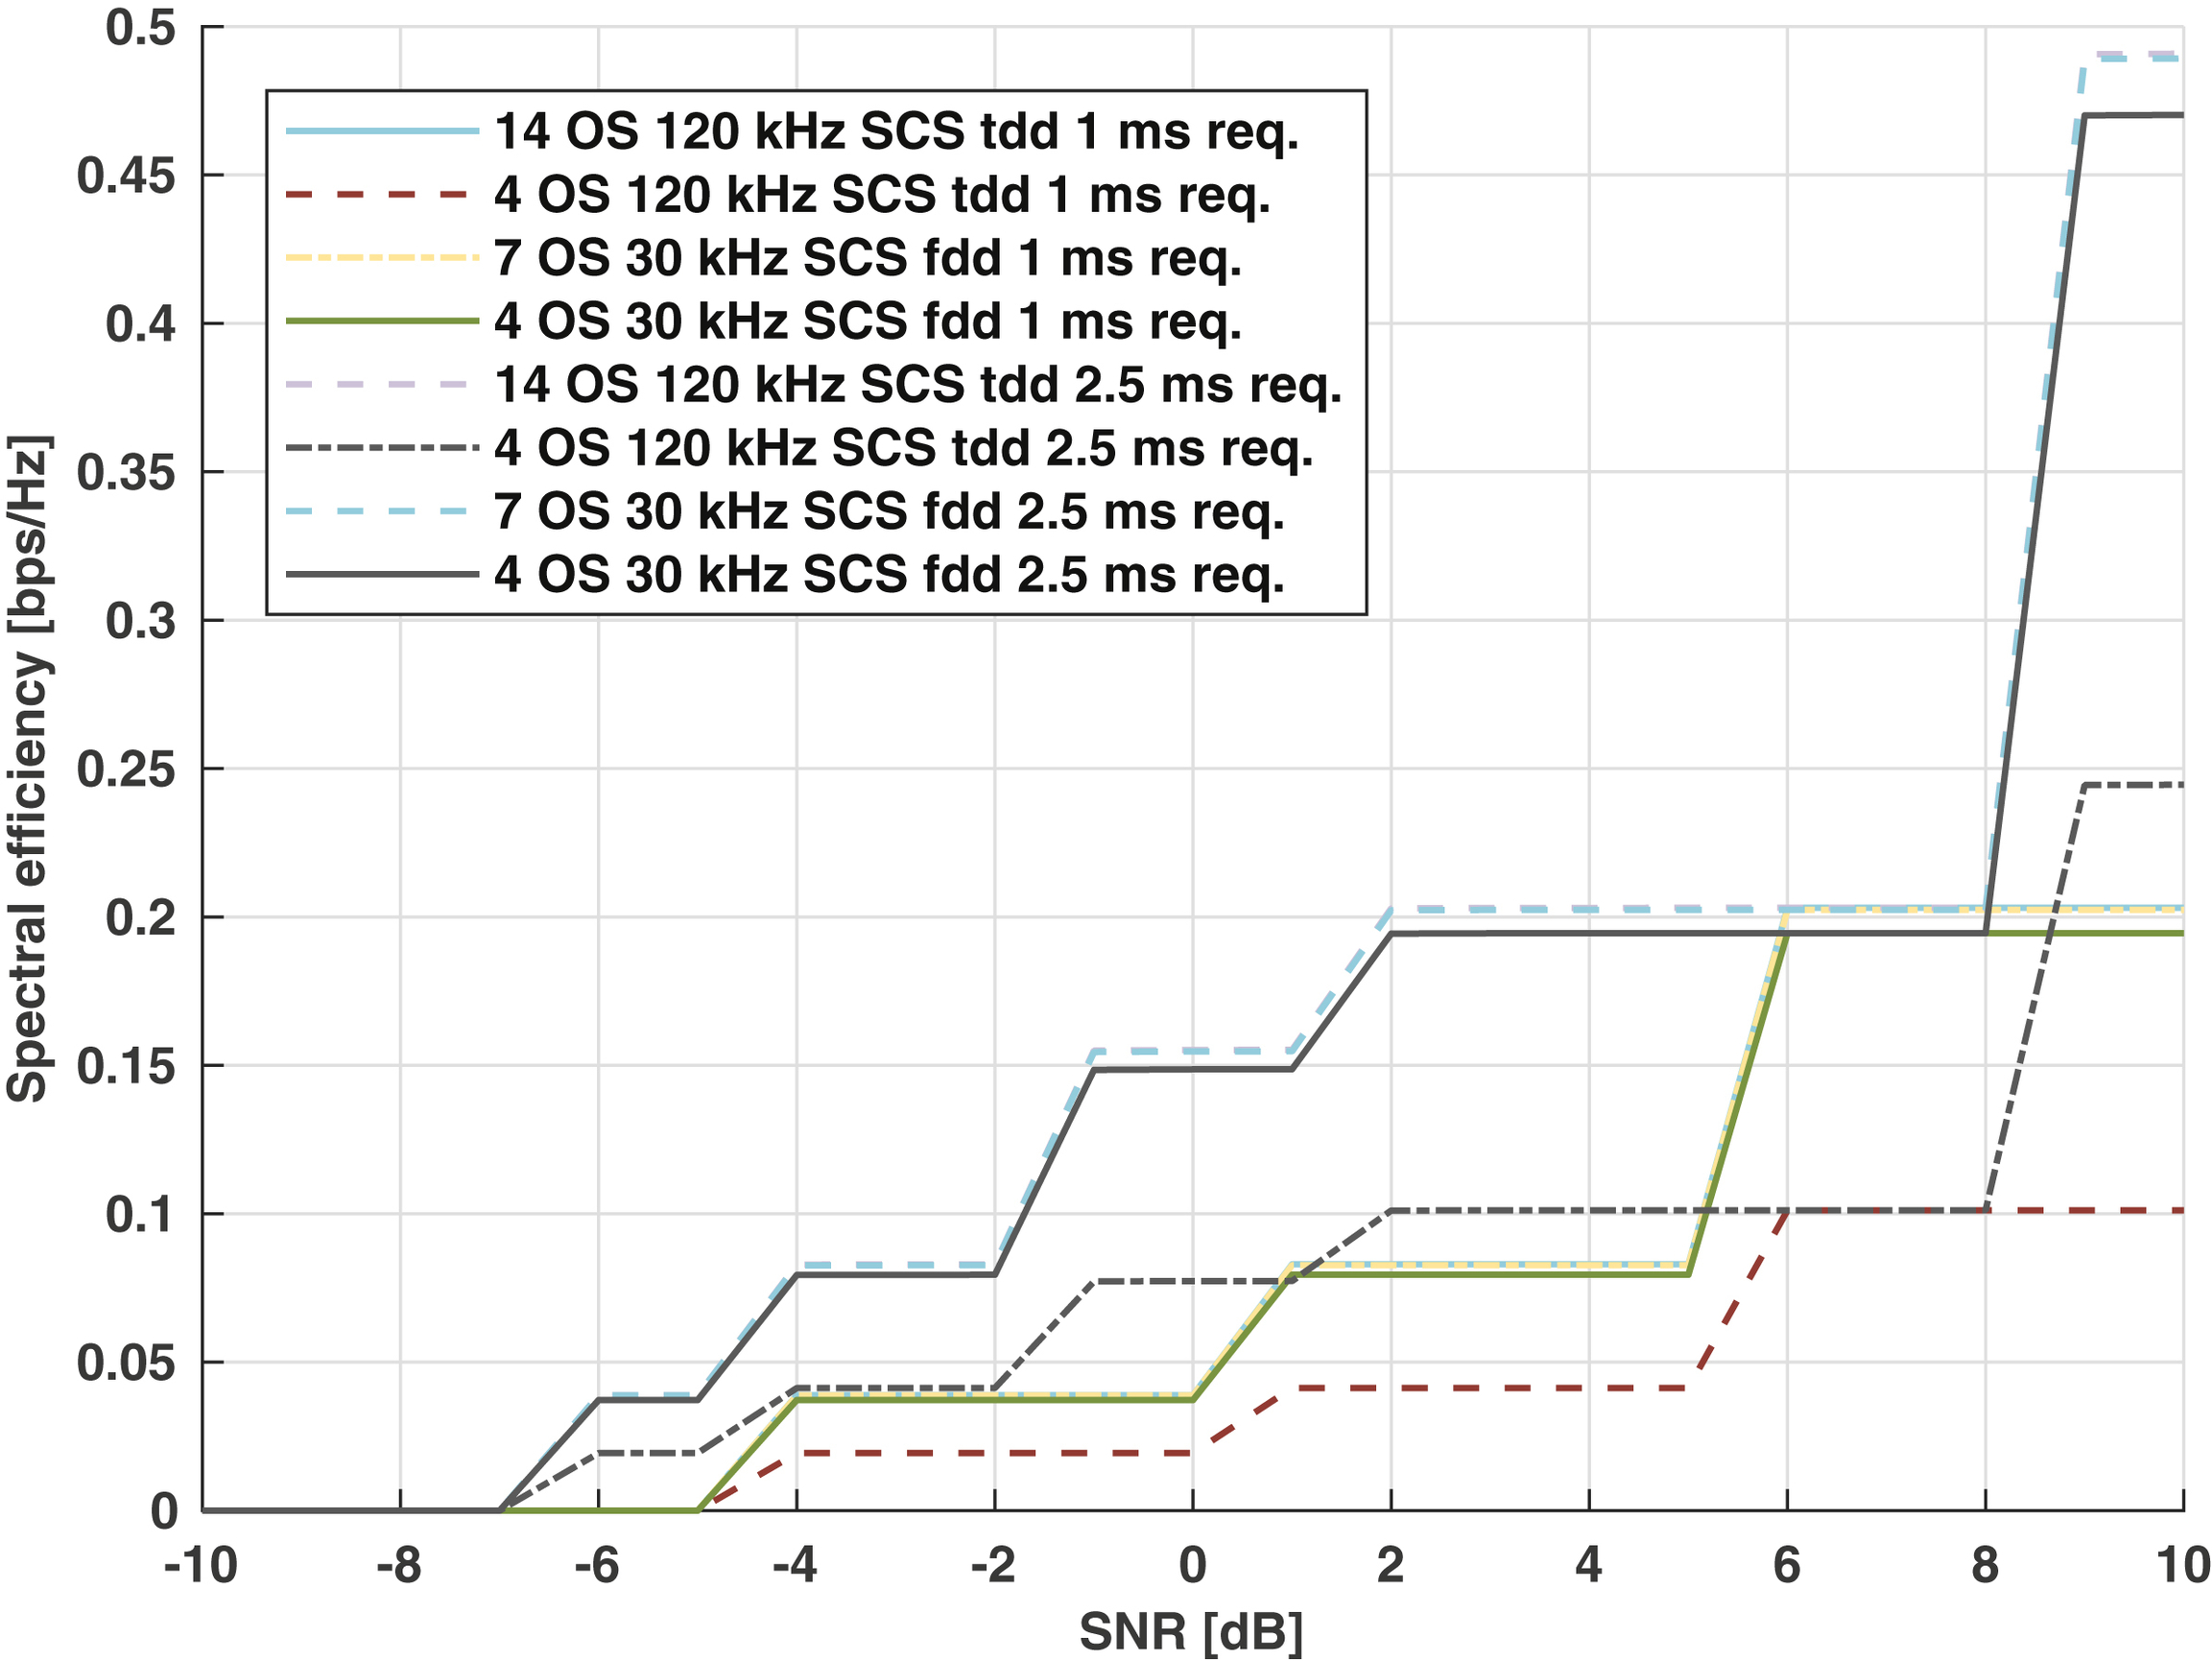
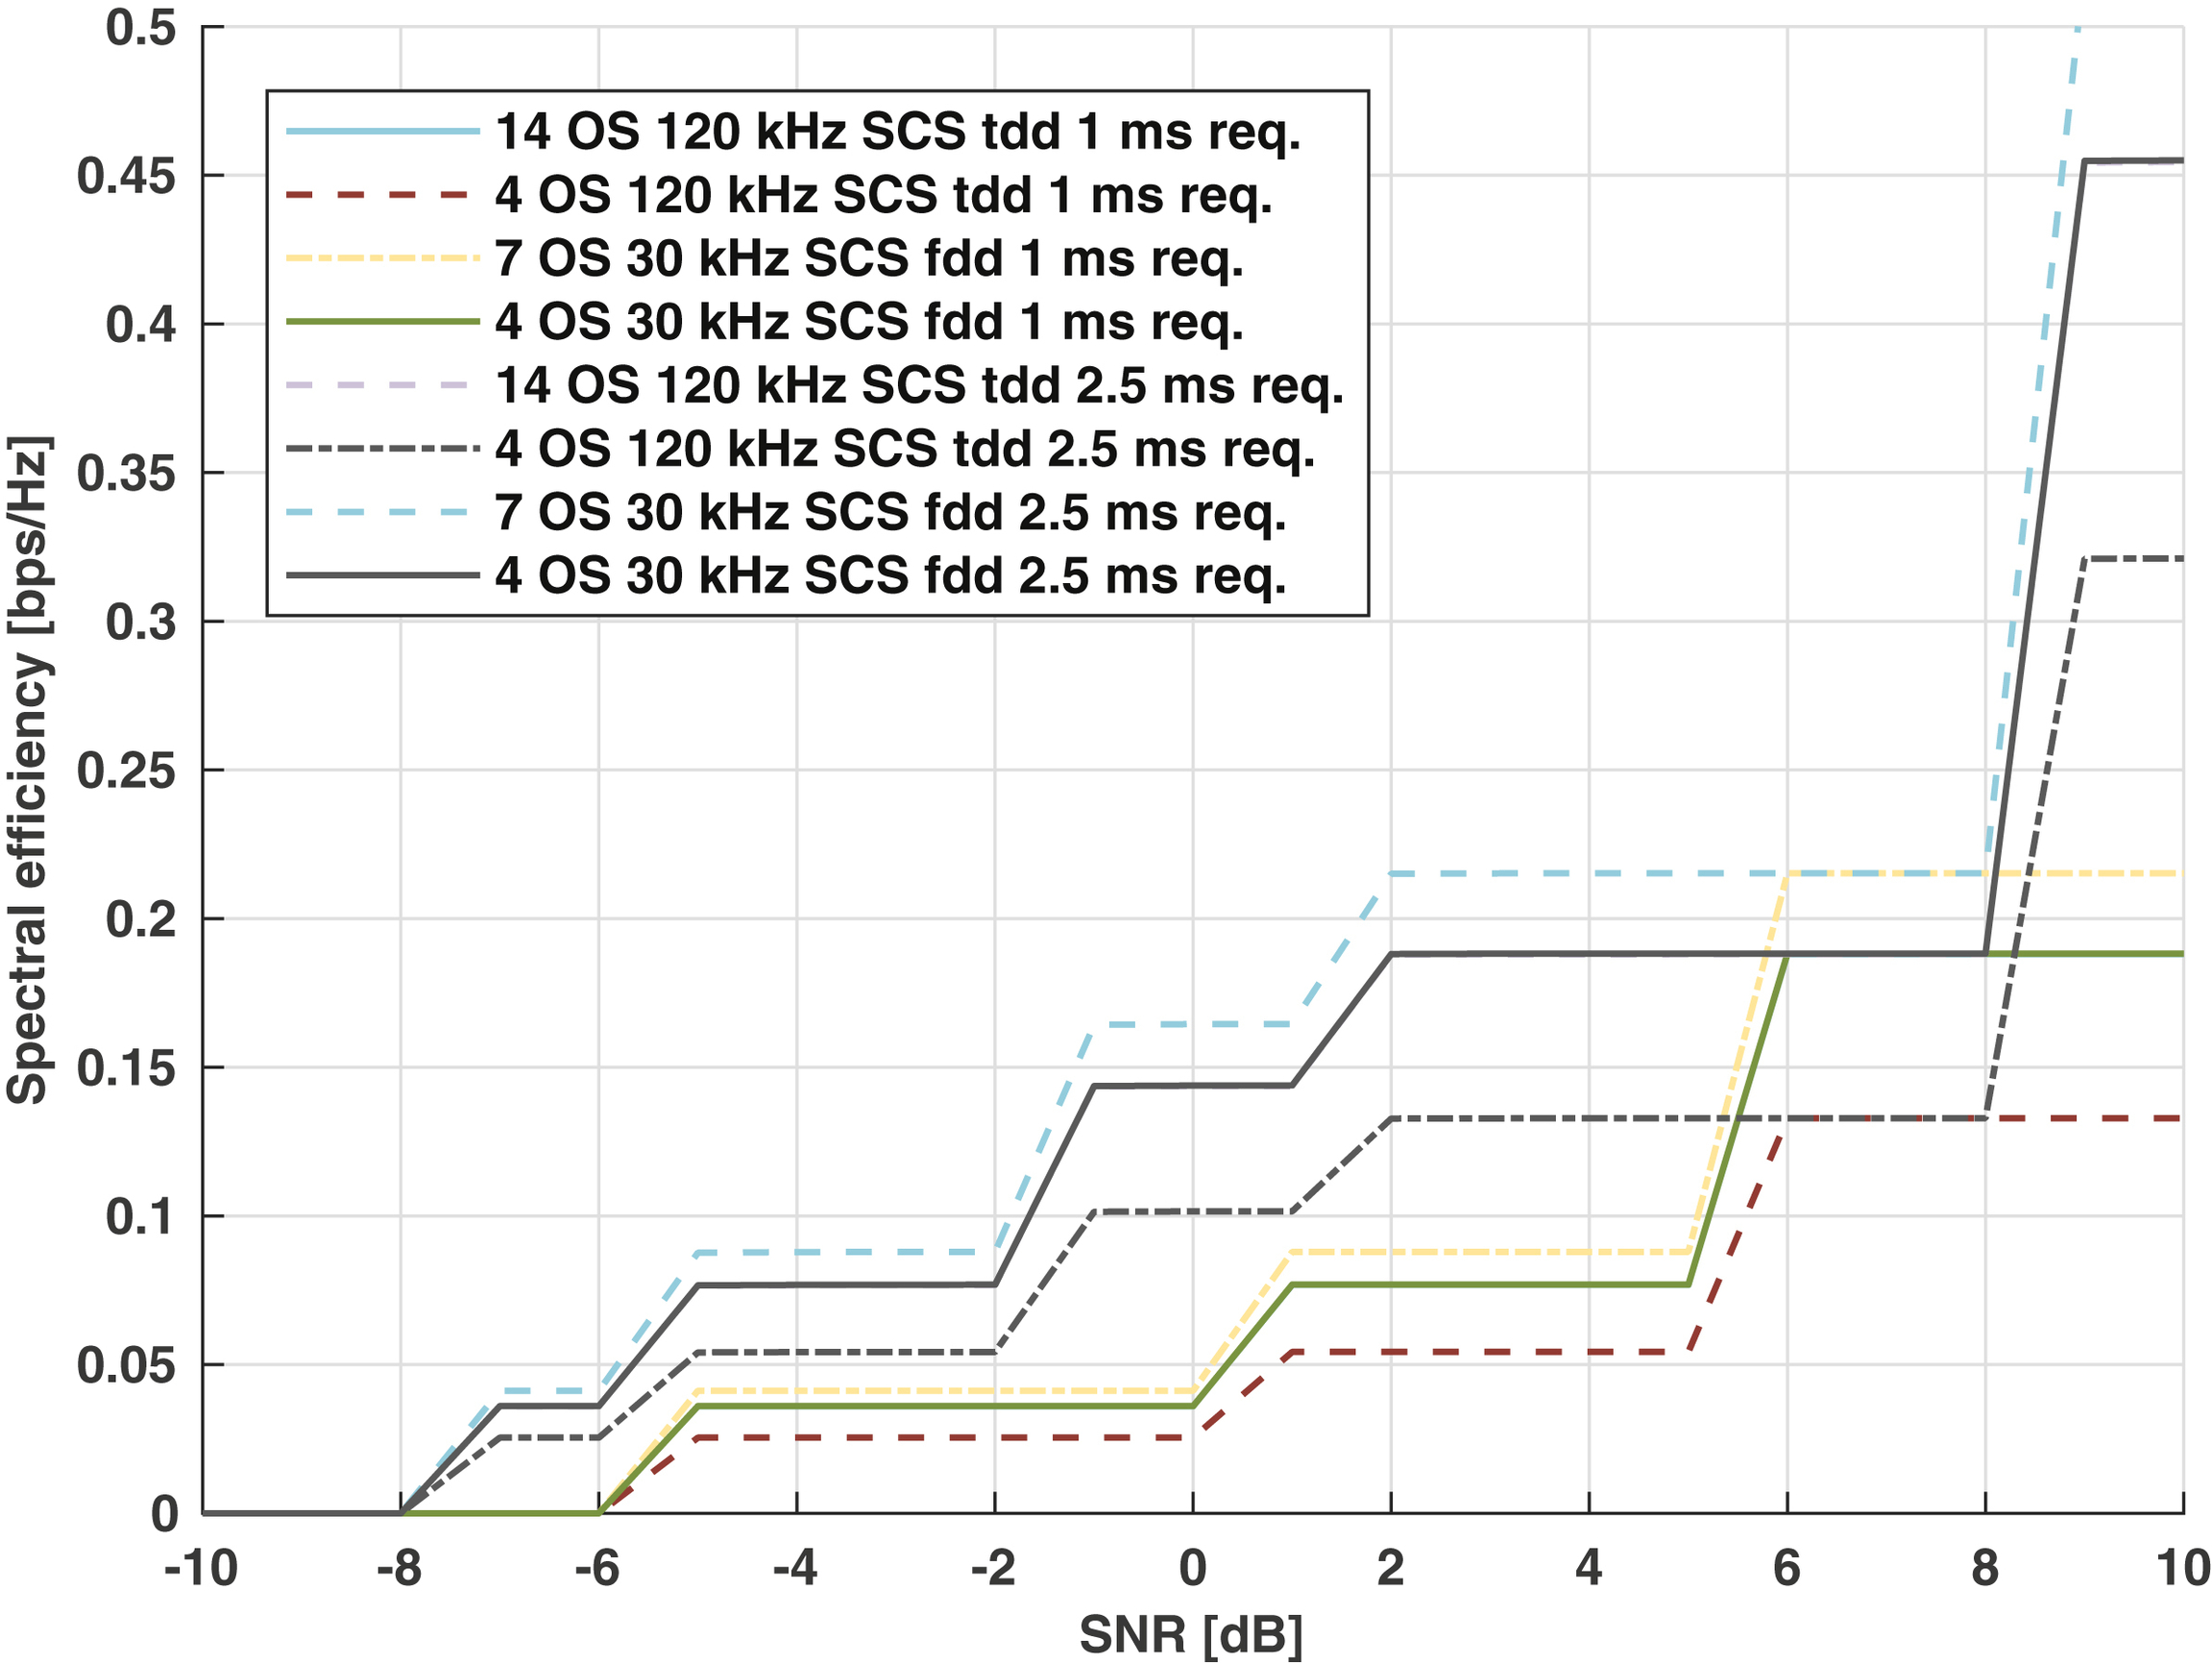
In Figs. 12.10 and 12.11 we calculate the downlink and uplink spectral efficiency, respectively, for a 32
B packet with four different transmission lengths: 2, 4, 7, and 14 OS. From the results we can observe the effect from having time for retransmissions, allowing for higher MCS which gives improved efficiency, which in turn is enabled by higher SCS, shorter mini-slot allocation, and relaxed latency requirement.
Table 12.16
| Parameter | Value | |
|---|---|---|
| Carrier | 3.5 GHz, 40 MHz bandwidth, {FDD, TDD} | |
| Subcarrier spacing | {30, 120} kHz | |
| Scheduling configurations |
30
kHz SCS
FDD
{4, 7} OS TTI
|
120
kHz SCS
TDD DL-UL-DL-UL slot pattern
{7, 14} OS TTI
|
| Channel model | TDL-C [1] | |
| Delay spread | 300 ns | |
| Antenna configuration | 2 TX 2 RX (data), 1 TX 2 RX (control) | |
| PDSCH/PUSCH |
LDPC, 32
B, MCS {0,3,6,7,11,15,19} (MCS table 3),
1 frontloaded DMRS,
1-3 HARQ retransmissions
|
|
| PUCCH | 2 OS with frequency hopping, 1 bit | |
| PDCCH | Polar code, 40 bits excl. CRC, AL-8 | |
12.3. Service coverage
Defining a certain cMTC service from the requirement “the delivery of a payload of P bytes within a latency of L milliseconds with a success probability or reliability of R″ we are now ready to study where such a service can be delivered. As a supplement to the above requirement we can then define service coverage as “the fraction of devices in a certain population to which the service can be supplied”. We saw in Section 12.2.2 that the fulfilment or not of the service requirement will depend on the SINR at the device location, and then the service coverage will be equivalent to studying how likely it is to have a SINR higher than a threshold value, the lowest at which the service can be delivered.
A device's experienced SINR depends on many factors, such as used transmit power, antenna configurations, channel condition and active interference. Hence, the SINR level experienced will be dependent on the load in the network, i.e. on the level of traffic. In an unloaded/low loaded system, the performance will be noise-limited (the thermal noise in the receiver is the dominant factor in determining the performance), and with growing traffic, it will become interference-limited.
12.3.1. A wide-area service example: substation protection
For illustration of the expected cMTC service coverage, we can select a representative wide-area use case: power substation protection.
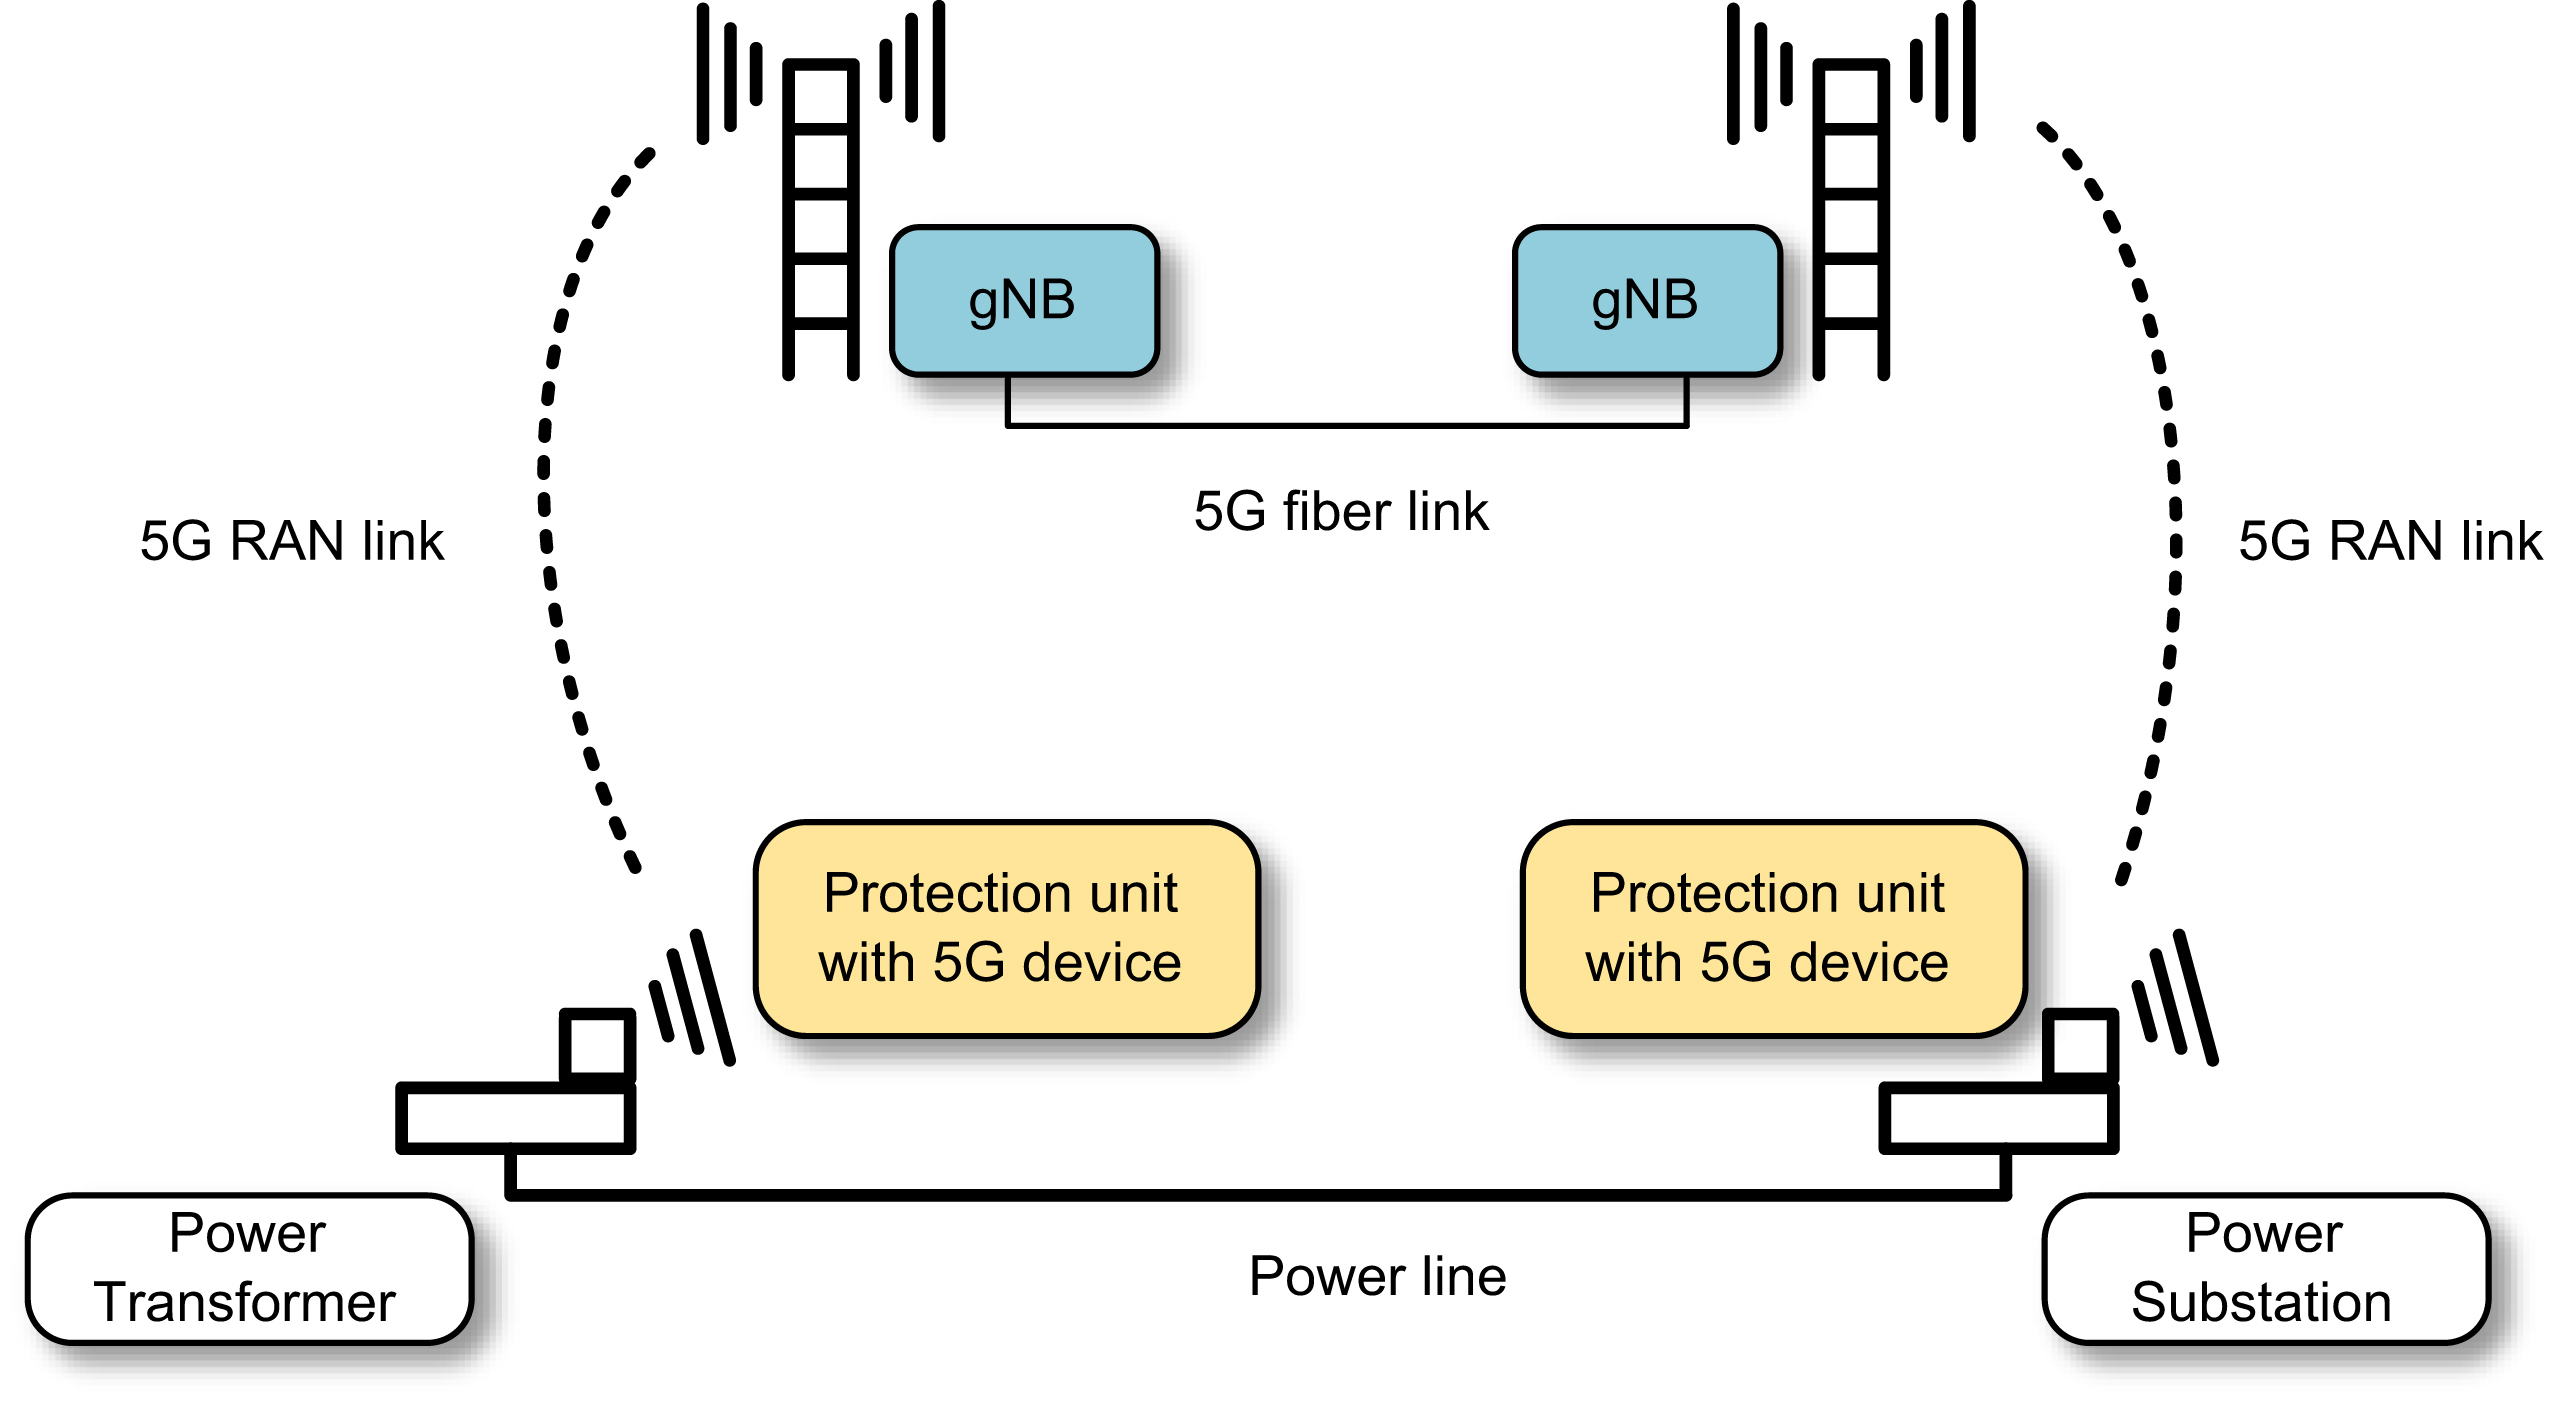
In this scenario power transformers and substations, connected on the electrical power grid, exchange sample values of current and voltage over 5G. The situation is schematically illustrated in Fig. 12.12.
In each power node, a protection unit compares the received values from the other end of the power link with its own values, and quickly breaks the power if the values diverge. In our example we define the cMTC service per NR radio link as sample values taken every 1
ms of packets of 100 bytes in uplink and downlink, which should be delivered in the gNB within 4
ms with a total reliability of 99,999%. With this dimensioning of the service, we can ensure a delivery at the other end's protection unit within 20
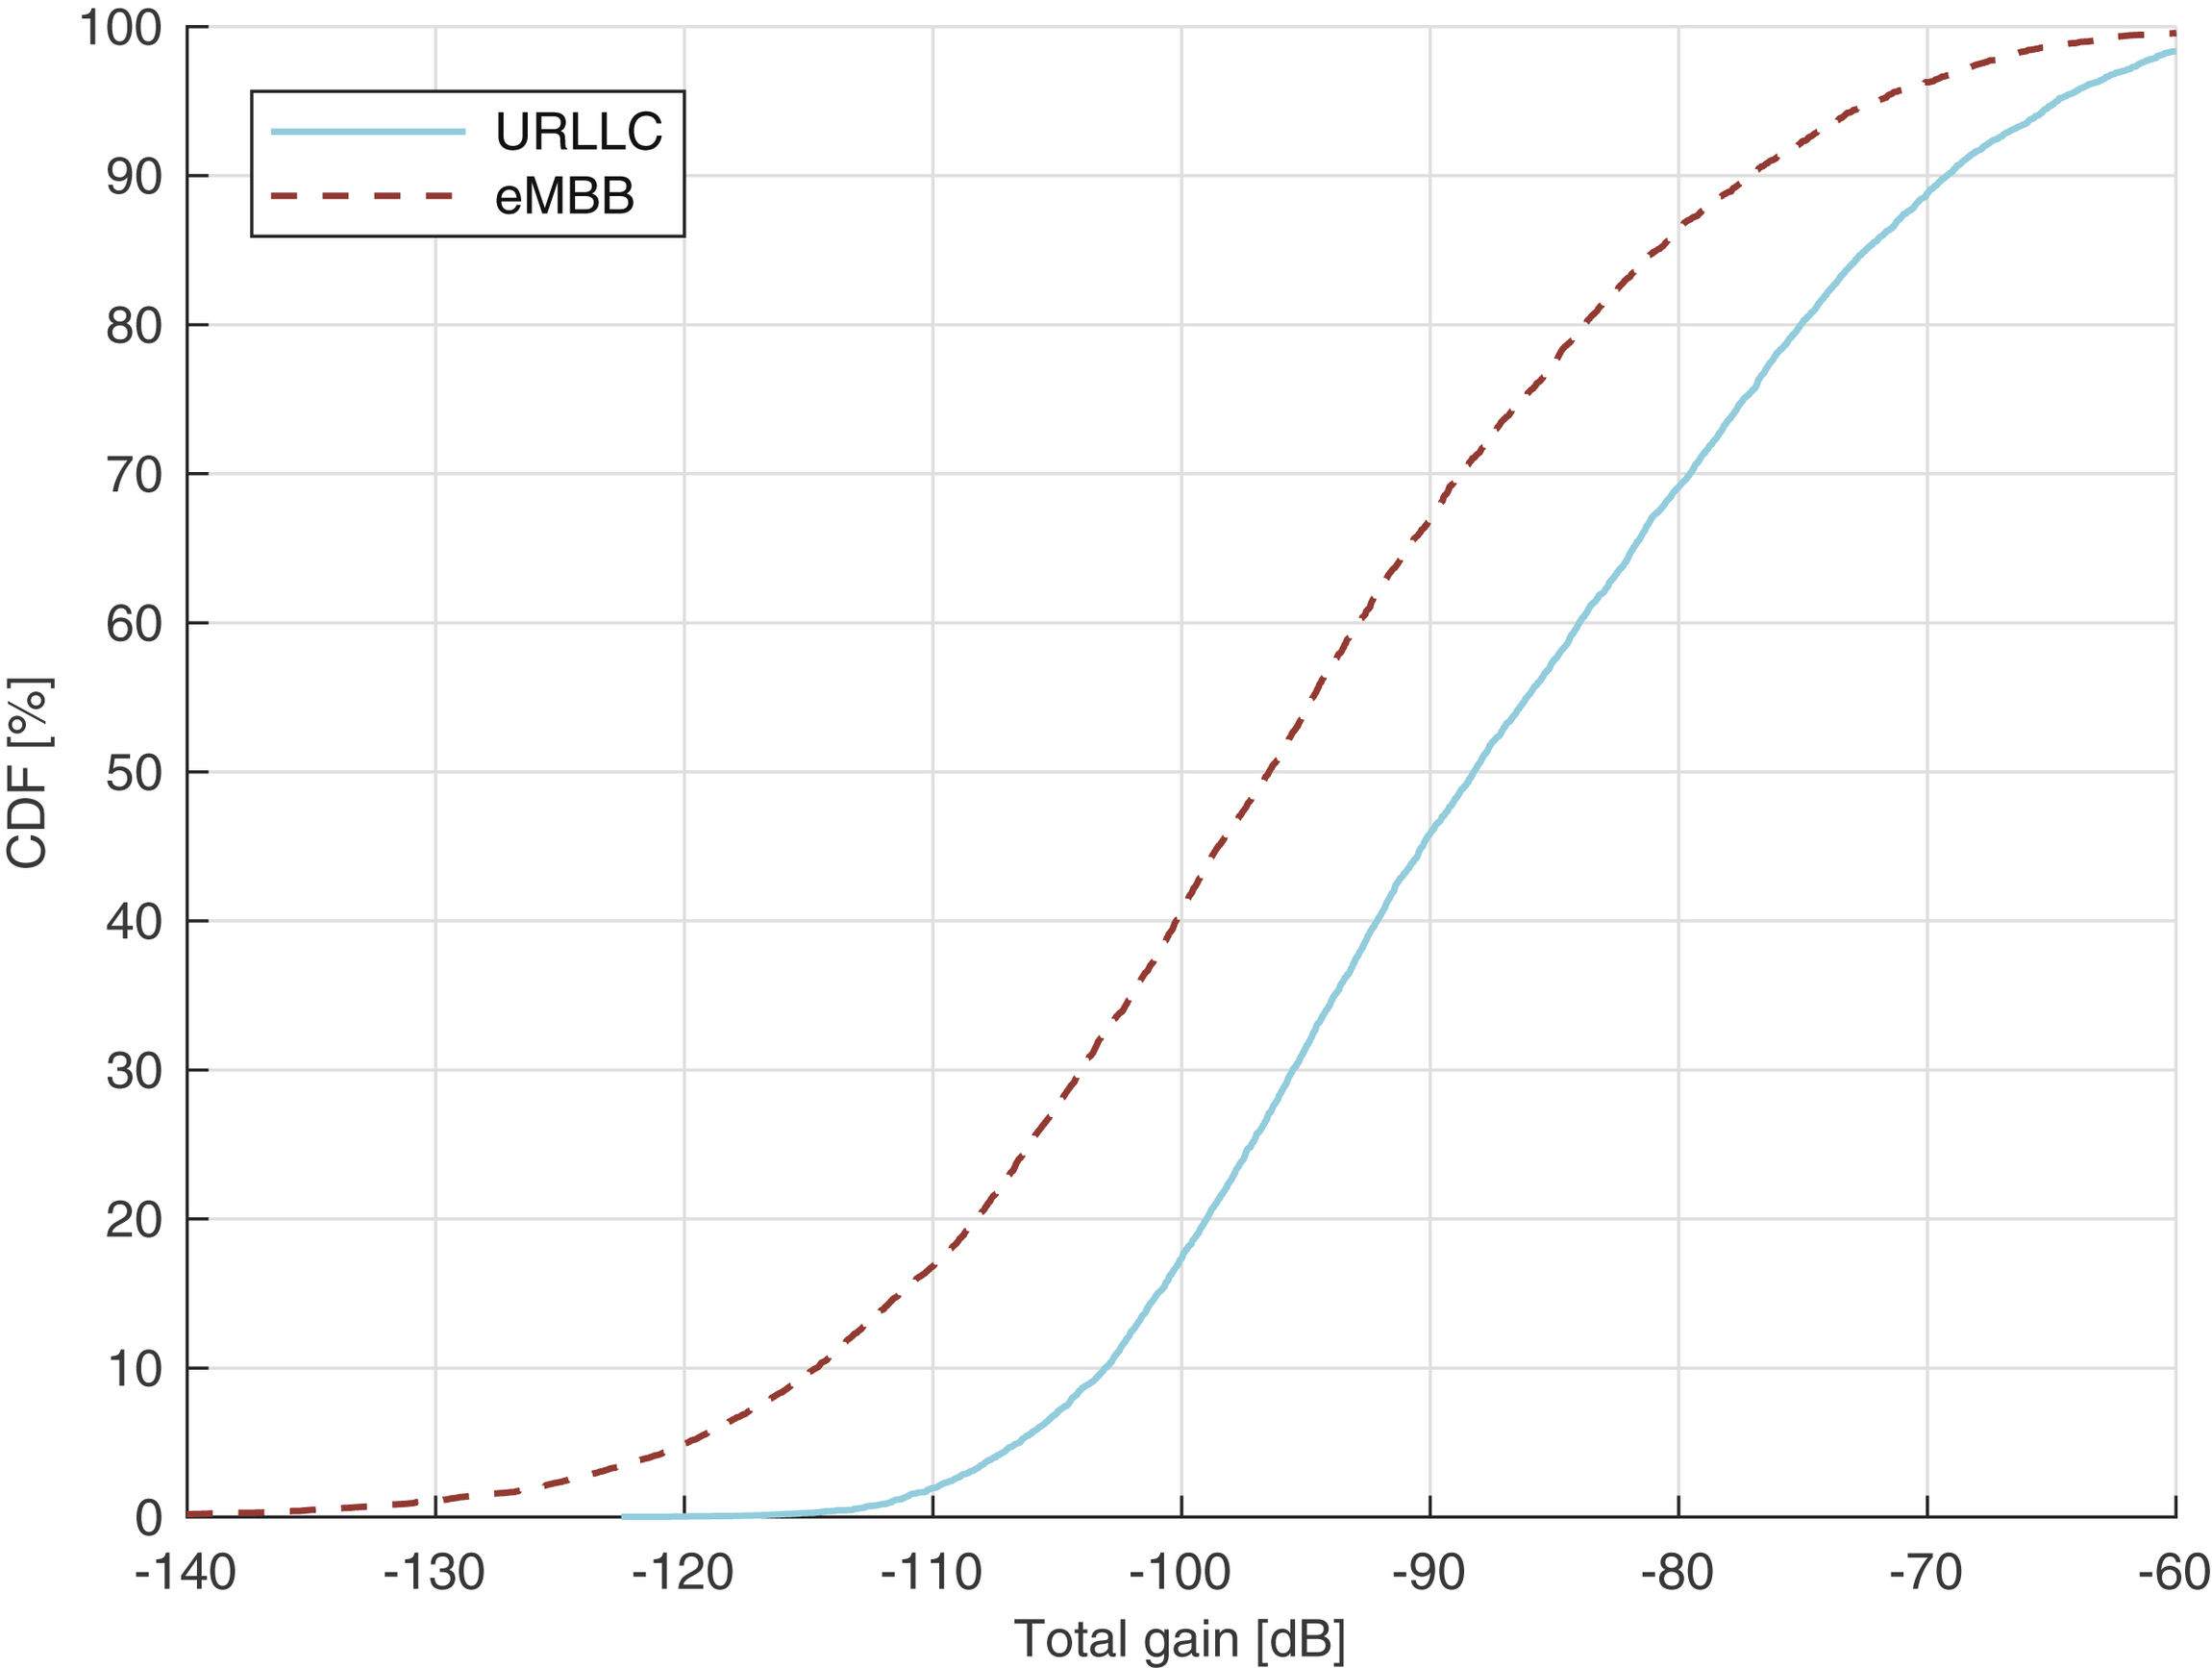
ms with 99,99% reliability, also taking inter-gNB transfer (assumed to take <12 ms) into account. For the deployment scenario, with parameters given in Table 12.17, we assume the URLLC Urban Macro case with UMa B channel [1], with all nodes placed outdoors, giving the total path gain distribution as in Fig. 12.13, including path gain, beamforming gain, and antenna gain.
Table 12.17
| Parameter | Value |
|---|---|
| Carrier frequency and bandwidth | 3.5 GHz, 40 MHz |
| 5G gNB inter-site distance | 500 m |
| Site configuration | 3-sector (3 cells/site) |
| gNB height | 25 m |
| gNB antenna power | 40 W (per cell) |
| gNB noise figure | 5 dB |
| gNB antenna down tilt | 5° |
| Propagation model | ITU Uma B [1] |
| cMTC service traffic | 100 B packet every 1 ms |
| cMTC service latency requirement | 4 ms |
| cMTC service reliability requirement | 99.999% |
| Device height | 1.5 m |
| Device noise figure | 7 dB |
| Uplink power control | 10 dB SNR target, α = 0.8 |
| URLLC device deployment |
100% outdoors
Random, average 1/cell, 5000 positions
|
| eMBB device deployment | 80% indoor, 20% in-car, 5000 positions |
| URLLC device antenna | Omni, 1 W |
| eMBB device antenna | Isotropic, 0.2 W |
In this case, “URLLC” is defined as the devices connected to protection units of the stationary power substations placed outdoors, while “eMBB” represents mobile devices that can be either inside buildings or outdoors.
The NR system configuration is set according to Table 12.18, assuming a realistic TDD pattern for eMBB services. In the used 3.5
GHz band, the SINR distribution in an unloaded respective fully loaded case is shown Fig. 12.14.
As can be seen, the impact on the interference is significant when there is a high load in the system, pushing the median of the SINR distribution by roughly 20
dB in the downlink and roughly 3–4
dB in the uplink. The lower impact on uplink is due to efficient power control that limits the interference.
The activity level in the system, the utilization, will mainly be set by the traffic of eMBB users in the system, and will therefore vary. At the same time we expect the service to work well regardless of traffic level and without having to coordinate transmissions between cells to minimize interference.
We are now ready to study the performance of the substation protection service on the selected NR system in the chosen scenario. Calculating the total reliability as function of SINR as in the previous sections, using link simulation with parameters as in Table 12.19,
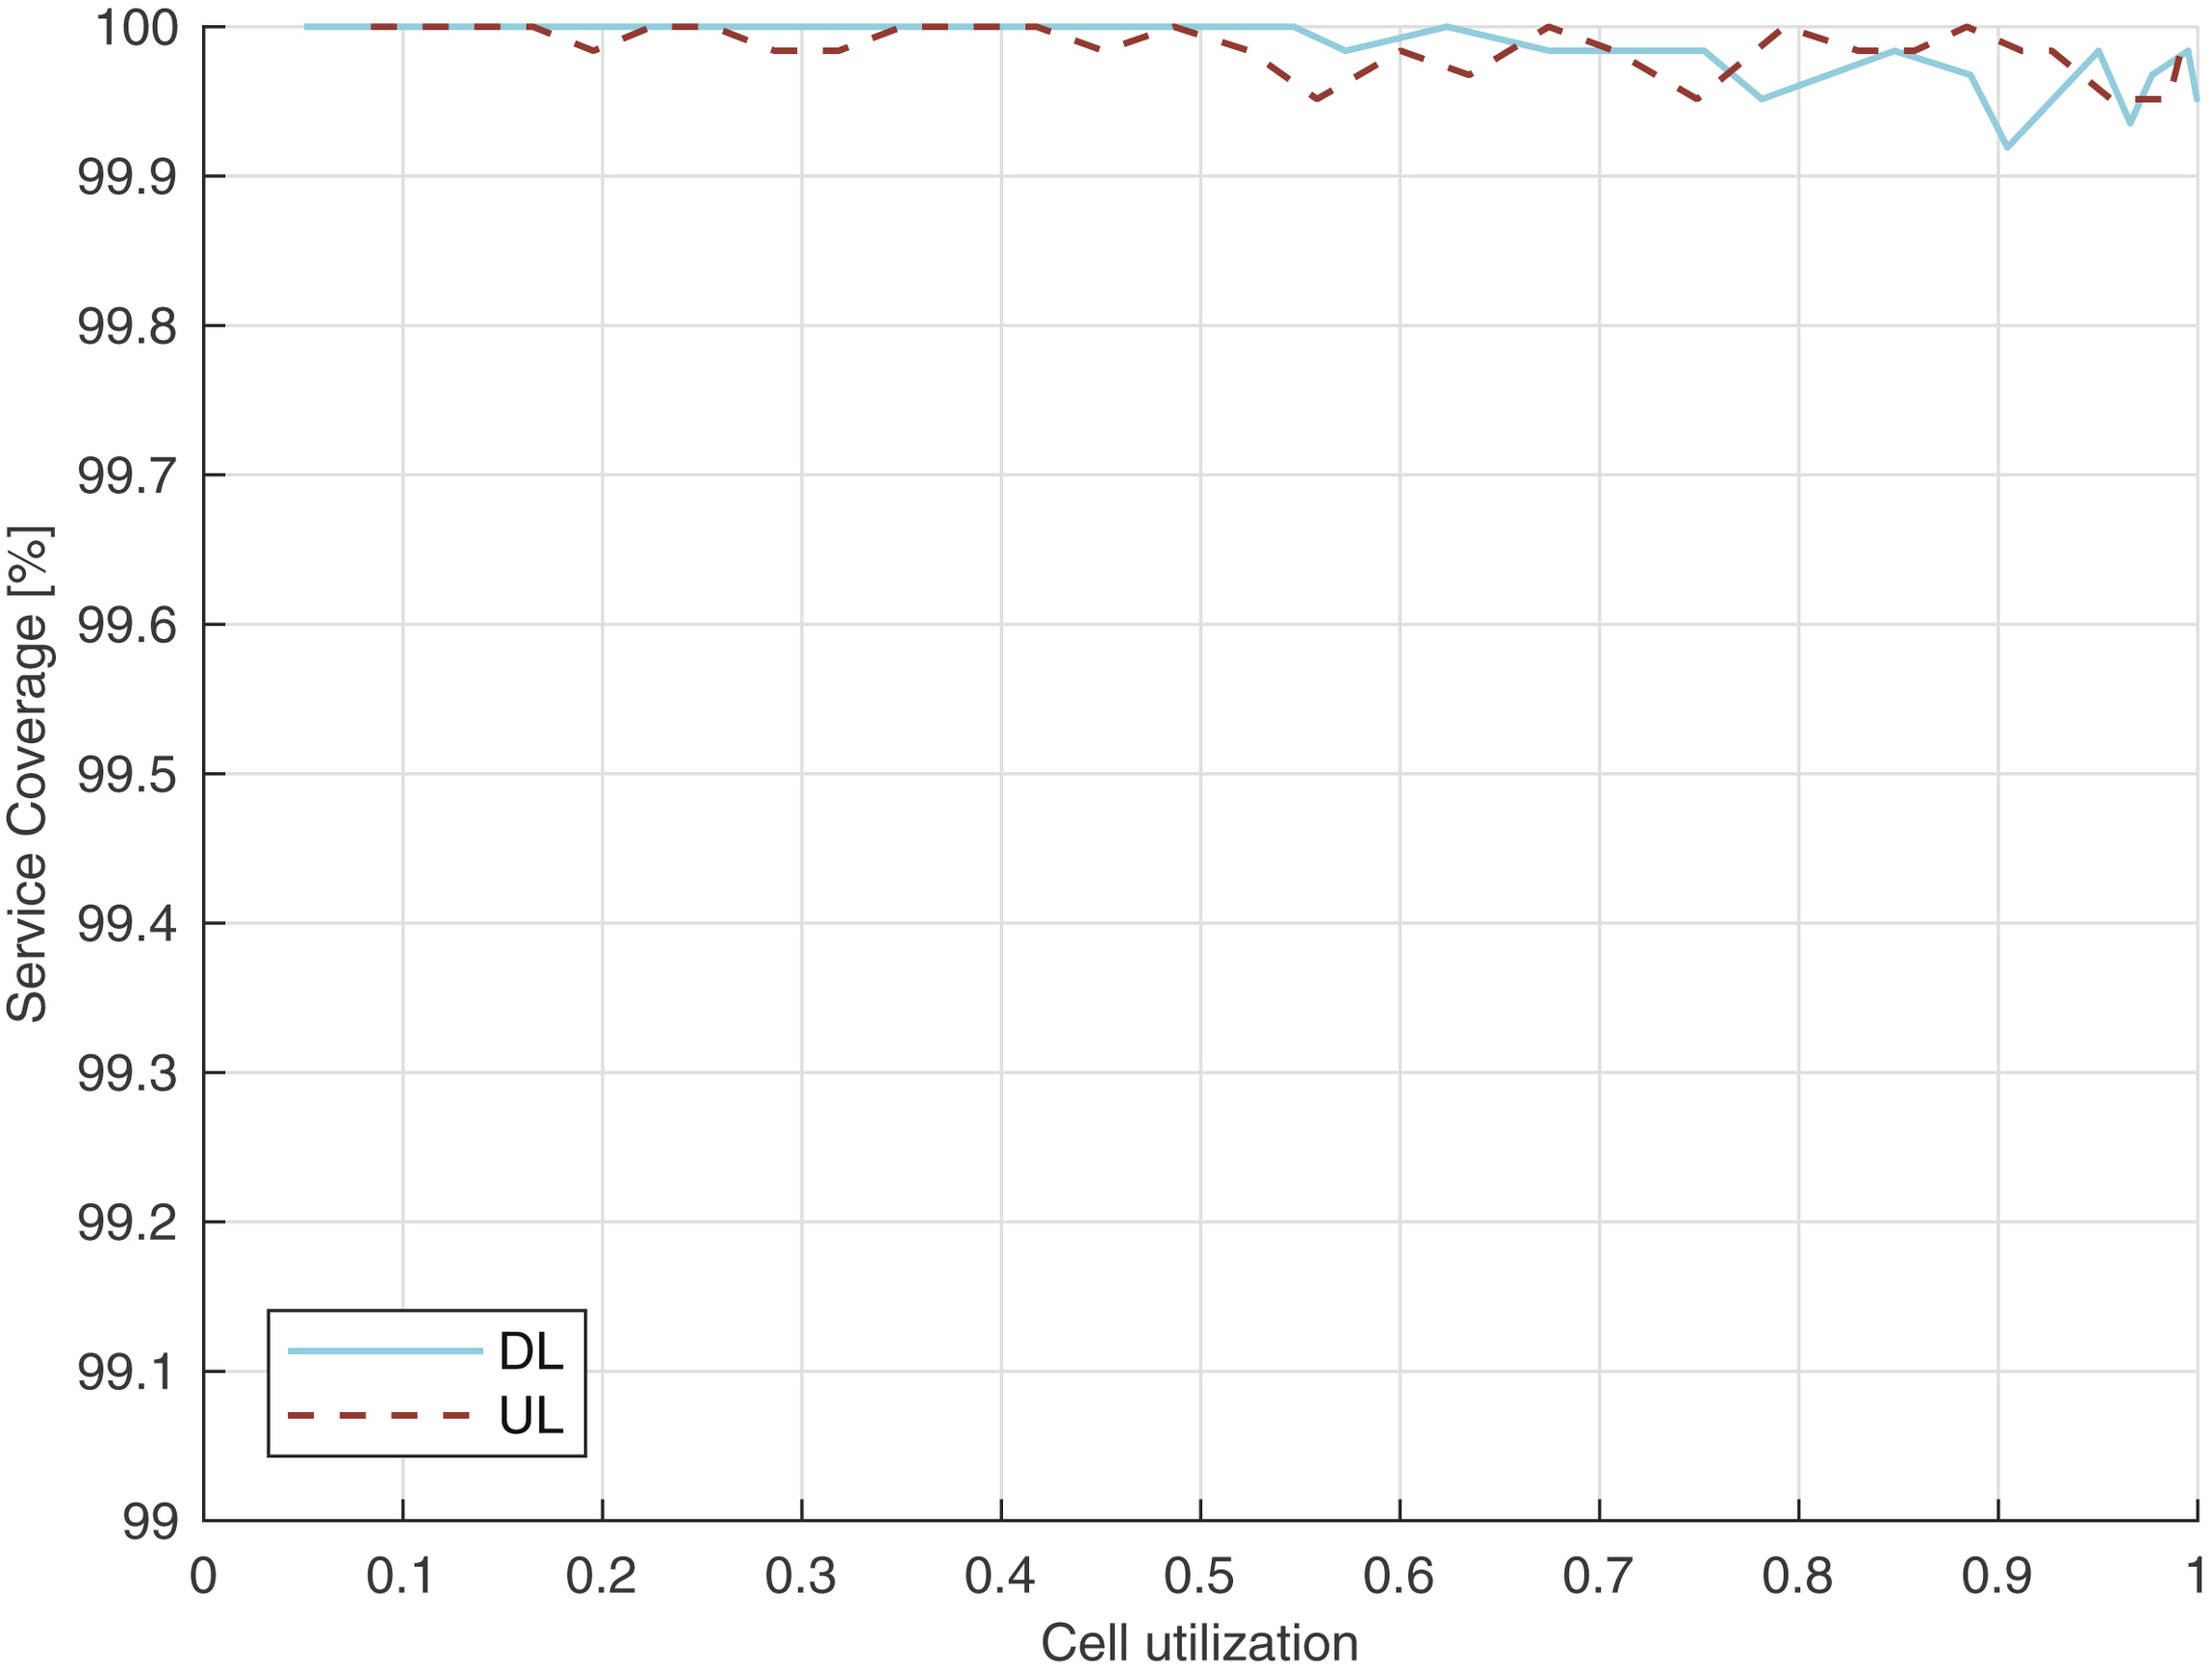
and comparing with the service definition we find the service coverage as of Fig. 12.15. The results indicate that the cMTC protection service can be consistently delivered by NR URLLC to more than 99.9% of studied device locations at high cell loads (up to 90% cell utilization), implying that only one in 1000 substation locations can't be reliably protected with the studied setup. Since the substations are stationary we would expect the coverage to be rather consistent over time, and for substations close to the coverage edge, extra measures such as directional antennas could be taken to improve coverage.
Table 12.18
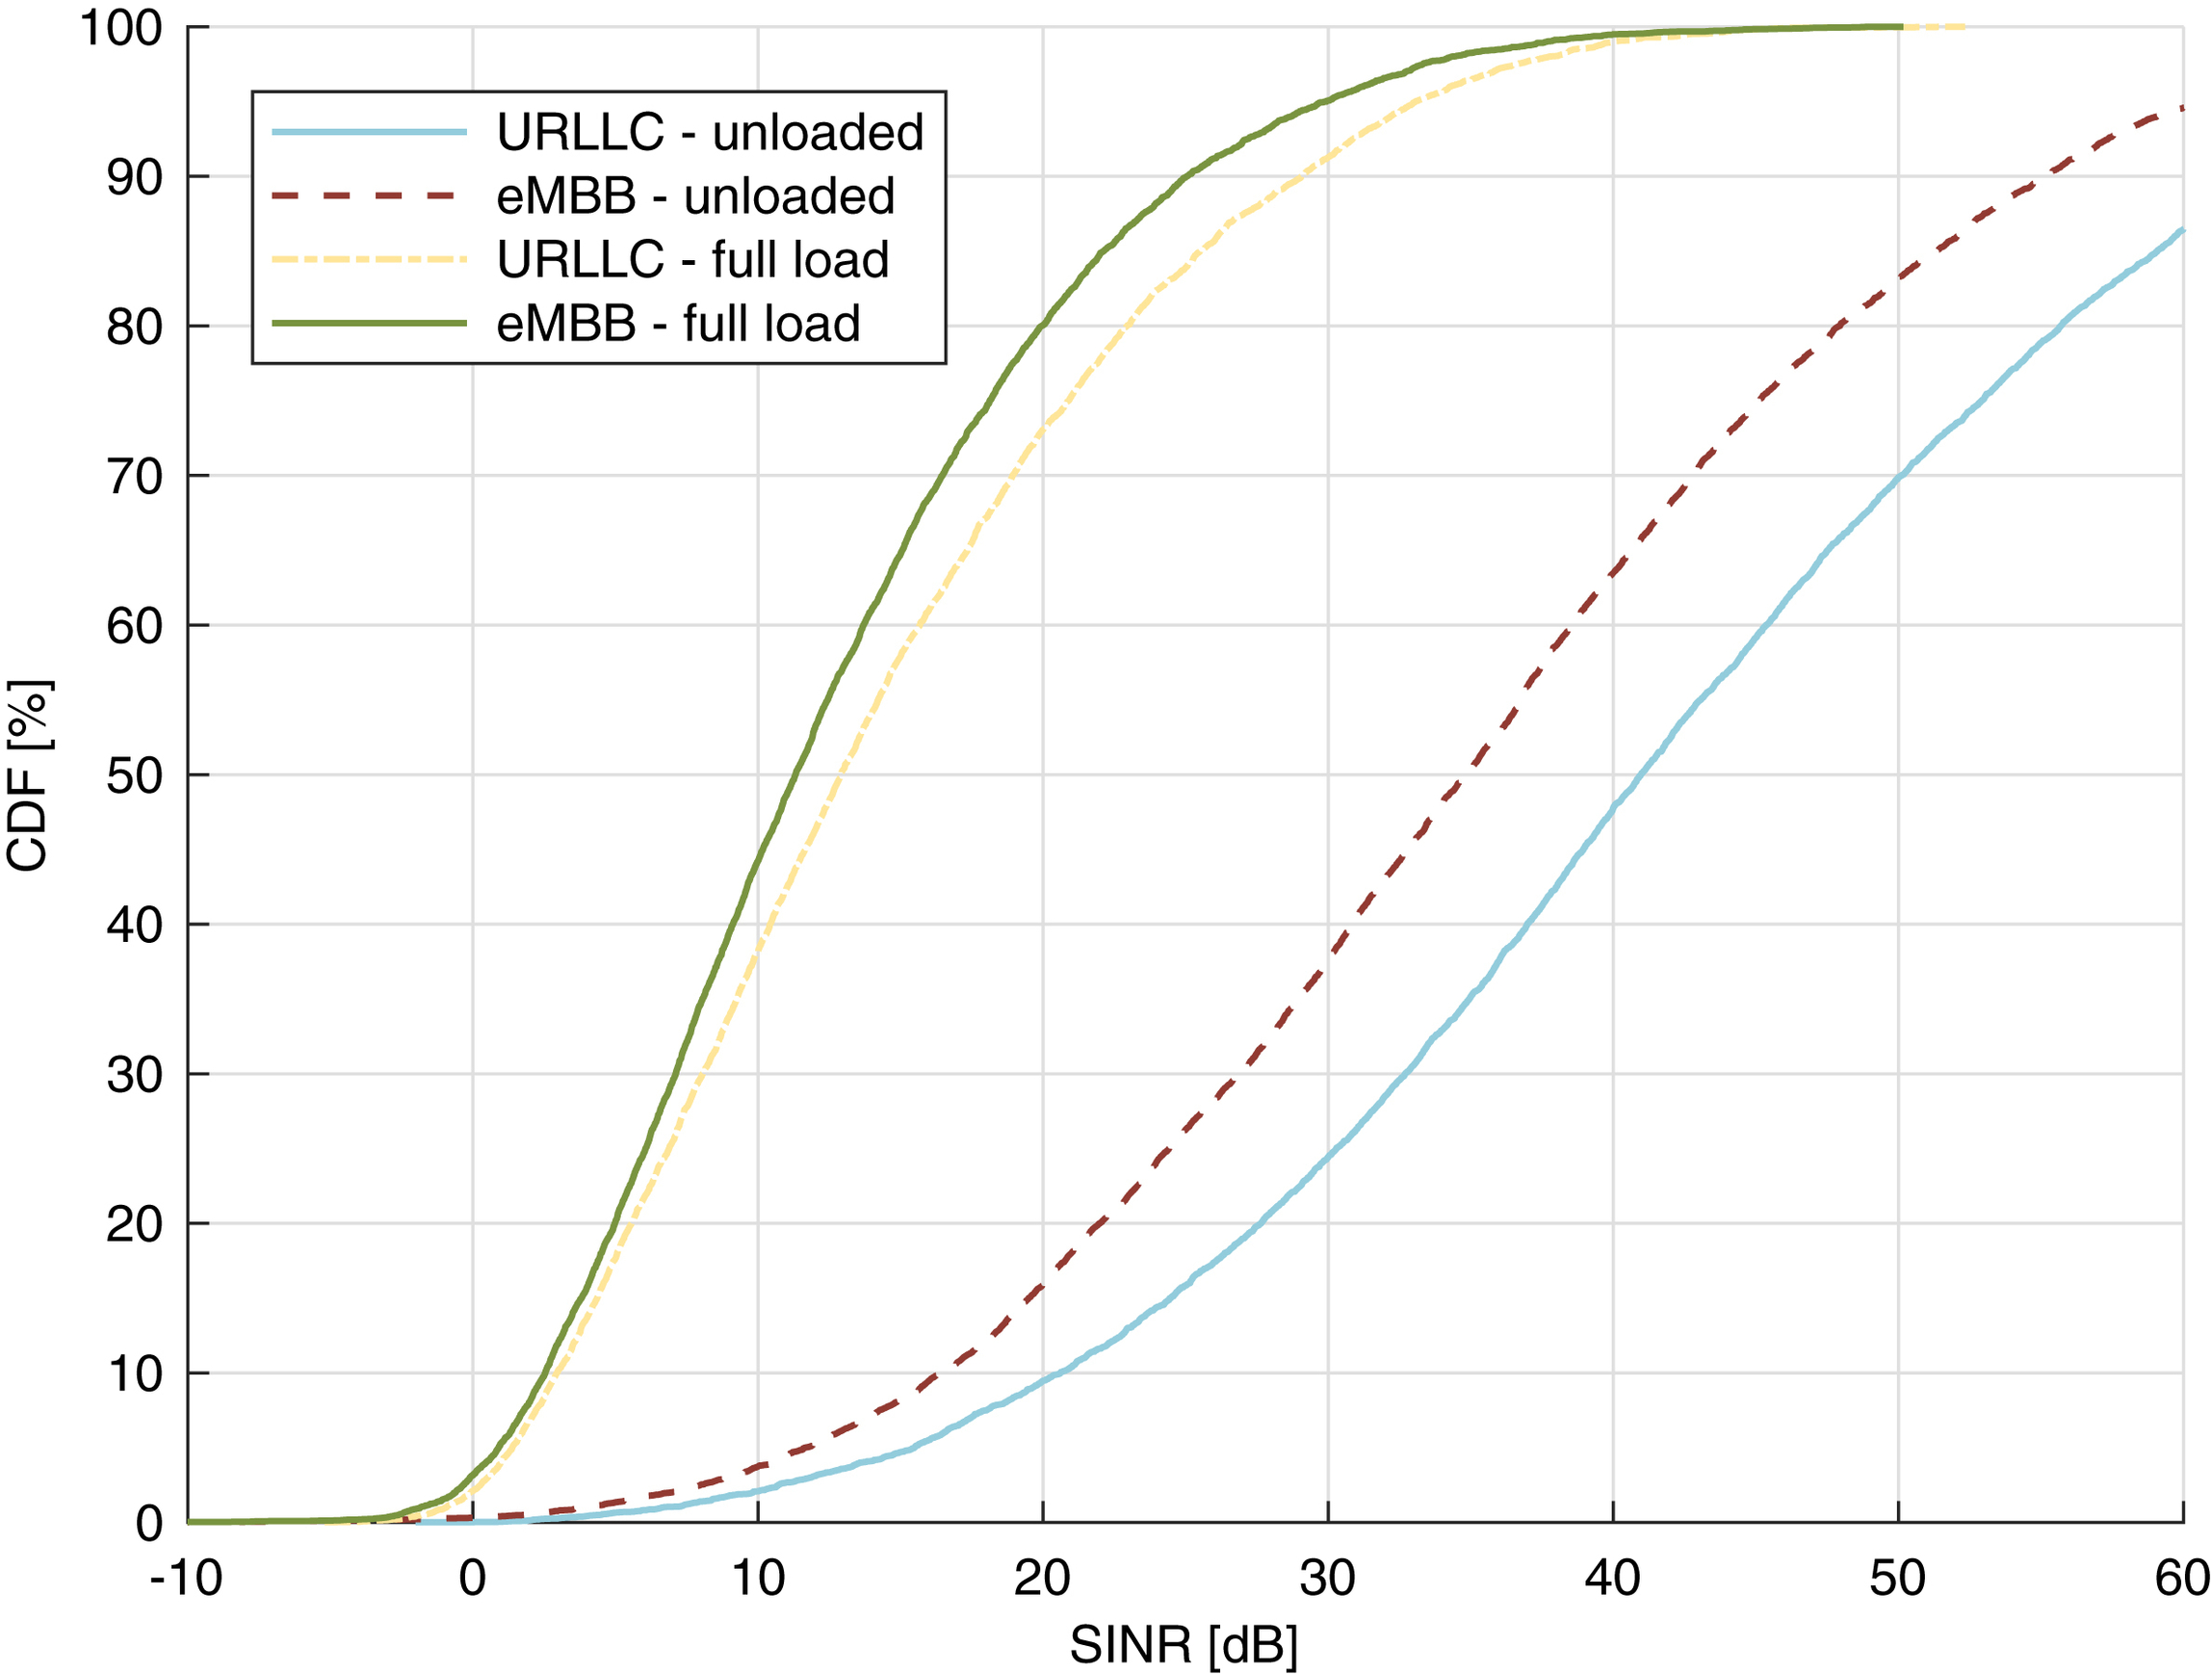
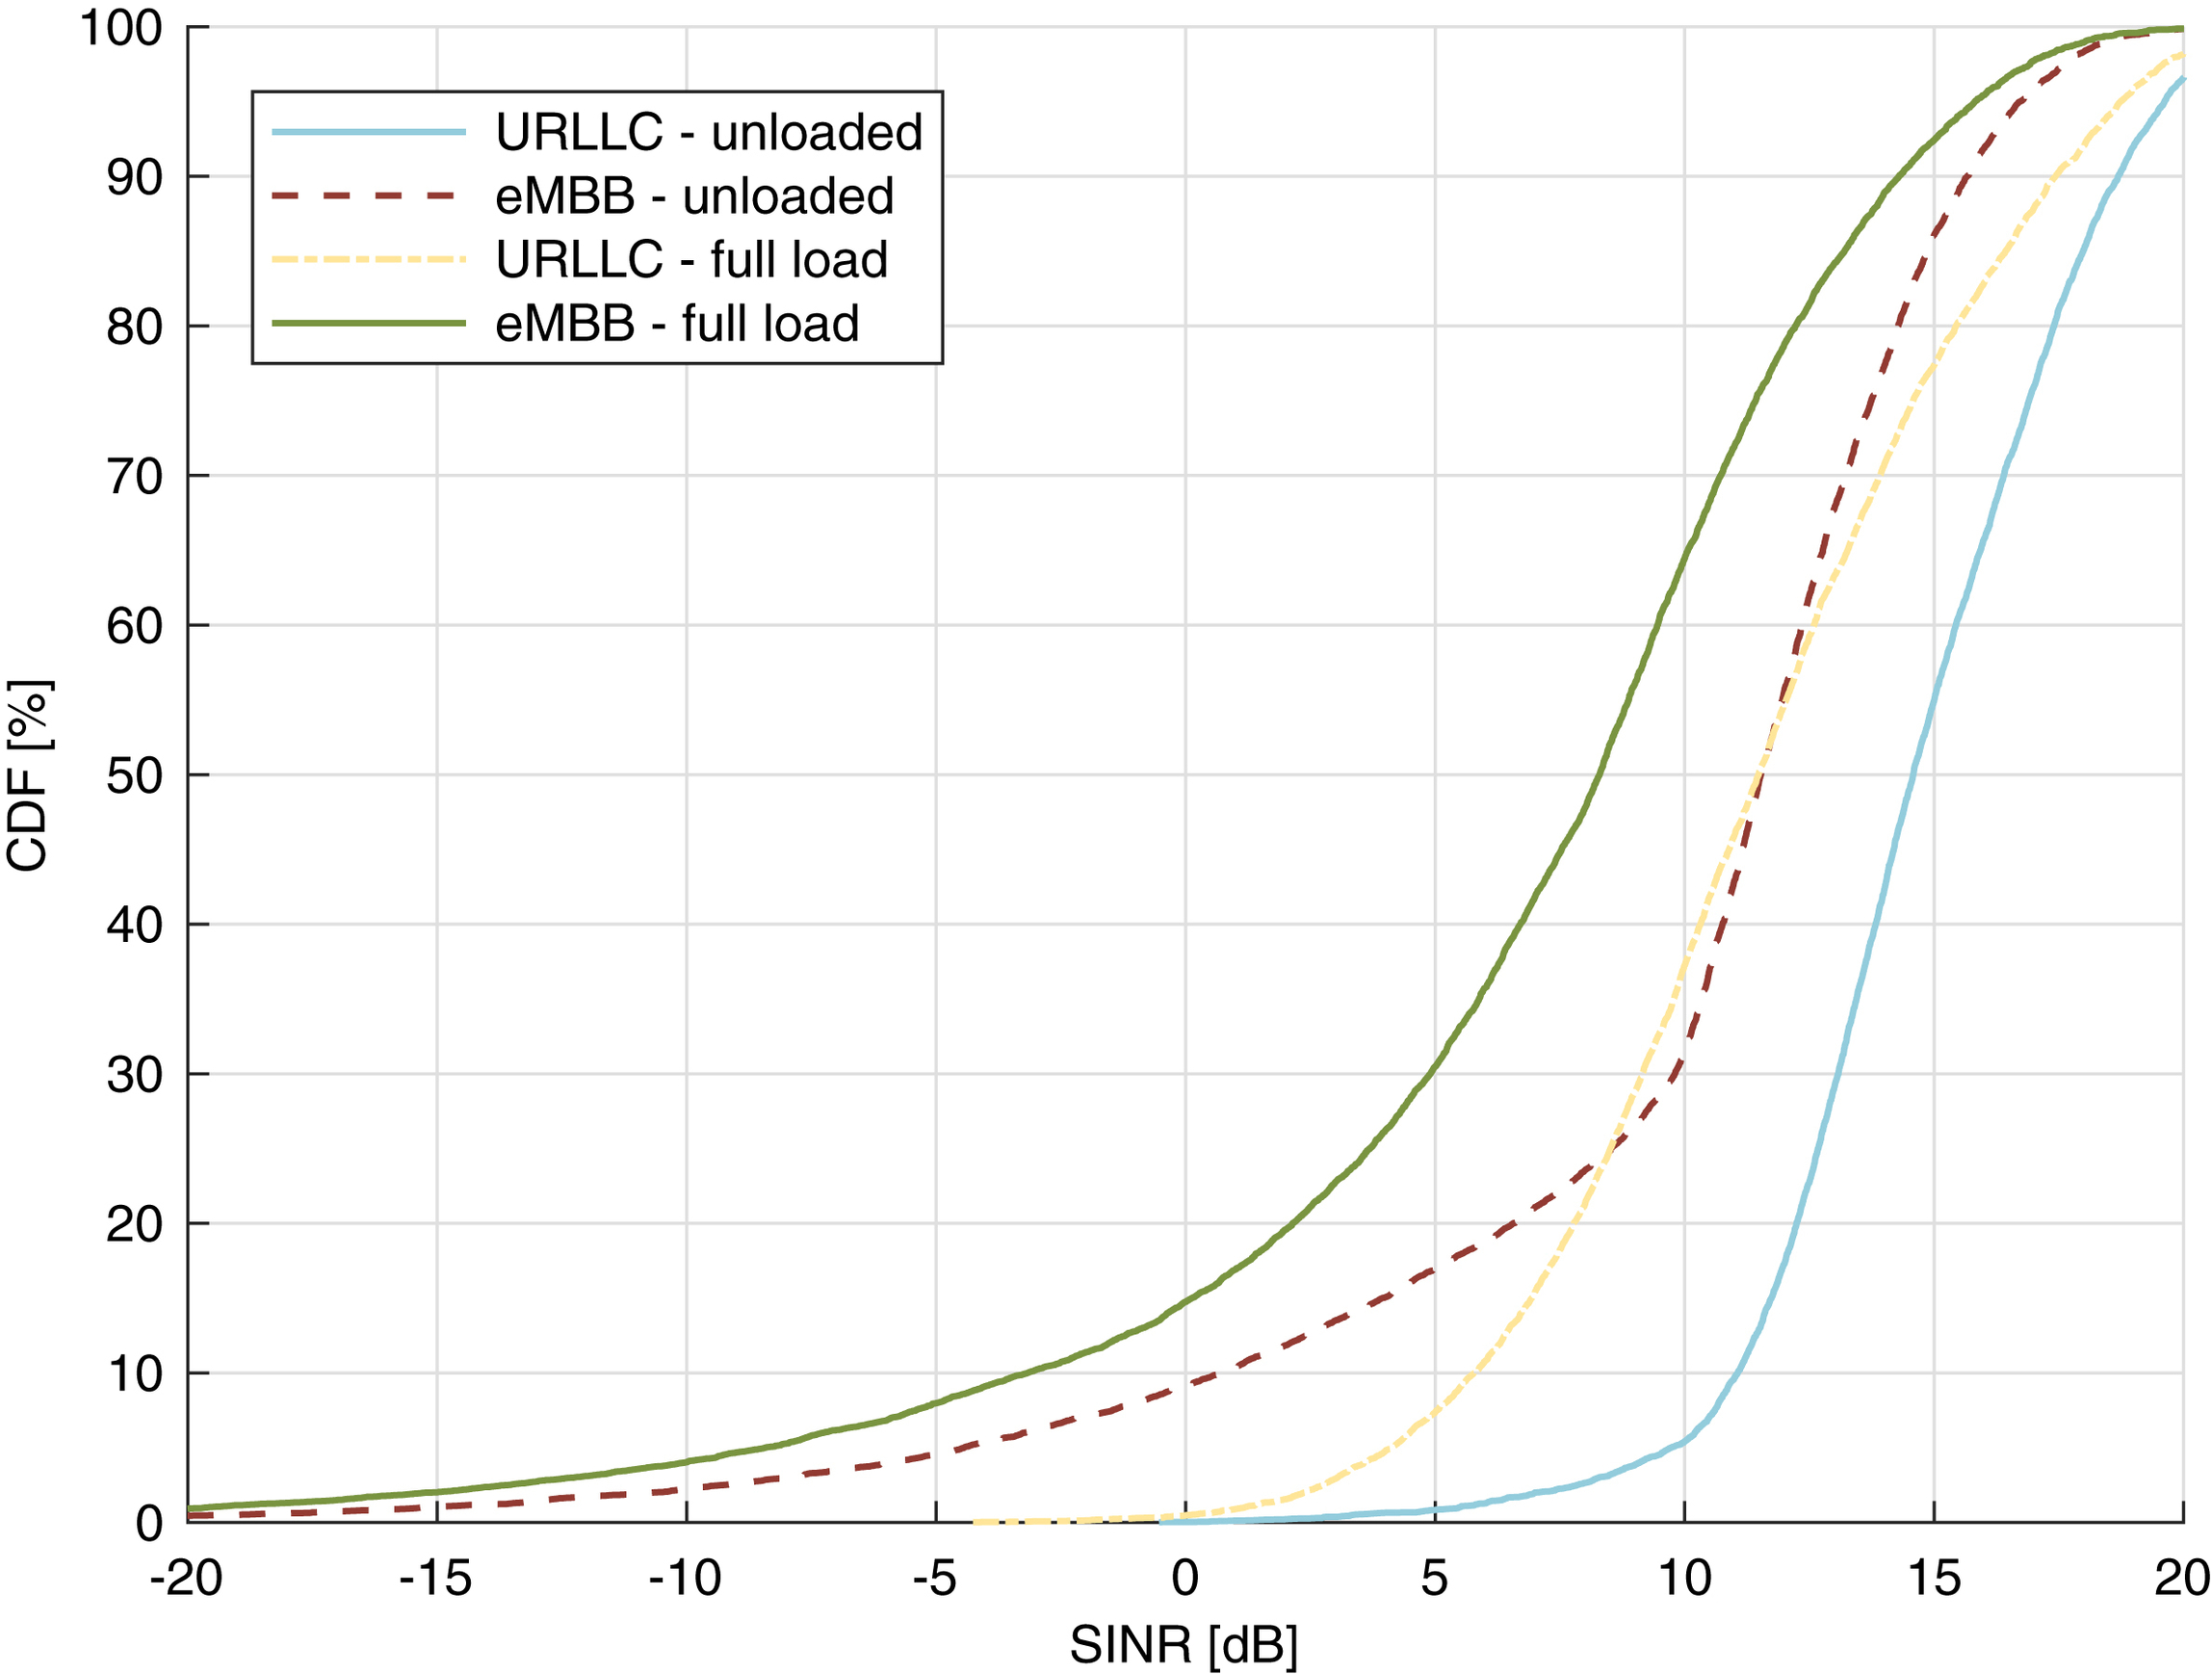
Table 12.19
| Parameter | Value |
|---|---|
| Carrier | 3.5 GHz, 40 MHz bandwidth |
| Channel model | TDL-C [1] |
| Delay spread | 300 ns |
| PDSCH/PUSCH |
LDPC, 32
B, MCS {0,3,6,7,11,15,19} (MCS table 3), transmission length 14 OFDM symbols,
1 frontloaded DMRS,
1-3 HARQ retransmissions
|
| PUCCH | 2 OS with frequency hopping, 1 bit |
| PDCCH | Polar code, 40 bits excl. CRC, AL8 |
12.3.2. A local-area service example: factory automation potential
We also want to study whether NR URLLC has the potential to handle more challenging cMTC scenarios. To find out we can look at the use case of factory automation, and specifically wirelessly providing motion commands and sensor updates to and from industry robots. In this example we define the cMTC service as delivering sensor and actuator data
every 1
ms with packets of 32
B size in uplink and downlink. These critical packets should be delivered within 1
ms with a reliability of 99,999%. The industry robots equipped with NR devices are assumed to be randomly moving around in the factory and performing critical tasks and full coverage is therefore expected.
The factory environment is modeled around 10 assembly lines and a central aisle. The assembly lines are surrounded by 3
m high and 0.2
m wide metallic fences, separated by 0.2
m in rows. Other types of equipment and objects are modeled as random metallic blockers distributed within the factory volume, as illustrated in Fig. 12.16. The blockers are rectangles with a uniform height distribution in the range 1–3
m, a uniform width distribution in the range 1–2
m, having a random rotation around the vertical axis, and placed randomly in the factory with a density of 0.1 blockers/m2. Including blockers and fences in the model has an impact on the radio coverage in the factory, adding more realism to the scenario.
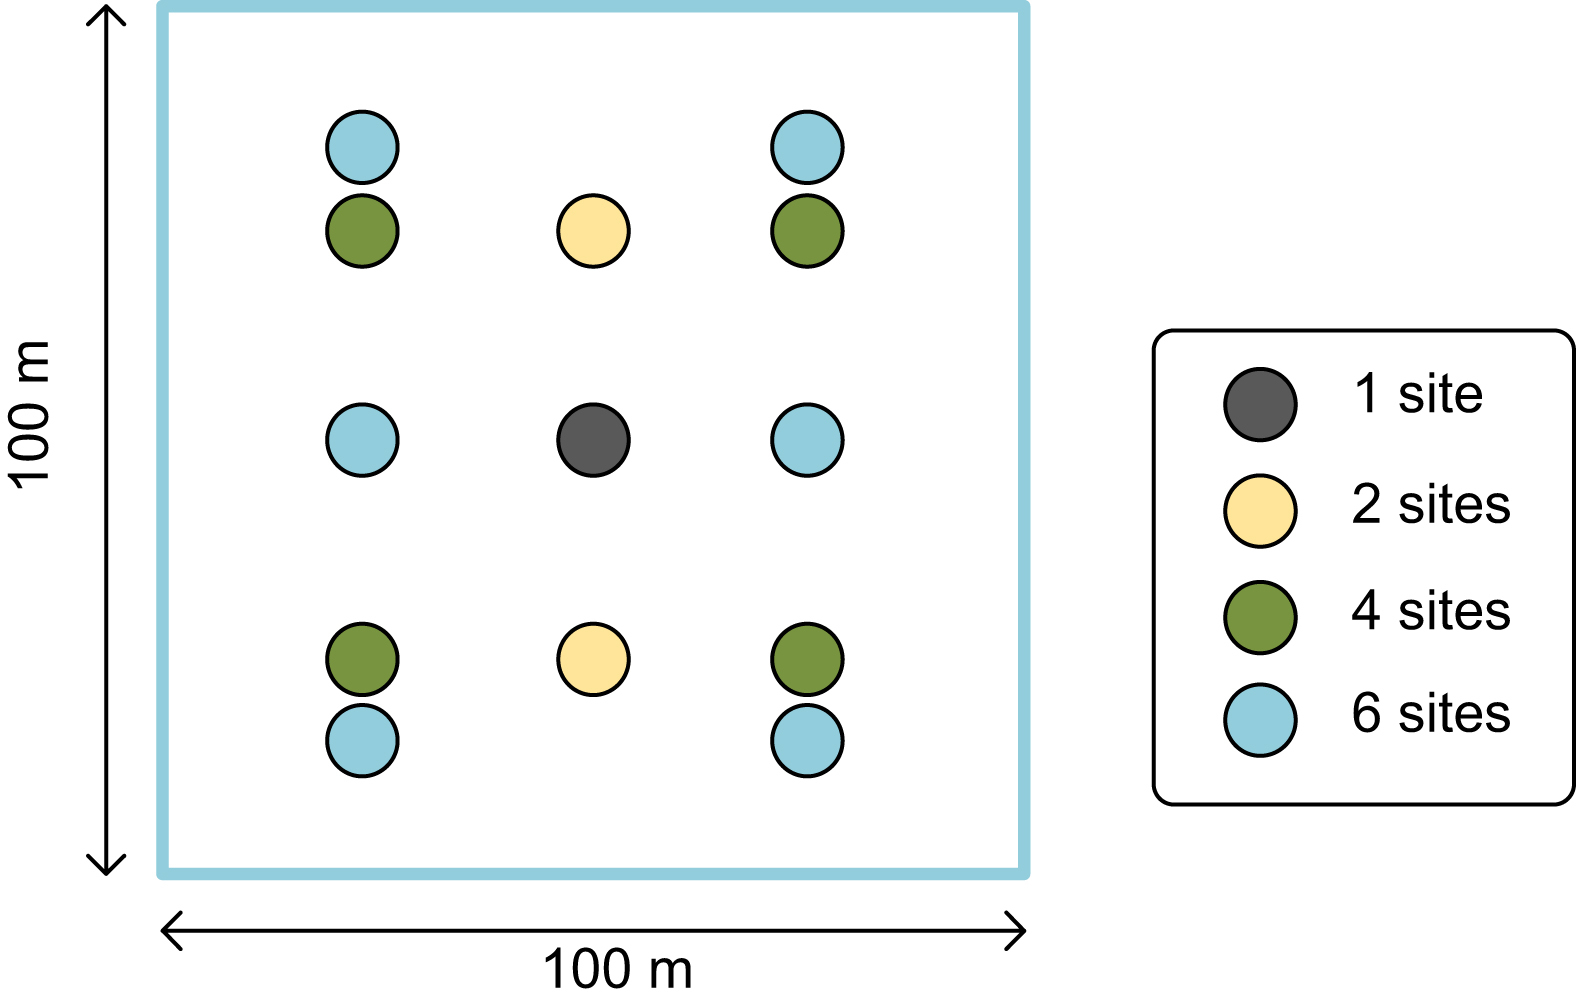
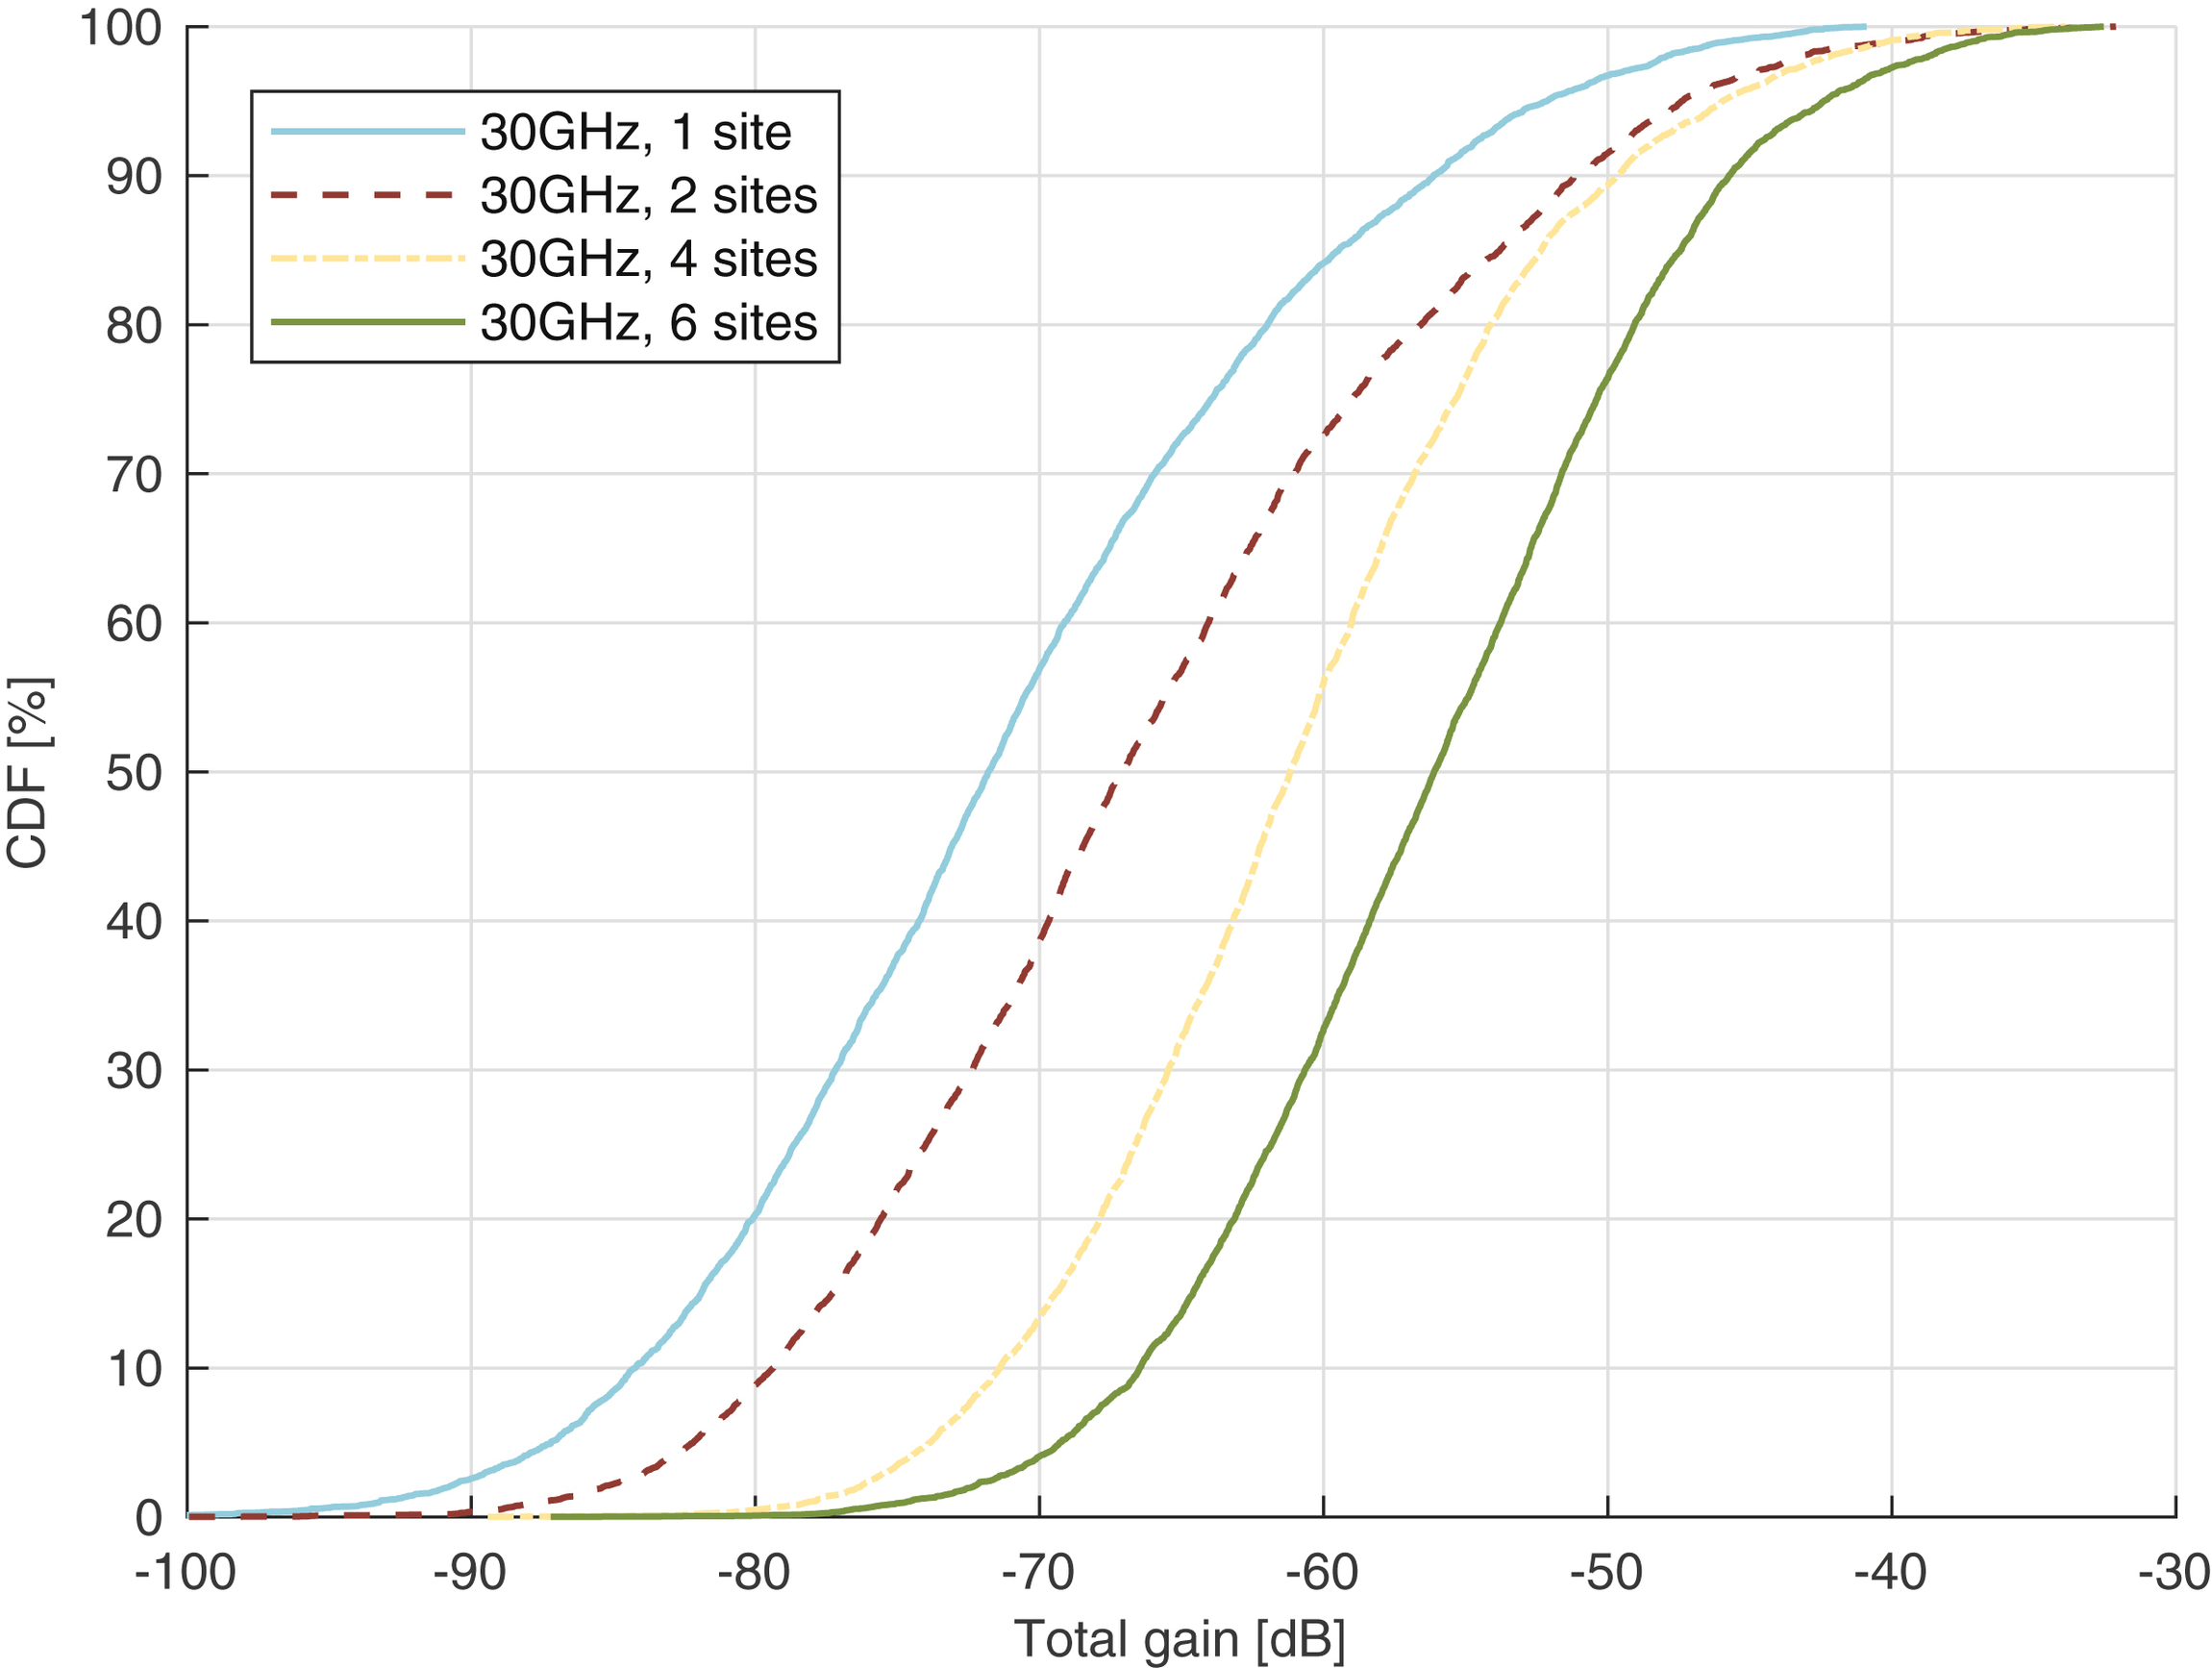
In the ceiling of the factory hall, different arrangements of NR base stations can be mounted. In this scenario, the configurations investigated are 1, 2, 4 or 6 base stations, see illustration in Fig. 12.17. Other system parameters used are according to Table 12.20 and link parameters according to Table 12.21.
The used carrier is 30
GHz, where a downlink-uplink-downlink-uplink TDD slot pattern is run with 120
kHz SCS and 7 OS mini-slots. Following the latency evaluation in Section 12.2.1.2.2 we find that 1 transmission attempt can be done in downlink and uplink, assuming CGs, within 1
ms.
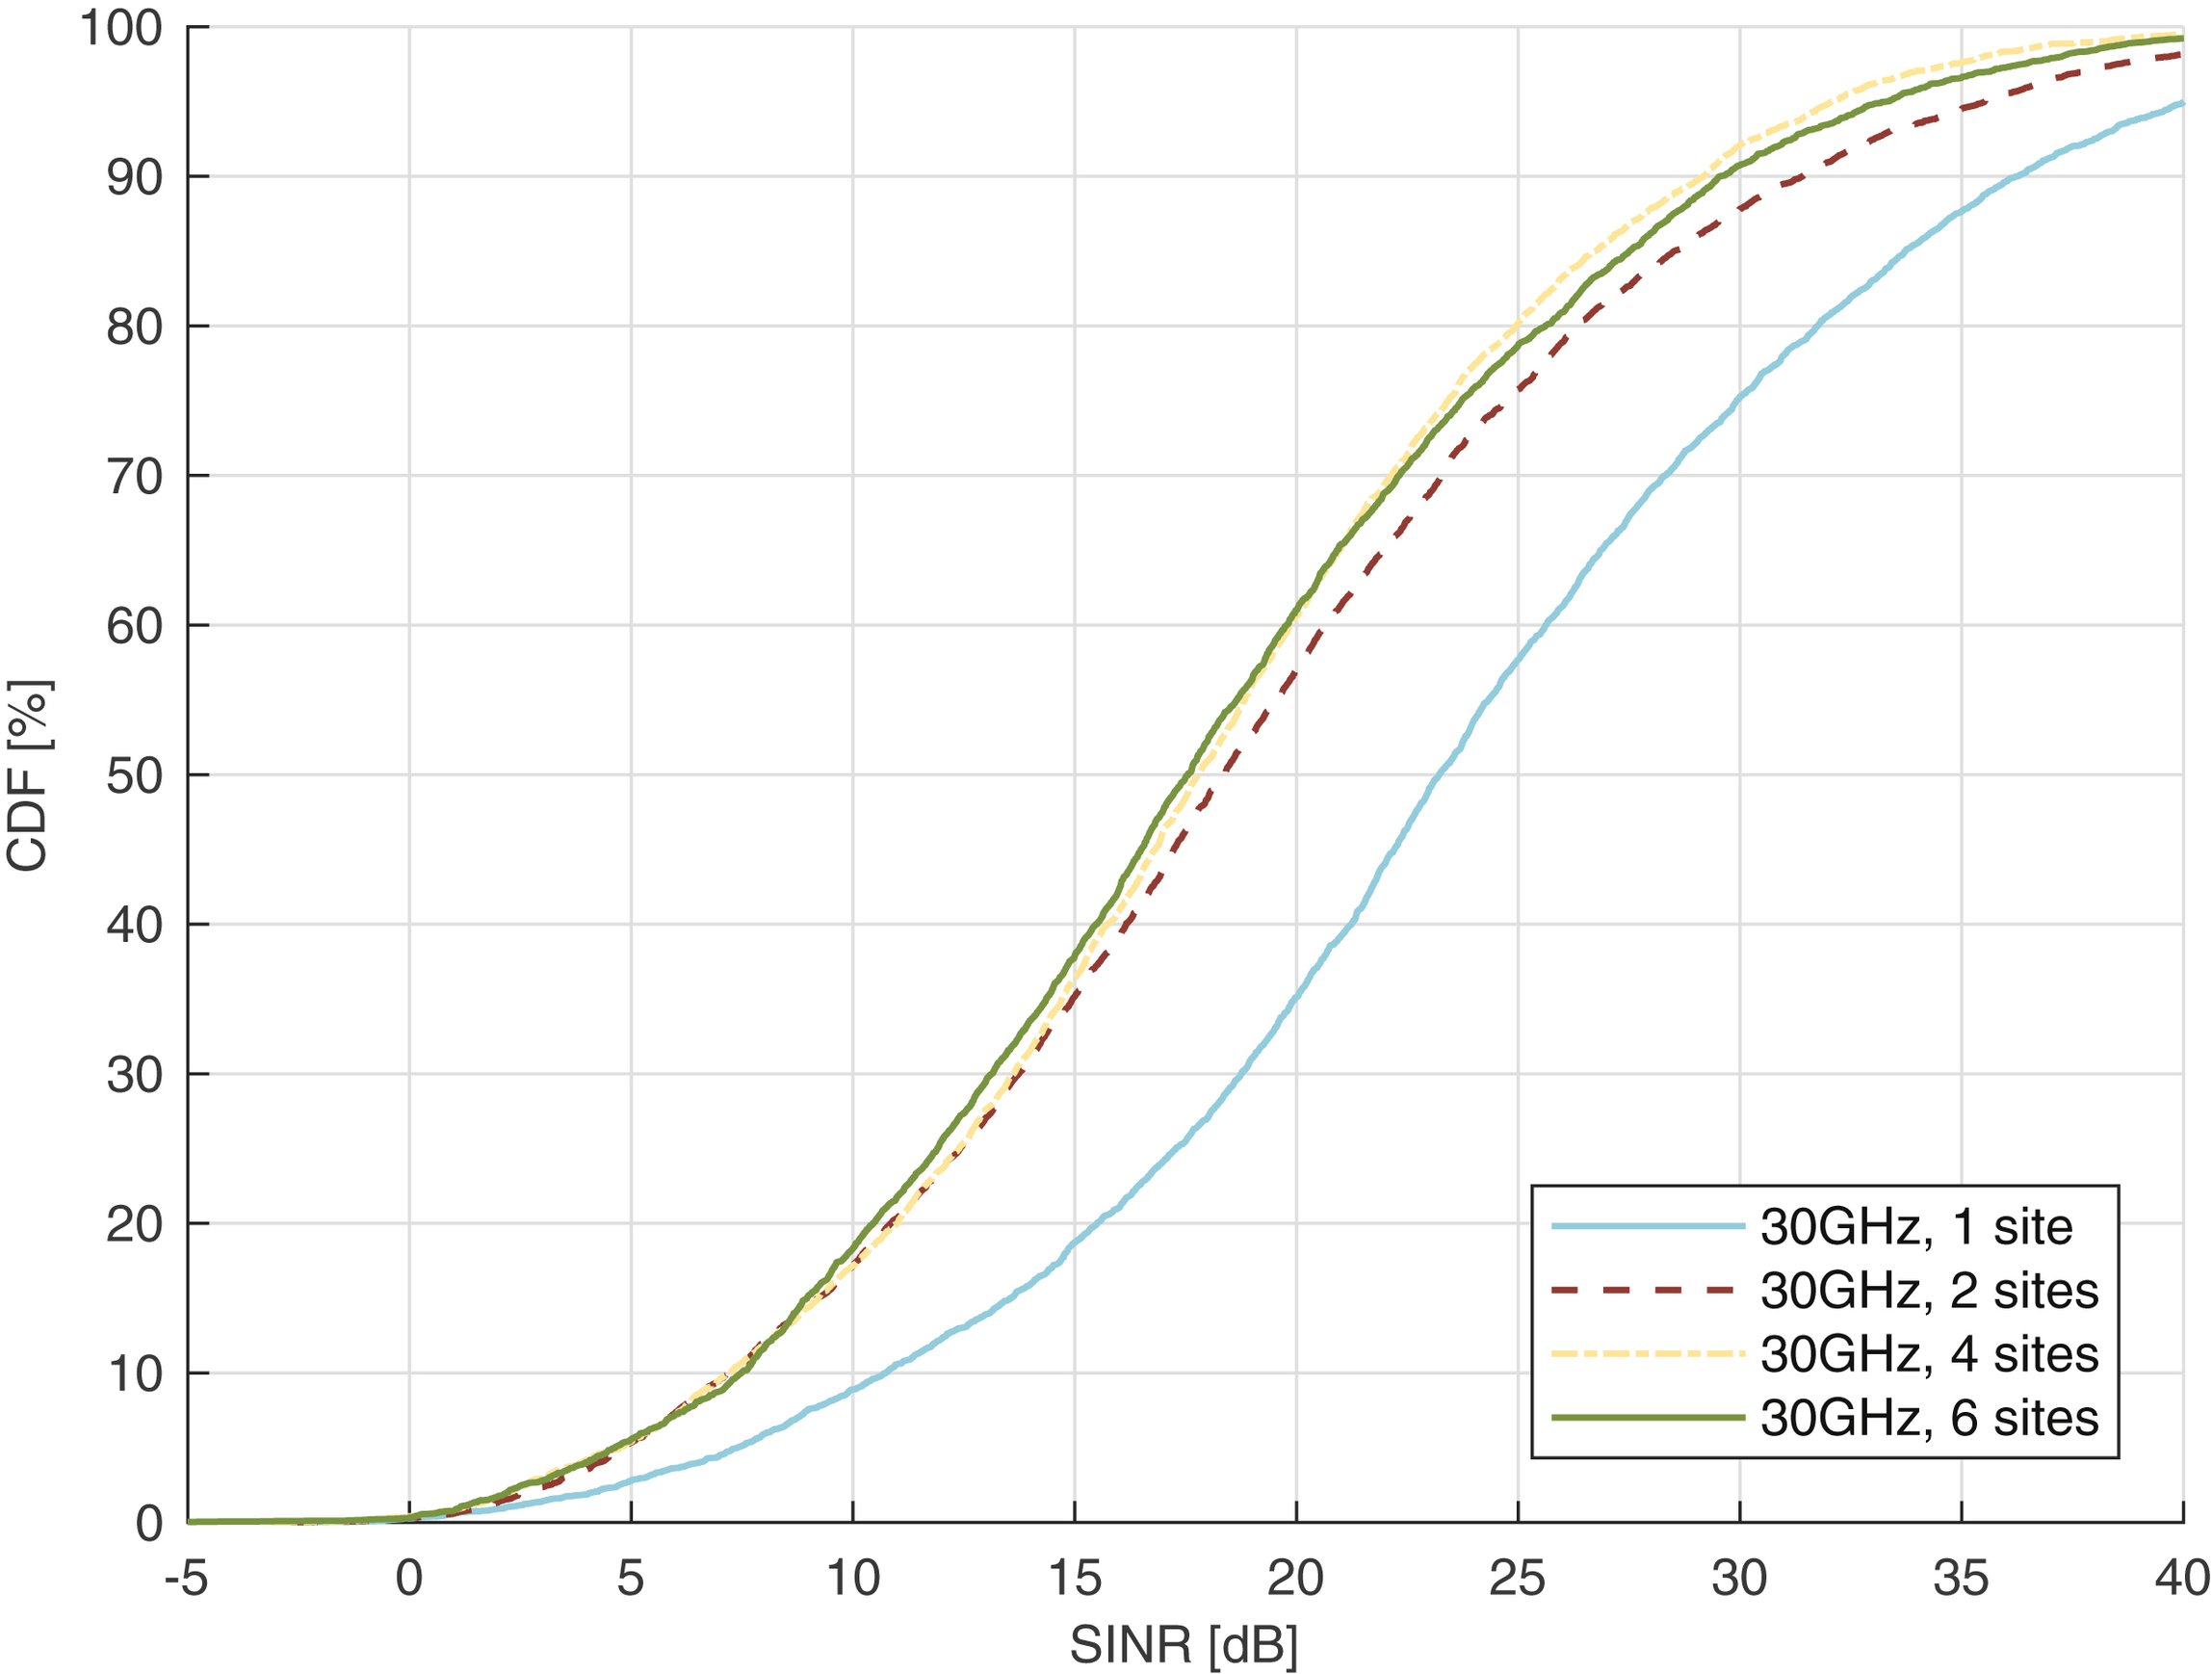
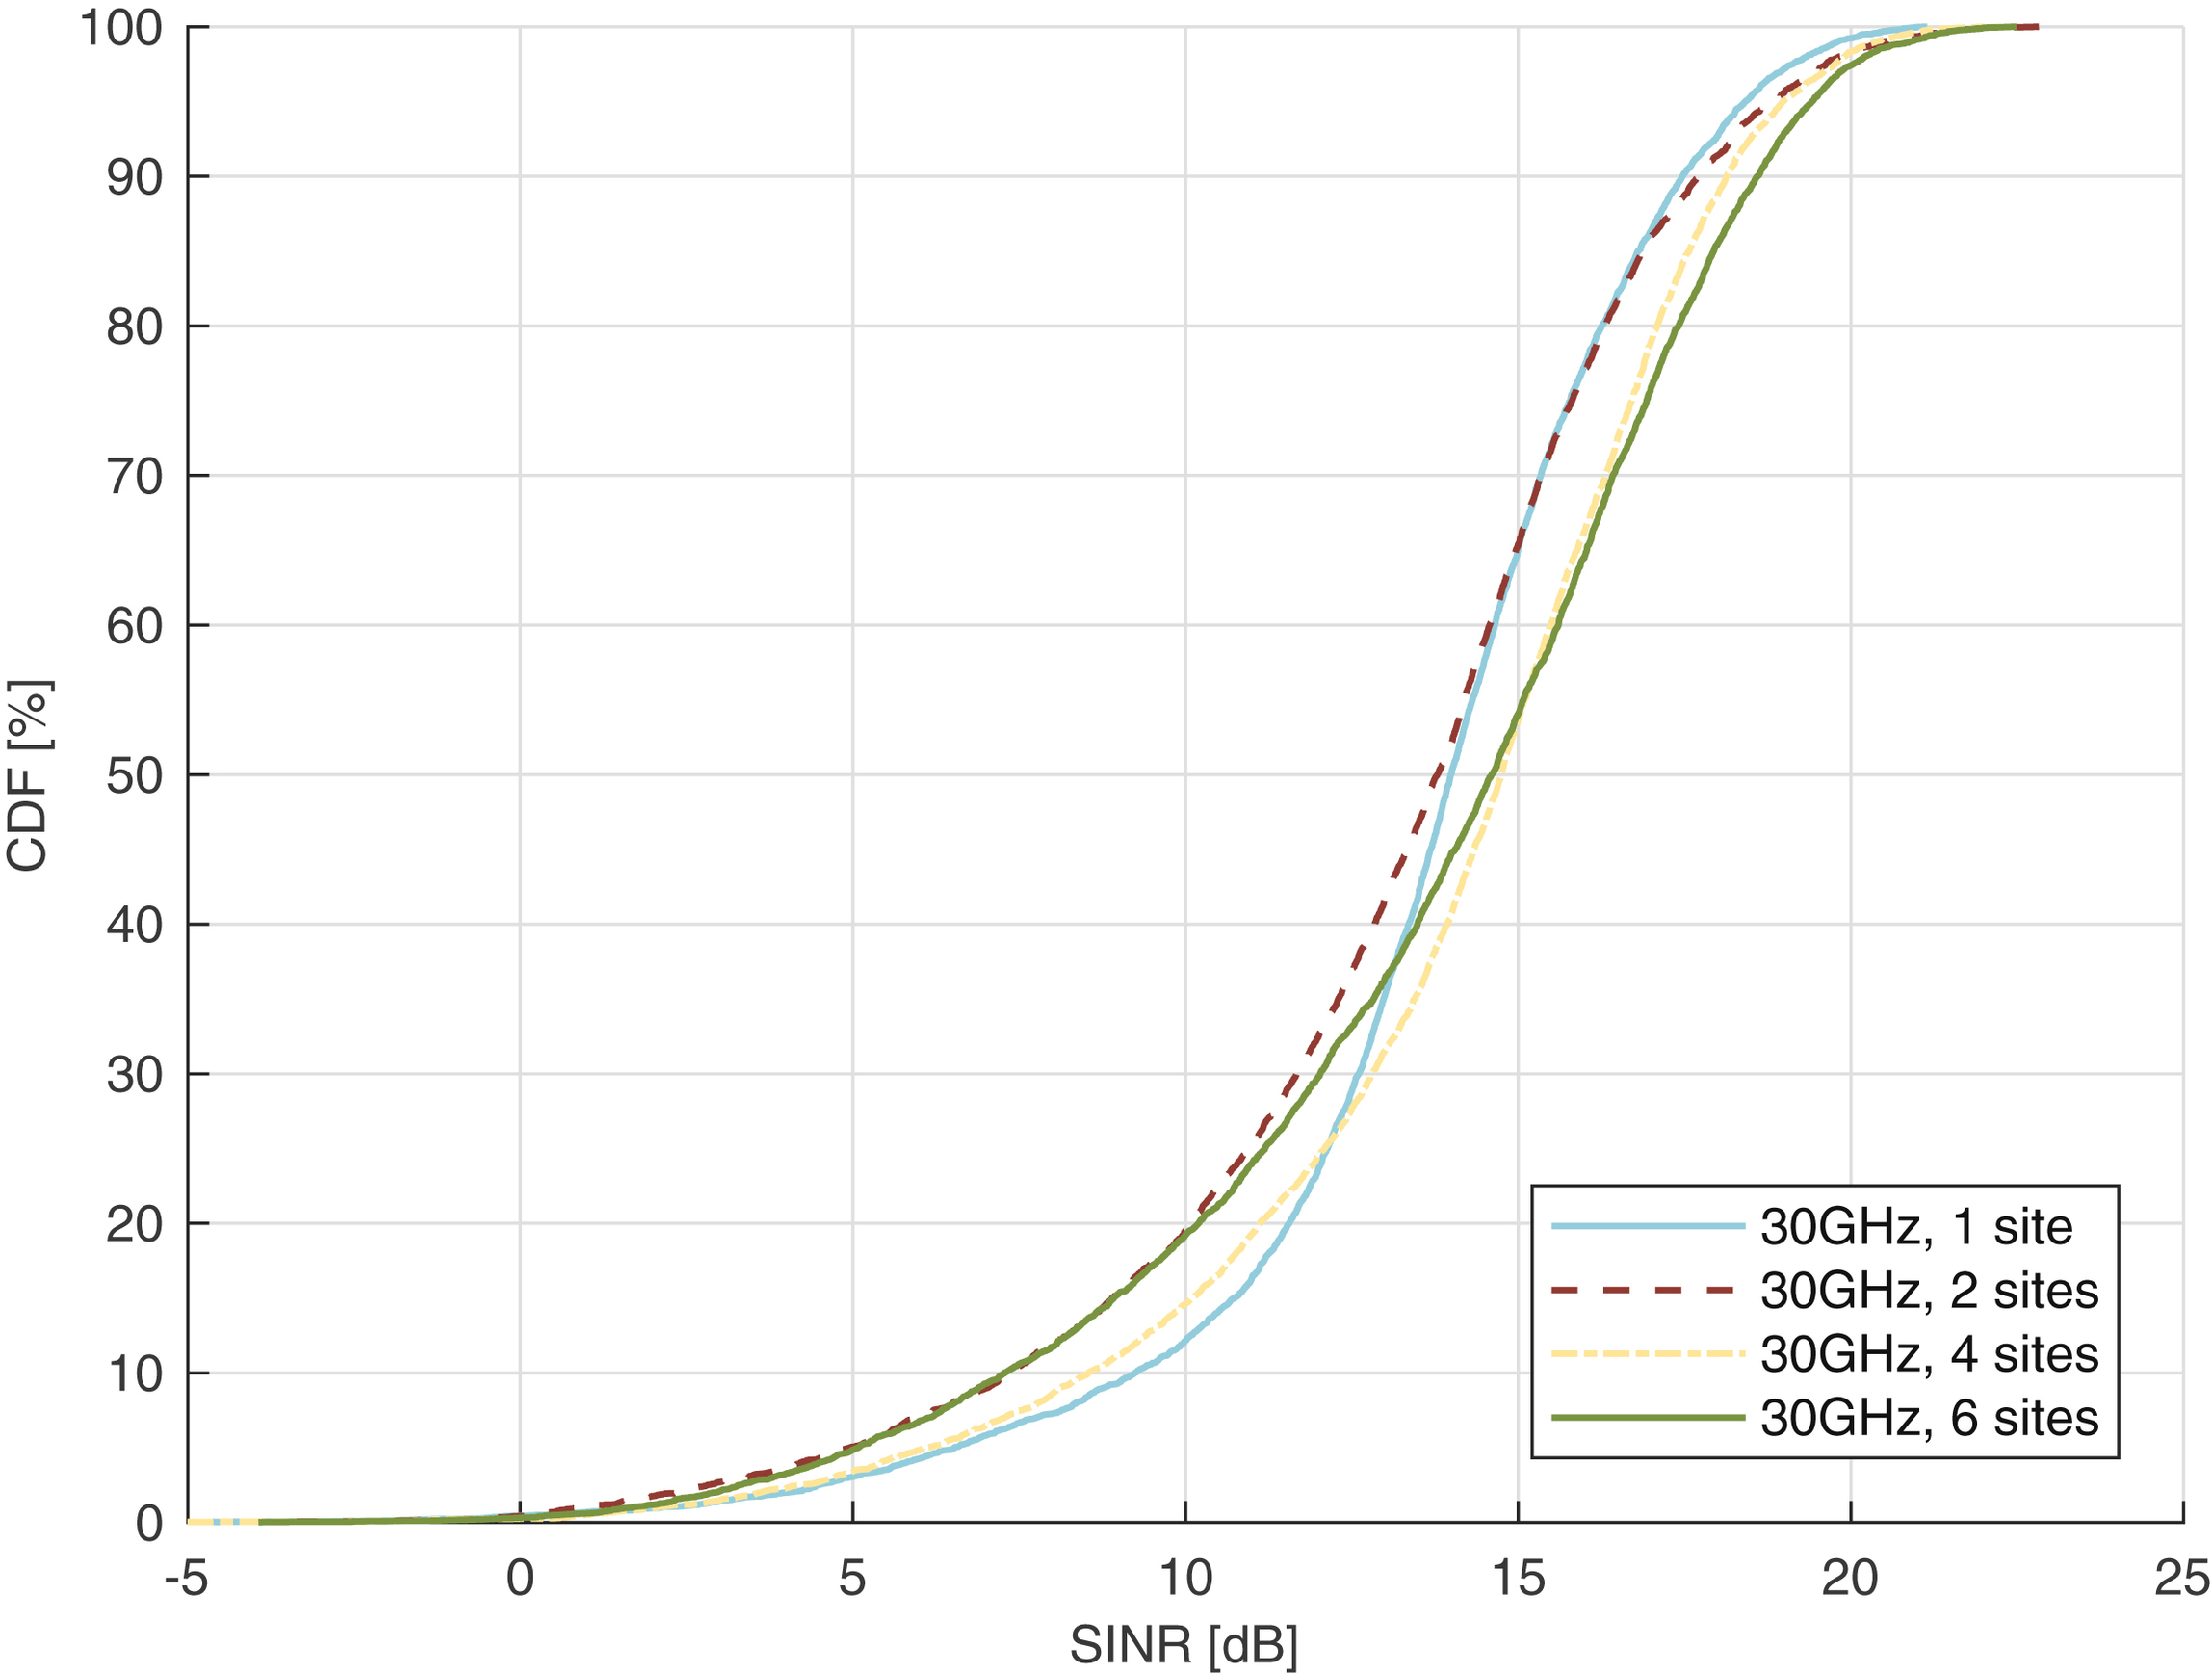
Based on the resulting total gain distribution including beamforming gain, shown in Fig. 12.18, we can derive the SINR distribution for the 30
GHz band, in an unloaded respective fully loaded case, shown in Fig. 12.19.

Table 12.20
Table 12.21
| Parameter | Value |
|---|---|
| Frequency [GHz] | 30 |
| Subcarrier spacing [kHz] | 120 |
| OFDM symbols per TTI | 7 |
| TTI length [μs] | 63 |
| Device processing delay [OS] | N1 = 20, N2 = 36 |
| Message Payload [B] | 32 (downlink and uplink) |
| Latency requirement [ms] | 1 |
| Reliability requirement | 99.999% |
| Channel model | TDL-D [1] with line-of-sight conditions |
| Delay spread [ns] | 30 |
| Device speed [km/h] | 3 |
| Traffic | Periodic |
| Modulation schemes | QPSK, 16 QAM, 64QAM |
| Code rates | {30, 64, 120, 251, 340, 438, 449, 490, 567}/1024 |
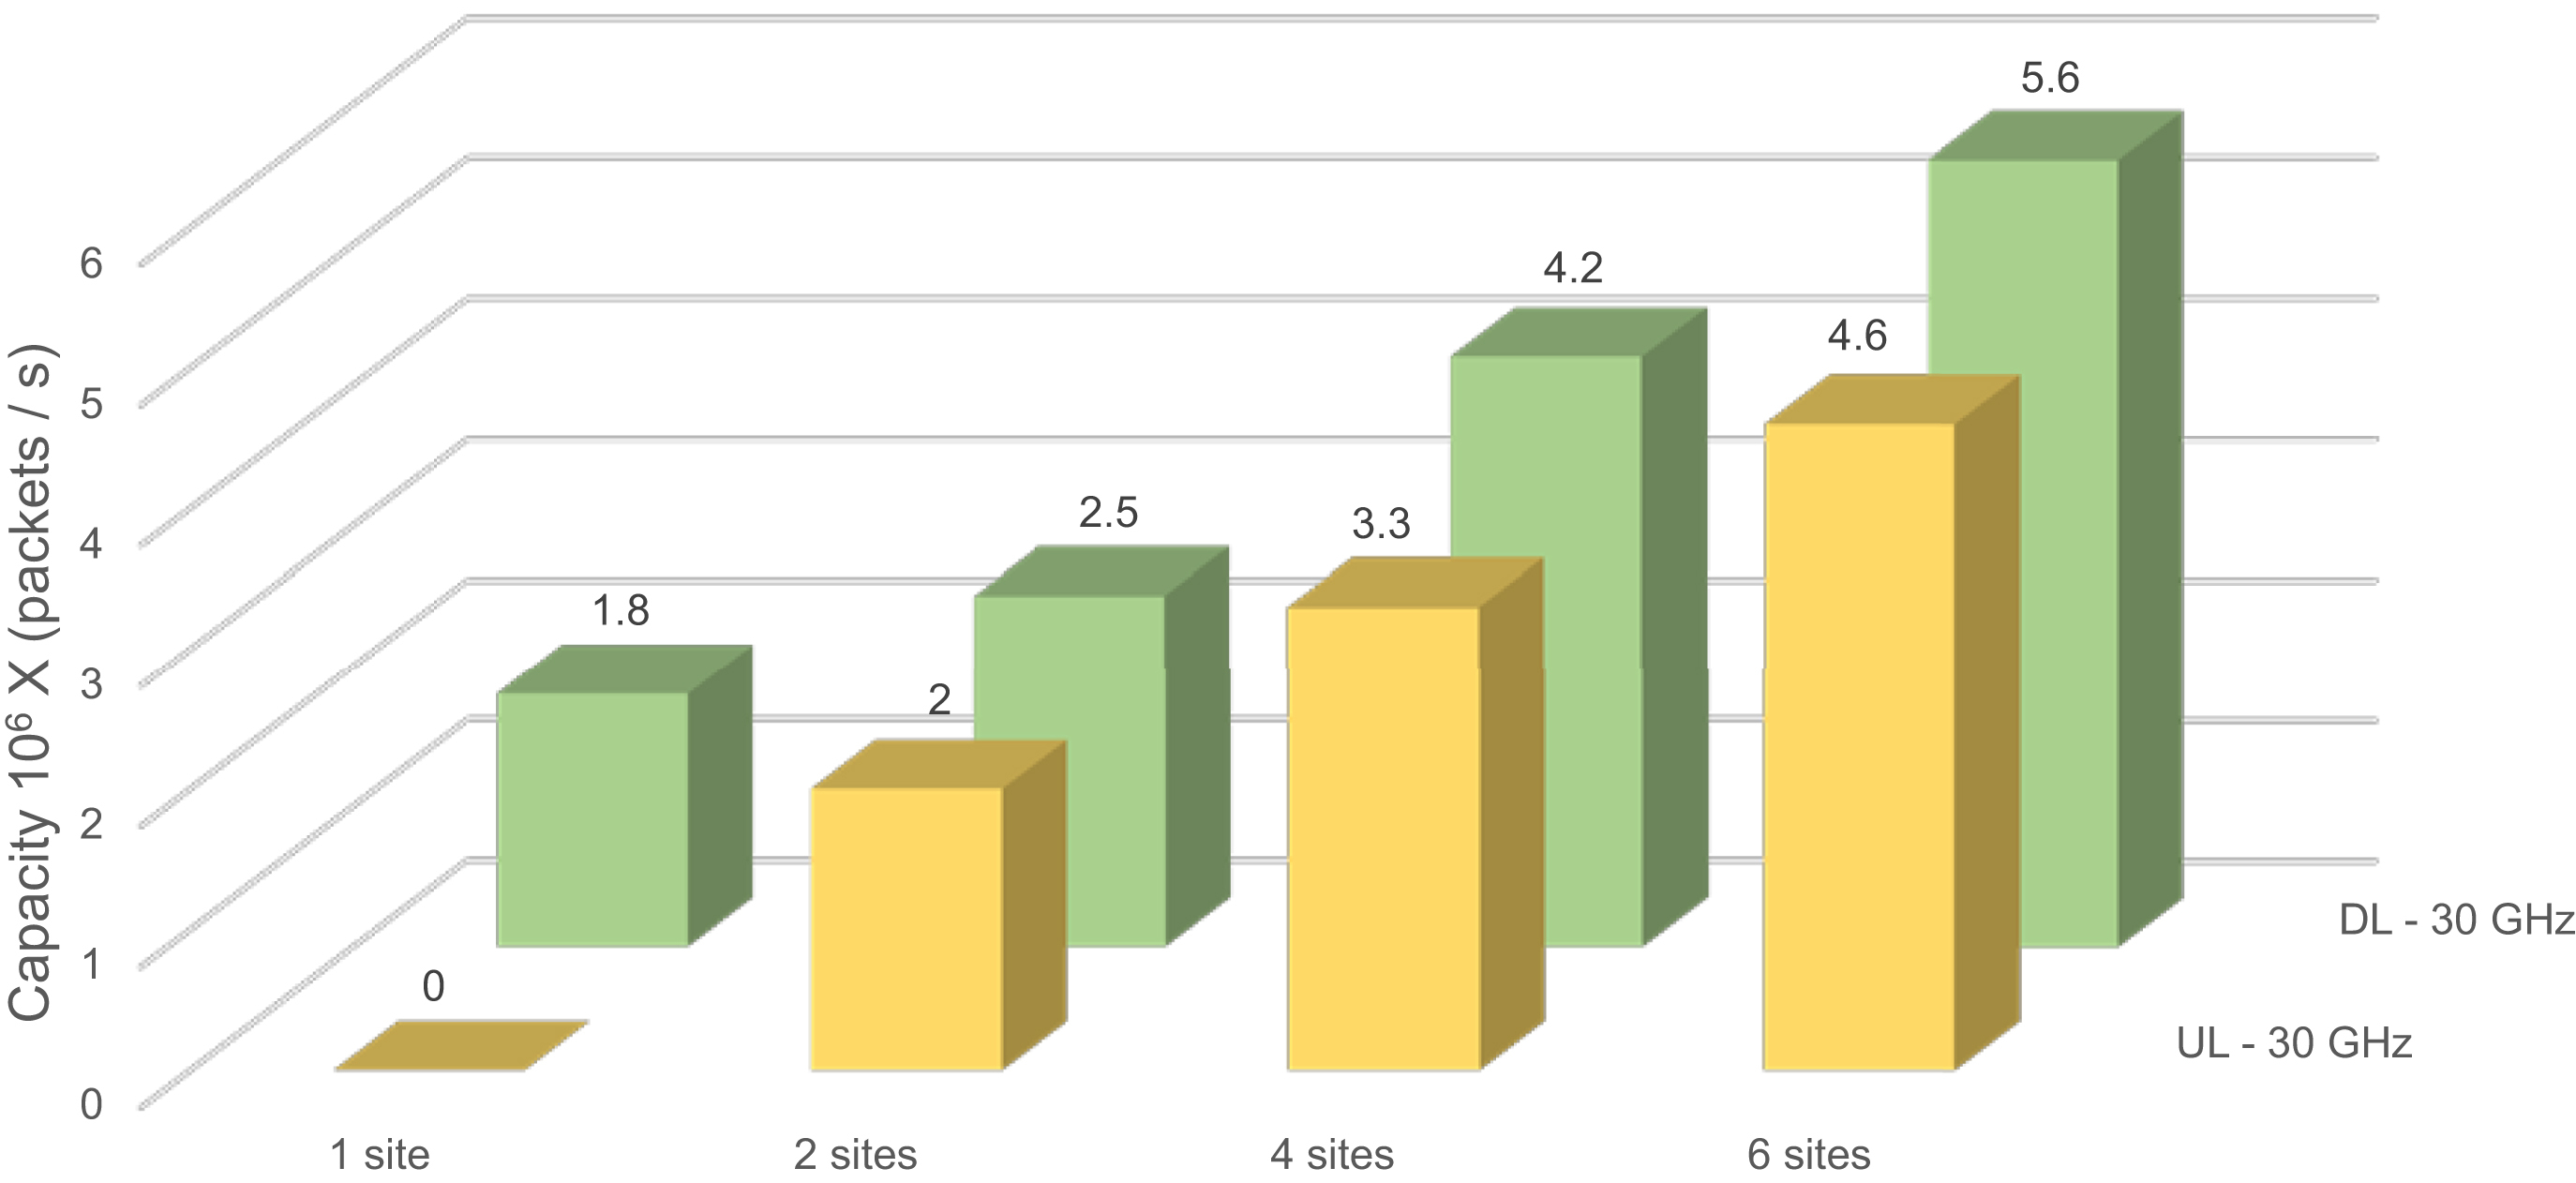
Starting from the SINR distributions we can then study the performance of the factory automation cMTC service running on the NR systems in the studied scenario. Calculating the total reliability as function of SINR using the methods outlined in the previous sections, and comparing with the service definition (payload, reliability, and latency requirements) we can find the service coverage, meaning the fraction of the factory positions where the cMTC service can be delivered. Requiring 100% service coverage for the cMTC service in the factory, we can then find the maximum traffic that the system supports in terms of a total number of data packets per second. This is shown in Fig. 12.20 for the two studied bands. Clearly, full coverage of the cMTC service can be delivered by NR URLLC in both directions in the factory, and a high rate of packets can be supported.


