7.2 Monitoring
The AEX offers a variety of tools for monitoring the central adapter engine, communication channels, and other integration server components. In contrast to its dual-stack (Java/ABAP) processors, the AEX delivers monitoring centralization by providing a dedicated toolset with focus on the Java stack.
You can monitor the AEX via the following tools:
- SAP NetWeaver Administrator
- System-wide monitoring covering all AEX components, regularly used to perform advanced monitoring
- SAP PI monitoring
- Local monitoring with a selection of AEX core components, generally used for traditional message and communication channel monitoring
- SAP PI central monitoring with SAP Solution Manager
- Central SAP PI landscape monitoring with drilldown functionality to specific SAP PI local components
We’ll go over the most frequently used of these tools in the following sections.
7.2.1 SAP NetWeaver Administrator
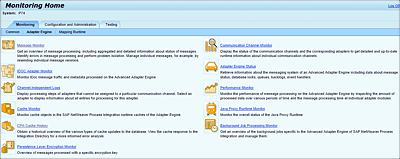
From SAP NetWeaver Administrator, you can access all local monitoring tools related to the AEX, including the SAP PI local monitoring (pimon). From the SAP NetWeaver Administrator, you can also access less common types of monitoring, such as performance and availability monitoring, process monitoring, database-related monitoring (e.g., Java Persistence API [JPA] and Open SQL), and Java archiving jobs monitoring.
SAP NetWeaver Administrator can be accessed at http://<host>:<port>/nwa, where <host> is the hostname of the SAP NetWeaver system, and <port> is the port number of the SAP NetWeaver system (see Figure 7.3).
Figure 7.3 SAP NetWeaver Administrator: Monitoring Home
7.2.2 SAP Process Integration Local Monitoring
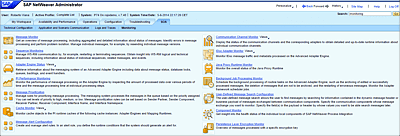
Each AEX installation has its own SAP PI local monitoring tool that you can use to monitor different system areas, including message traffic, communication channels, and data and runtime caches.
SAP PI local monitoring (pimon) can be accessed at http://<hostname>:<port>/pimon, where <hostname> is the hostname of the SAP NetWeaver system, and <port> is the port number of the SAP NetWeaver system (see Figure 7.4).
Figure 7.4 SAP PI Local Monitoring: pimon
Via SAP PI local monitoring, you can access the following AEX monitoring tools:
-
Message Monitor
The main message monitoring tool for all messages processed via the AEX shows aggregated and fine-grained information about the status of messages sent and received. Manage individual messages, for example, by resending individual message versions. See Figure 7.5, Figure 7.6, and Figure 7.7 for an impression of this monitoring tool. -
IDoc Adapter Monitor
The extensive IDoc monitoring tool provides an overview of all message traffic and metadata processed via the AEX central adapter engine. -
Channel-Independent Logs
Displays execution steps (in a very simple way) of adapters that can’t be assigned to a particular communication channel. -
Cache Monitor
Provides an overview of current cache objects maintained by the adapter engine and mapping runtime. -
CPA Cache History
This traditional CPA cache monitor displays an overview of cache refresh actions and their statuses. -
Adapter Engine Status
Provides detailed information about the adapter engine, including queues, message traffic (e.g., amount of asynchronous or synchronous message backlog), database locks, overview of messages processed or being processed per sender, and receiver components. -
Performance Monitor
Monitors the performance of message processing by inspecting the amount of processed data over various periods of time and the message processing time for individual adapter modules. Additional configuration is needed in the Config Tool for this functionality to work properly. -
Background Job Processing Monitor
Displays an overview of background jobs (e.g., adapter engine, adapter framework scheduler jobs, etc.) and offers the ability to manage them.
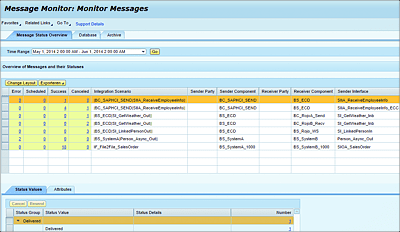
Figure 7.5 shows the tabular view of the message overview, including status and other relevant data. Depending on your needs, you can select a predefined hourly, daily, weekly, monthly, or yearly time range.
Figure 7.5 pimon Message Monitor: Overview
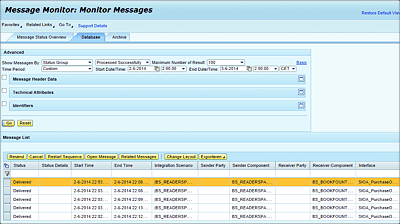
You can make a selection by clicking on one of the columns containing the message statuses on the left of the screen. The specific set of messages for that particular integration scenario will be opened on the Database tab (see Figure 7.6).
Figure 7.6 pimon Message Monitor: Message List
Take note that your log, trace, and message retention settings should be properly configured to display messages with certain statuses on the Database tab.
Note
The topic of message retention is briefly introduced in Section 7.2.4. For a complete overview of monitoring and housekeeping jobs, see Chapter 19 which explains those topics in more depth.
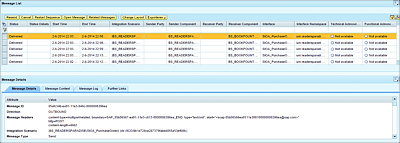
After the messages are displayed, you can either apply additional filters or select a particular message from the list presented on the Database tab. You can then proceed to analyze different attributes (processing context data, header information, payload, logs, etc.) of the message, or, if permitted by the message status, you can cancel or retry all messages with that particular status (see Figure 7.7).
The third and last tab (Archive) shows all messages (or their metadata) that have been previously archived.
Figure 7.7 pimon Message Monitor: Message Details
7.2.3 SAP PI Central Monitoring with SAP Solution Manager
We have a good foundation and understanding thus far of what the AEX has to offer in terms of administrative and monitoring tools. With that set of tools, you should be able to manage an AEX installation. However, when the size of your integration landscape, the amount of integration scenarios, and their complexity (e.g., interlinked business process management [BPM] processes, business-to-business [B2B] integration, etc.) starts to grow significantly, you might want to add more control, react more quickly to incidents, and gain more insights about important events flowing in and out of your AEX landscape. When you reach that stage, you need to be prepared to bring your support organization to the next level and start seriously considering introducing a new component next to your SAP PO installation.
SAP Solution Manager is a multipurpose central support and system management platform that is fully equipped to be the central backbone that manages all SAP PO and SAP backend components within your SAP system landscape. Its complete list of features goes beyond the administration and monitoring of SAP PO, which also makes this component attractive to organizations wanting to reduce the total cost of ownership (TCO) and to efficiently harmonize the tasks performed by SAP Basis specialists.
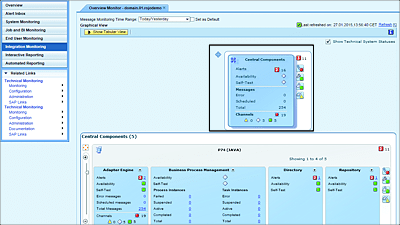
From SAP Solution Manager 7.1 on, you can enable central SAP PI monitoring. This functionality provides unified alert notifications and incident management, as well as a pivotal overview of exceptions, alerts, and statuses of SAP PI components (see Figure 7.8).
Figure 7.8 SAP PI Central Monitoring in SAP Solution Manager
In addition, SAP Solution Manager also provides options to drill down into the details of recorded exceptions in the respective SAP PI components and integrated business systems. Furthermore, component-based alerting is supported, and message alerts can be sent via email and SMS to administrators.
SAP Solution Manager has the following core capabilities for administering and monitoring AEX installations:
- Overview monitor, including integration server, central/decentral adapter engines, and business systems (including ABAP proxies)
- Central message monitoring
- Root-cause analysis
- Unified Alerting Infrastructure and Inbox
- Notification via email and SMS
- Incident management and ticketing
- Central SAP PI message search (user-defined search)
These capabilities become essential when executing the following administrative tasks:
- End-to-end error detection to perform root-cause analysis
- Spot and troubleshoot performance bottlenecks
- Support system upgrades and changes
- Regular system health checks
- Handover procedures
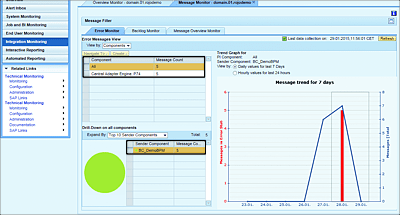
- Trends analysis (see Figure 7.9)
The list of applicable areas of relevance for SAP Solution Manager is definitely much more extensive than the areas we’ve just discussed; in fact, we could write two entire books dedicated to this interesting component alone. However, within the context of AEX administration, the points addressed previously provide a good example of what you can achieve with this tool.
Whether you want to inspect the status of independent components in your SAP PO installation, check the availability of certain communication channels, or search for specific messages passing through the AEX, monitoring is the common denominator.
In the AEX, there are alternatives to help you achieve the monitoring goals mentioned previously and much more than that, as you’ll discover.
Figure 7.9 SAP PI Monitoring: Aggregated Error Monitoring in SAP Solution Manager
7.2.4 Message Retention
The message retention function defines the period for which messages processed via the AEX are to be kept in the database before they are archived or deleted. The message retention only applies to messages that have a successful or canceled status.
The AEX has a global retention period of one day that is set for all message types. If required, the global retention period can be changed accordingly. This can be achieved by changing the following parameters in the SAP NetWeaver Administrator (choose Configuration • Infrastructure • Java System Properties • Services • XPI Adapter: XI): xiadapter.inbound.persistDuration.default and xiadapter.outbound. persistDuration.default.
If your organization requires messages of a specific interface to be kept for a longer period than one day, then a specific message retention period can be configured for the affected interface.
7.2.5 User-Defined Message Search
The message monitor that comes with SAP PO is a powerful and indispensable tool for any developer, whether for simple interface monitoring, operational support, or testing, messages flowing through the adapter engine are periodically searched and analyzed. However, the default search options in the message monitor have some limitations; you can only search for messages based on some predefined search criteria such as interface name, date-time, or message status as search criteria. The message monitor also provides a special search feature called user-defined message search that can be found on the database view as part of the advanced options. You can enable this feature by defining a new filter via SAP NetWeaver Administrator or via the SAP PI monitoring tool, as shown in Figure 7.10.
Figure 7.10 User-Defined Message Search
User-defined message search allows you to find messages by searching for specific key information (e.g., customer ID, vendor ID, material number, etc.) contained at the message header or payload of messages exchanged between communication components. You can define as many predefined search filters as needed, and filters can be used for both asynchronous and synchronous interfaces. This functionality is available for the ABAP and Java stack of SAP PI; however, in this book, we only cover the Java part.
Note
The IDoc adapter monitor is a specialized message monitor tool for monitoring inbound and outbound IDoc messages sent through the IDoc adapter. With the IDoc adapter monitor, it’s possible to specify more parameters as search criteria at the header level data (e.g., IDoc number, IDoc type, direction, etc.), but it doesn’t offer ways to search through the contents of the payload.
To configure user-message search functionality for one or more of your interfaces in SAP PO, follow these steps:
-
Navigate to the home page.
Navigate to the Monitoring Home (pimon), and then go to http://<hostname>:<port>/pimon, where <hostname> is the hostname of the SAP NetWeaver system and <port> is the port number of the SAP NetWeaver system. -
Create a new filter.
Choose Configuration and Administration • Adapter Engine • User-Defined Message Search Configuration. Enter the parameters for the filter. Click New, and enter the Name, Description (optional), Interface, Sender Component, Receiver Component, and so on. In this configuration screen, you can also decide to immediately activate or deactivate the filter. Save your work when finished, as shown in Figure 7.11.Figure 7.11 User-Defined Message Search Filter
-
Add search criteria to the new filter.
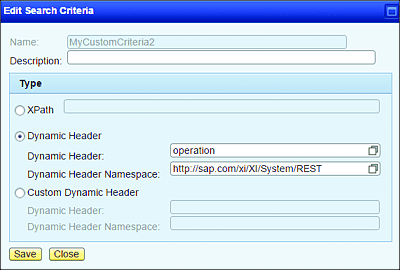
Select the new filter for which you’re creating a search criteria, and click New on the Search Criteria tab. You can add one or more search criteria to your filter. You can choose one of the following types of search: self-defined XPath expression, Dynamic Header, or Custom Dynamic Header. Click Save when done, as shown in Figure 7.12. -
Configure the namespace prefixes.
If you’ve created filters of type XPath, then you must also define the corresponding namespace prefix for it to work correctly (see Figure 7.13). We recommend you always configure a namespace prefix for all filters you create, even if you haven’t created an XPath filter.Figure 7.12 User-Defined Message Search Criteria
Figure 7.13 User-Defined Message Search Namespace Prefix
-
Perform indexing (optional).
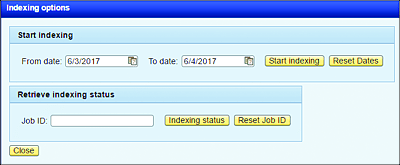
Perform an initial indexation (i.e., also include already processed messages in your search results) if necessary (see Figure 7.14). This step is optional as the system will automatically run indexation when a new filter is created. SAP PO doesn’t index messages that are marked sensitive in the Enterprise Services Repository (ES Repository) as these messages contain confidential information.
Figure 7.14 User-Defined Message Search Indexing
Finally, after you’ve performed all the preceding steps, you can return to the Message Monitor screen and start using the new search filter, as follows:
- Go to http://<hostname>:<port>/pimon, where <hostname> is the hostname of the SAP NetWeaver system, and <port> is the port number of the SAP NetWeaver system.
-
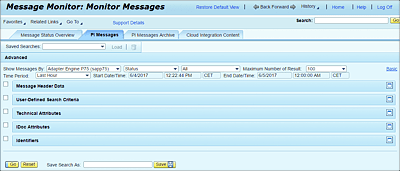
Select the PI Messages tab, and click the Advanced link at the right of the screen. You should now see the view shown in Figure 7.15.
Figure 7.15 User-Defined Message Search Advanced Options View
-
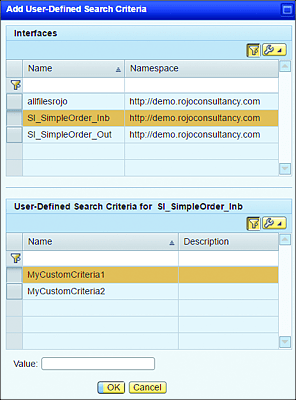
Select User-Defined Search Criteria, and choose Add Predefined to select the filter from a populated list of available predefined filters, as shown in Figure 7.16. You can also add a custom filter on the fly if necessary.
Figure 7.16 User-Defined Message Search Select Predefined Filter
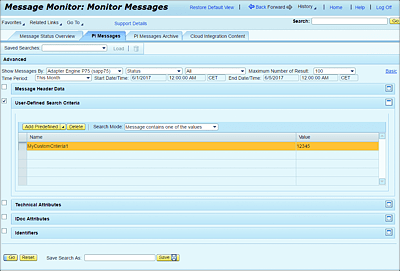
- Now that you’ve selected a filter, you can enter the search value you’re looking for in messages. In this example, we’ve entered a specific ID (12345) as the value to search for (see Figure 7.17).
- Click the Go button, and check the results of your search filter.
Figure 7.17 User-Defined Message Search Value
