11.8 Debugging and Troubleshooting SAP BPM Processes
In learning to use SAP BPM, mistakes and errors are bound to show up in our processes. This section will focus on how to debug or troubleshoot such errors. When debugging, you can stop at every step of a running process and analyze its data to investigate an error that occurred.
SAP BPM developers are able to debug their SAP BPM processes from SAP NetWeaver Developer Studio. When using SAP NetWeaver Developer Studio to debug, the following considerations apply:
- The Debug perspective needs to be used due to its specialized views that facilitate troubleshooting.
- Breakpoints need to be placed on the SAP BPM process.
- Breakpoints can be added to events, activities, and gateways.
- It might be necessary to analyze the process context data (the values stored in different data objects).
- Specialized debugging functionscan be used, including stepping over, stepping into, and stepping out of the flow objects and resuming the execution.
Note
Debugging isn’t possible under the following circumstances:
- When using a cluster SAP PO installation
- If the SAP BPM process contains activities with a loop or an embedded subprocess
Furthermore, before using the debug functionality, the following prerequisites apply:
- SAP NetWeaver AS Java must only have one server node.
- The process to be debugged must have already been deployed to the SAP PO server.
- The user used to debug needs to have the SAP_BPM_Debug role assigned.
11.8.1 Place Breakpoints in the Process
To properly debug a process, it’s useful to place breakpoints at the relevant flow objects. To place a breakpoint, follow these steps:
- In SAP NetWeaver Developer Studio, expand the SAP BPM DC, and open the applicable process.
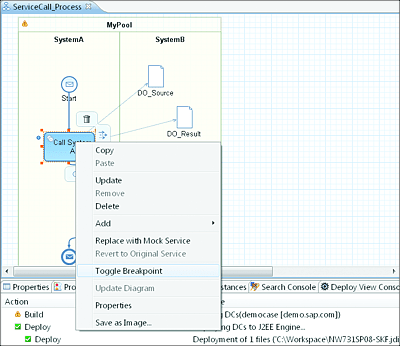
- Right-click on the flow object that you want to attach the breakpoint to, and select Toggle Breakpoint. Note that a blue dot will be placed next to the object to indicate that the breakpoint has been set. You can remove the breakpoint by selecting the Toggle Breakpoint option one more time (Figure 11.31).
- Build and deploy the process to the SAP PO server.
Figure 11.31 Placing a Breakpoint on an Activity before Debugging the Process
11.8.2 Add a Debug Configuration
To debug a process, some debug configuration settings are needed in SAP NetWeaver Developer Studio. To configure SAP NetWeaver Developer Studio for debugging, follow these steps:
- In SAP NetWeaver Developer Studio, make sure that you’re in the Process Development perspective.
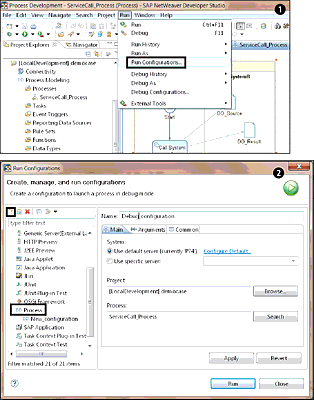
- From the top menu, select Run • Debug Configurations (Figure 11.32 1).
- In the new pop-up, select the Process node of the left panel, and click on the New button 2.
- Fill in details such as the configuration name, select the project or DC containing the process, and select the applicable process.
- If the process requires a specific XML/payload input, then you can provide it in the Arguments tab.
-
Click on the Run button to start debugging.
Figure 11.32 Creating a Debug Configuration in SAP NetWeaver Developer Studio
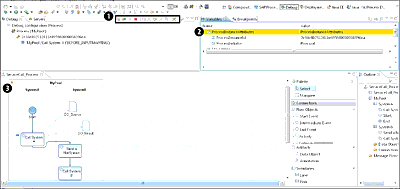
- You might need to provide your login credentials. SAP NetWeaver Developer Studio will automatically switch to the Debug perspective. Your screen should be similar to the one shown in Figure 11.33.
Figure 11.33 SAP NetWeaver Developer Studio Debug Perspective
Note the following details about the options shown in Figure 11.33:
- Use this menu bar 1 for debugging options such as resume, terminate, step over, and step into. For instance, you can move to the next step of the process by selecting the Step Over option.
- Use this area 2 to watch the context data values as they change at each SAP BPM process step.
- As you use the options at 1, the arrow at 3 will keep moving to show at which step the process currently stands.


