15 Administration and Monitoring Message Processing in SAP BPM
Trust, but verify.
—Ronald Reagan
After you’ve successfully developed, deployed, and configured processes in SAP Business Process Management (SAP BPM), the business will be ready to use and trigger them. After the processes are running, you’ll need to use SAP BPM’s monitoring capacity to continuously maintain and administer SAP BPM to fix erroneous situations that arise and to prevent such situations in the future.
Part of SAP Process Orchestration (SAP PO) maintenance also includes regularly running some housekeeping jobs. Monitoring and administering your SAP BPM processes will form the main focus of this chapter. In this chapter, we’ll look at what’s required to properly manage, track, and detect issues in running processes and tasks in your SAP PO server. Monitoring these processes is part of the ongoing job of maintaining and improving your organization’s IT environment.
15.1 Monitoring
SAP PO provides a number of monitoring tools via SAP NetWeaver Administrator. Each of those tools, which will be explored in the next sections, can be used for different purposes. Be aware that to access these tools, you need to have the right user authorizations and roles. Most of these tools require the common roles listed in Table 15.1. If a particular tool requires different or additional roles and authorizations, it will be mentioned in the relevant sections further in the chapter.
Table 15.1 Necessary Roles to Access SAP BPM Monitoring Tools
15.1.1 SAP Business Process Management System Overview
The SAP BPM system overview tool forms part of the availability and performance monitoring (see Figure 15.1). The tool gives a high-level overview of the following information:
- Process server availability
- Number of process instances running on each server node
- Configuration of the instance memory threshold
- Whether the process engine is properly running
- Number of process instances in each different status (Error, Failed, Suspended, Completed, Canceled, and In Progress)
- Number of tasks in each different status (Error, Suspended, Completed, Canceled, Ready, and In Progress)
The roles listed in Table 15.1 apply for this tool. To access the SAP BPM system overview tool, follow these steps:
- Log in to SAP NetWeaver Administrator via http://<hostname>:<port>/nwa.
- Navigate to the Availability and Performance Management tab. Then, select BPM System Overview to access the tool.
You’ll arrive at the page shown in Figure 15.1.
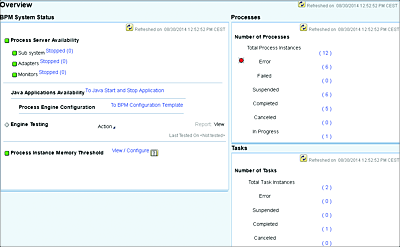
Figure 15.1 SAP BPM System Overview Monitoring Tool
15.1.2 Process Repository
The Process Repository is an application within SAP NetWeaver Administrator that enables administrators to view all of the deployed SAP BPM development components (DCs), versions of the components, and related process and task definitions in order to start process instances and download resources.
The roles listed earlier in Table 15.1 apply for this tool. To access the Process Repository, follow these steps:
- Log in to SAP NetWeaver Administrator.
- Navigate to the Configuration tab.
- Select the Processes and Tasks subtab.
- Click on the Process Repository link to go to the screen shown in Figure 15.2.
For more details about how to use each functionality available in the Process Repository, refer to Chapter 11, Section 11.2.1.
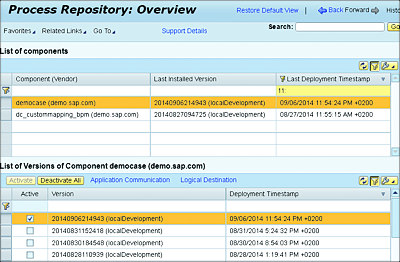
Figure 15.2 Process Repository Overview with List of Components
15.1.3 Process Management
Process Management is the main tool to be used for managing and monitoring all SAP BPM process instances running on the SAP PO server. This is a one-stop shop that enables administrators to perform the following tasks:
- Access details of a process instance.
- View the process instance’s flow.
- View the process definition flow.
- View the history of process instance activities.
- View details of the process instance’s context.
- Navigate to tasks that are related to the current process.
- Perform administrative actions on a process.
The roles listed earlier in Table 15.1 apply for this tool. To access the Process Management tool, follow these steps:
- Log in to SAP NetWeaver Administrator.
- Navigate to the Operations tab.
- Select the Processes and Tasks option.
- Choose the Manage Processes link. A new page will load with a list of processes with an error status (see Figure 15.3).
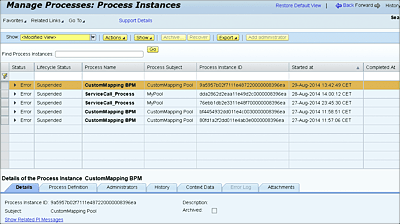
Figure 15.3 The Main Page for Managing Processes
Let’s look at some of the process management tool’s features in more detail.
Access Process Instance Details
From the main Manage Processes page (refer to Figure 15.3), you can filter processes based on their status and many other different filtering criteria. On the top-left side of the page, from the Show dropdown (see Figure 15.4 1), you can choose between the following options:
-
All Running Processes
Includes the list of processes currently running that have an In Progress status. These processes aren’t yet completed. -
Error and Failed Processes
This list of processes encountered problems that require corrective actions to be taken by the administrator. This category of processes needs to be given special attention and continuous monitoring.
Furthermore, the tool provides the ability to filter processes based on other attributes for more advanced process filtering functionality. To access this filtering, click on the Advanced link at the top right of the page 1. You’ll see another page, which provides many filtering options 2. For example, from this page, you can select all process instances that were started within a particular time frame.
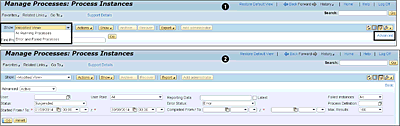
Figure 15.4 Advanced Filtering: Filtering Processes Based on Attributes
You can see more details of any given process by performing the following steps:
- Select the desired process instance from the list.
-
Select the Details tab at the bottom of the screen to view all relevant details. Figure 15.5 shows the following process attributes:
-
Process Instance ID
A GUID that uniquely identifies a process instance.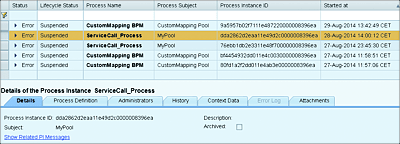
Figure 15.5 Details of a Process Instance
-
Subject
Describes what the process is about. The subject can be specified during design time while developing the process. -
Description
Describes what the process does or is used for. -
Archived
A Boolean value representing whether or not the process instance has been archived.
-
Process Instance ID
View the Process Definition Flow
You can view details about the process definition by going to the Process Definition tab. From here, you can view information such as title, definition ID, version ID, and the description of your process (Figure 15.6 1).
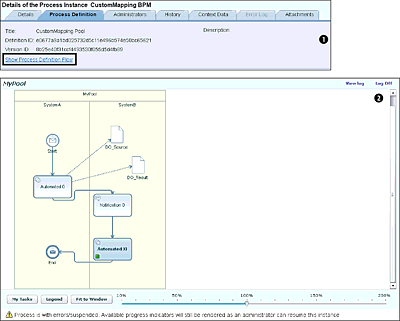
Figure 15.6 Getting the Definition of a Process and Displaying Its Definition Flow
You can also see the Business Process Model and Notation (BPMN) representation of the process by clicking on the Show Process Definition Flow link 2.
View the History of the Process Instance Activities
The History tab lists the details of all the activities of the SAP BPM instance. This tab can be thought of as an activity log. From the Show dropdown, you can view a Basic, Medium, or Advanced level of logs. From the history logs, you can see whether a particular event failed and view the description of the error that occurred (see Figure 15.7).
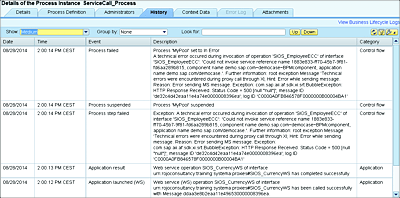
Figure 15.7 History of Process Instance Activities
View Details of the Process Instance’s Context Data
In the Context Data tab, an administrator can inspect and analyze the values of the data objects of a particular process instance. Being able to inspect the data object values provides useful insight and information while troubleshooting your process.
You can see which values started the process and how the data changed in the different steps. Figure 15.8 shows an example.
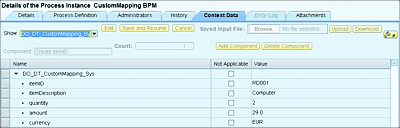
Figure 15.8 Inspection of the Context Data of a Process Instance
Perform Administrative Actions on a Process
After selecting a particular process instance, you can perform some administrative tasks on it. These actions include suspending, resuming, and canceling process instances, which you select from the Actions button (see Figure 15.9).
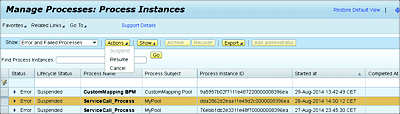
Figure 15.9 Actions to be Performed on a Process Instance
15.1.4 Task Management
Task Management is the main application to be used for managing and monitoring all SAP BPM tasks running on the SAP PO server. From this application, an administrator can perform the following actions:
- View tasks.
- View deadlines.
- View the history of a task.
- View task owners.
- Nominate users or delegate tasks to other users.
The roles listed earlier in Table 15.1 apply for this tool. To access Task Management, follow these steps:
- Log in to SAP NetWeaver Administrator.
- Navigate to the Operations tab.
- Select the Processes and Tasks option.
- Click on the Manage Tasks link.
From this screen, you can use an advanced feature to filter the different tasks based on various attributes (see Figure 15.10). These attributes include the following:
- Statuses (Assigned, In Error, Escalated, or Suspended)
- Archived or active tasks
- Created dates of tasks
- Task’s owner
- Lifecycle status (Inactive, Ready, In Progress, Completed, or Canceled)
- Different types of priorities
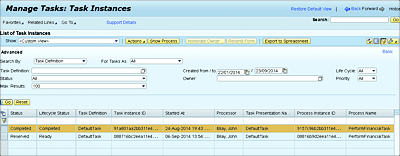
Figure 15.10 Managing All SAP BPM Tasks from Task Management
To access the Advanced Task Management screen, click on the Advanced link on the top-right side of the screen.
15.1.5 SAP BPM Inbox
SAP BPM Inbox is an HTML5 (SAPUI5)-based application that can be thought of as SAP BPM’s mailbox. It was introduced in SAP NetWeaver 7.31 SP 04. All tasks that are assigned to a user will be accumulated in that user’s SAP BPM Inbox, and it can therefore be considered a central access point for SAP BPM-related tasks. It’s a good alternative to the universal worklist (UWL), which was the main task repository option in older SAP BPM versions. SAP BPM Inbox has a big advantage compared to the UWL because it’s designed to support multiple devices, including smartphones and tablets. SAP BPM Inbox is a modern application that performs much faster than the UWL.
From SAP BPM Inbox, you can perform the following activities on tasks:
-
Filter
Filter tasks based on different statuses (Open, Completed, Overdue, or Escalated). You can also filter tasks that have been assigned to you. -
Open
View the details of tasks to perform different actions on them, such as to complete or cancel tasks. -
Claim
If you’re one of the potential owners of a task, then you can assign a task to yourself to become the actual owner. -
Release
When a task has been reserved for you, you can use this option to release it. -
Forward
Forward or delegate a task to a colleague or another user.
By default, SAP BPM Inbox isn’t configured, so you need to perform the following activities to customize it to your environment and needs:
- Log in to SAP NetWeaver Administrator.
- Navigate to the Configuration tab.
- Select the Infrastructure subtab.
- From there, click on the Java System Properties link.
- Select the Applications tab. A table lists all applications deployed on the SAP PO server.
- Filter for the application called tc~bpem~base~ear in the Name column.
- Select this application to see its properties displayed at the bottom of the screen.
- Filter for the http.baseurl property under the Name column.
-
Click on the Modify button, and change the default value (http://hostname: 50000) by replacing the hostname and port number to suit your environment (see Figure 15.11).
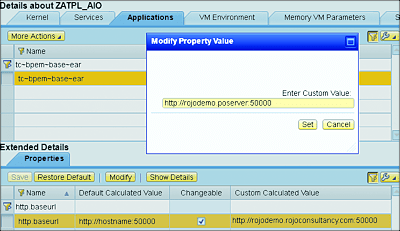
Figure 15.11 Configuring the SAP BPM Inbox in SAP PO
- Don’t forget to use the Set and Save buttons to store your new settings.
- After completing the preceding steps, you’re ready to access the SAP BPM Inbox via http://<hostname>:<port>/bpminbox. Replace <hostname> and <port> accordingly. You’ll see a screen similar to the one shown in Figure 15.12.
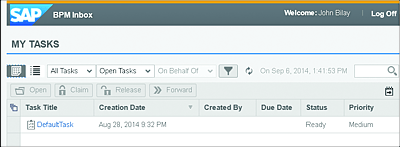
Figure 15.12 SAP BPM Inbox Application
To access the SAP BPM Inbox, the following roles must be added to the UME user’s profile:
-
UnifiedInboxUserRole
Allows the user to view the list of tasks and their details in the SAP BPM Inbox. -
com.sap.bpem.Enduser
Enables users to manage and work on the task.
Note that these two roles are the only ones required for the SAP BPM Inbox. All other roles listed in Table 15.1 aren’t required.
Some organizations opt to use an alternative tool called the Unified Inbox. The Unified Inbox tool has a broader scope than just SAP BPM tasks. It can be used as a centralized task center for different SAP and non-SAP workflow and BPM engines. The Unified Inbox provides an API to connect to non-SAP system and a standard connector for SAP BPM and SAP Business Workflow.
The Unified Inbox topic is beyond the scope of this book, but it’s useful to be aware of it.
15.1.6 Business Logs
The Business Logs tool is used to analyze business events of SAP BPM processes. It triggers events every time there are changes in the lifecycle of business processes. From this application, you can view all event logs grouped under categories, events, containers, times, and dates (see Figure 15.13).
The roles listed earlier in Table 15.1 apply for this tool. To access the Business Logs tool, follow these steps:
- Log in to SAP NetWeaver Administrator via http://<hostname>:<port>/nwa.
- Navigate to the Troubleshooting tab.
- Choose the Processes and Tasks subtab.
-
Select the Business Logs option. You’ll see the page shown in Figure 15.13. You can view more details on each of the listed events by selecting its entry in the table.
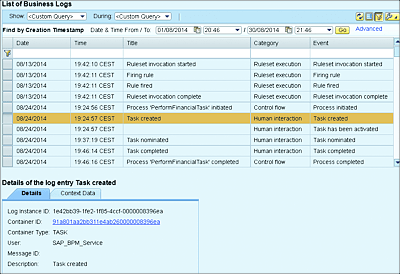
Figure 15.13 SAP BPM Process Business Lifecycle Logs
15.1.7 SAP BPM Action Monitor
SAP BPM Action Monitor enables the monitoring of queues throughout the cluster. All SAP BPM actions relating to events such as intermediary messages or human tasks uses queues and can be monitored from the SAP BPM Action Monitor. You can see which actions are queued, failed, or disabled (see Figure 15.14).
The roles listed earlier in Table 15.1 apply for this tool. To access SAP BPM Action Monitor, follow these steps:
- Log in to SAP NetWeaver Administrator via http://<hostname>:<port>/nwa.
- Navigate to the Troubleshooting tab.
- Select the Processes and Tasks subtab.
-
On the new page, click on the BPM Actions link.
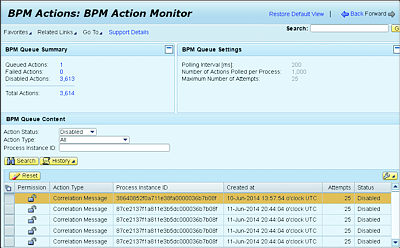
Figure 15.14 SAP BPM Action Monitor
On the new page (see Figure 15.14), the following information is displayed:
-
BPM Queue Summary
This section presents an overview with the total number of actions that are currently queued, failed, or disabled. You can click on any of these total numbers to have them filtered in the bottom section of the screen (BPM Queue Content). -
BPM Queue Settings
This section contains details of server settings about parameters such as polling interval, number of actions polled per process, and maximum number of attempts. Be aware that the settings of these attributes can dramatically impact the performance on your processes. Refer to Chapter 11, Section 11.9 to learn more about how to tune SAP BPM-related performance parameters. -
BPM Queue Content
From this section, you can filter the actions based on their statuses. Actions with a Disabled status can be reset back to a Queued status via the Reset button.
15.1.8 Process Troubleshooting
The Process Troubleshooting application is used to track and trace the components. Various aspects of the SAP PO server can be monitored, including the following:
- Availability of its components
- Status of the SAP BPM cluster nodes
- Start and stop of different applications on the server
The roles listed earlier in Table 15.1 apply for this tool. To access the Process Troubleshooting application, follow these steps:
- Log in to SAP NetWeaver Administrator via http://<hostname>:<port>/nwa.
- Navigate to the Troubleshooting tab, and then select the Processes and Tasks subtab.
- Click on the Process Troubleshooting link.
15.1.9 Rules Business Logs
Even though this tool is related to SAP Business Rules Management (SAP BRM), it’s relevant to mention it in the context of monitoring business processes. As you’re aware from Chapter 11 and Chapter 13, you can embed an SAP BRM rule in an SAP BPM DC or project. In such a case, you might need to deal with the Rules Business Logs while troubleshooting your SAP BPM process.
The Rules Business Logs application (see Figure 15.15) enables the administrator to view the business logs for the execution steps of a ruleset. As an SAP BRM rule runs in the SAP PO server, it creates logs containing details and information about activities or events performed by the rule. These logs are called business logs and are internally created with the help of the Galaxy Business Logging Framework.
The roles listed in Table 15.1 apply for this tool. To view Rules Business Logs, follow these steps:
- Log in to SAP NetWeaver Administrator via http://<hostname>:<port>/nwa.
- Navigate to the Troubleshooting tab, and then select the Processes and Tasks subtab.
-
Click on the Process Troubleshooting link.
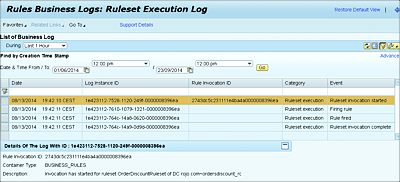
Figure 15.15 Rules Business Logs Application
You’ll see the page shown in Figure 15.15. From here, you can specify a time period and retrieve all the relevant business logs. After selecting a particular entry, you can see more details about the log entry at the bottom of the screen.
15.1.10 SAP BPM Analytics Dashboard
The SAP BPM Analytics Dashboard enables its users to analyze and run reports of SAP BPM processes and tasks. You can filter processes and tasks based on the following periods: today, yesterday, last 7 days, and last 30 days.
The dashboard graphically presents statistics of the processes and tasks based on different status categories. For processes, the relevant statuses include the following:
- In Progress
- Completed
- In Error
For the tasks, the relevant statuses include these:
- Open
- In Progress
- Completed
- Failed
The SAP BPM Analytics Dashboard can be accessed via the link http://<hostname>:<port>/bpmanalytics. An impression of how the main page looks like can be seen in Figure 15.16.
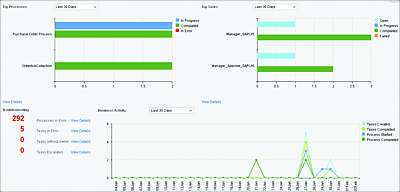
Figure 15.16 Monitoring Processes and Tasks with the SAP BPM Analytics Dashboard
To access this dashboard, the roles listed in Table 15.1 need to be added to the user’s profile, as well as the following roles:
- DISPLAY_ALL
- Everyone
Note that the dashboard will only be populated with data of the processes and tasks that the user is authorized to see. These processes and tasks include the ones for which the user is an administrator.
From the SAP BPM Analytics Dashboard, a link is provided to directly jump into the Process Management tool (Section 15.1.3) and Task Management tool (Section 15.1.4). Details of processes (under each status) can be viewed by clicking on the View Details link below the Top Processes chart. Likewise, task details (under each status) can be viewed by clicking on the View Details link below the Top Tasks chart.