17.3 Monitoring
This section describes the tool made available to monitor the integration gateway component and messages related to the deployment of cloud integration content. Both monitoring aspects are described next.
17.3.1 Monitoring the Integration Gateway Component
Use this monitoring feature to ensure that the integration gateway component—responsible for the functionality of the SAP Cloud Platform Integration runtime engine in SAP PO—functions properly. Furthermore, this monitoring component serves the following purposes:
- To get an overview of the status of the integration gateway component
- To call the configuration data of integration gateway component
- To use a self-test to check whether the runtime components are functioning correctly
- To check whether the integration gateway is active on system
- To check whether the secure keystore is available
- To check whether all integration gateway applications are running without errors
- To check whether all cloud integration content is running without errors
The integration gateway component monitor can be accessed as follows:
- Go to the page with the URL http://<hostname>:<port>/dir.
- From that page, select the Component Monitor link.
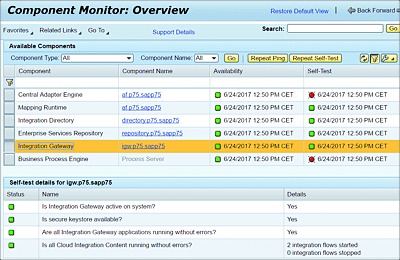
- You’re presented with a page containing all the components available on your server. Select the Integration Gateway row from the table as shown in Figure 17.7.
Figure 17.7 Monitoring the Availability of the Integration Gateway
Note
You can refresh the result and overall status of the health of the component using the Repeat Ping and Repeat Self-Test buttons at the top of the page shown in Figure 17.7.
17.3.2 Monitoring Messages Related to the Deployment of Cloud Integration Content
The message monitoring can be used to follow and track the statuses of messages flowing in your SAP PO server as a result of interfaces that relate to the deployed cloud integration content. Furthermore, you can find errors that have occurred and determine their cause of errors.
To access the message monitoring, follow these steps:
- Go to the page with the URL http://<hostname>:<port>/pimon.
- Navigate to the links Adapter Engine and Message Monitoring, respectively.
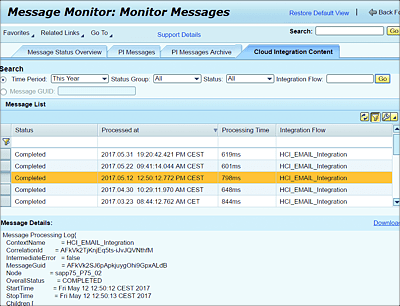
- From this page, select the Cloud Integration Content tab as shown in Figure 17.8. From this tab, it’s possible to filter messages based on various metadata criteria.
Figure 17.8 Impression of the Cloud Integration Content
To view detailed logs about any messages, select the concerned row, and message details are displayed at the bottom part of the page as shown in Figure 17.8.

