Cell Cycle Analysis
One of the first responses of most lymphocytes to an immunological stimulus is to divide. Immunologists have therefore been at the forefront of developing methodologies for cell cycle analysis. We will describe several methods (classic as well as more modern) that are commonly used by immunologists to analyze the cell cycle status of populations of immune cells.
Tritiated Thymidine Uptake Was One of the First Methods Used to Assess Cell Division
Tritiated thymidine ([3H]thymidine) uptake was the first method to be used routinely to measure cell division in lymphocyte cultures. This technique relies on the fact that dividing cells synthesize DNA at a rapid pace, and radioactive thymidine in the culture fluid will therefore be quickly incorporated into high-molecular-weight DNA. In a [3H]thymidine uptake assay, cells cultured in the presence of tritiated thymidine are subjected to proliferative signals and lysed at defined periods post-stimulation. Their DNA is then extracted and precipitated onto filters that bind to the high-molecular-weight nucleic acids, but allow unincorporated thymidine to wash straight through. The amount of radioactivity retained on the filters after washing provides a measure of the amount of newly synthesized DNA and hence the number of cells undergoing division in the culture.
Colorimetric Assays for Cell Division Are Rapid and Eliminate the Use of Radioactive Isotopes
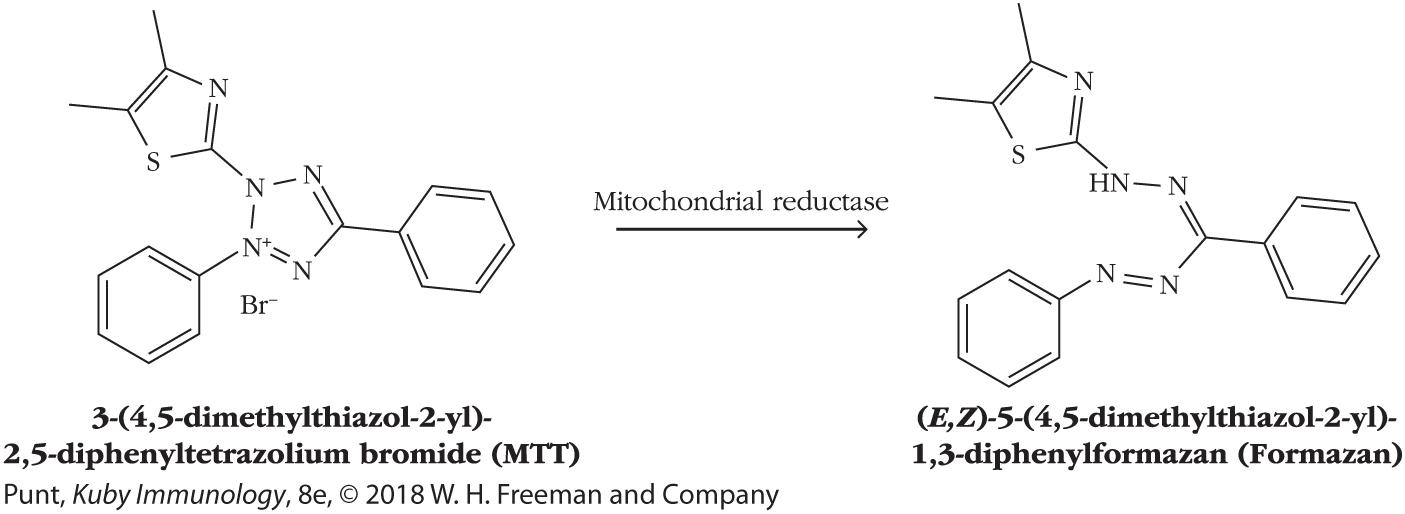
Motivated by reasons of safety and environmental responsibility to move away from the use of radioactivity-based measurements, scientists have developed a number of different assays in which metabolically active cells cleave colorless substrates into colored, often insoluble products that can then be measured spectrophotometrically. In one such assay, the tetrazolium compound MTT [3-(4,5-dimethylthi-azol-2-yl)-2,5-diphenyltetrazolium bromide], a yellow tetrazole, is reduced by mitochondrial NAD(P)H-dependent oxidoreductases to form insoluble, purple formazan dye crystals. The purple crystals can be solubilized and the absorbance of each cell sample can then be read directly in the culture wells at 570 nm, the absorbance peak of formazan (Figure 20-25). Under a wide range of conditions, the amount of enzyme activity is directly proportional to the number of metabolically active cells present and so this assay provides a readout of the number of live cells as a function of time. Since it measures the number of live cells at the end of an experiment, the MTT assay can measure cell proliferation or cell death.

FIGURE 20-25 The MTT assay is used to measure the number of viable cells in a suspension. Mitochondrial oxidoreductases in metabolically active cells convert the yellow MTT substrate to a purple formazan product that can be solubilized and read in a plate reader.
Bromodeoxyuridine-Based Assays for Cell Division Use Antibodies to Detect Newly Synthesized DNA
When introduced into cells, bromodeoxyuridine (BrdU), an analogue for deoxythymidine (dT) (Figure 20-26), is rapidly phosphorylated to bromodeoxyuridine triphosphate, an analogue for deoxythymidine triphosphate, and is incorporated in its place into newly synthesized DNA. Cells that divide following BrdU incorporation can then be identified using antibodies to BrdU. In addition to serving as a label for newly divided cells, BrdU can also mark cells for light-induced cell death. If cells that have incorporated a high level of BrdU are exposed to light, they will photolyse; this property has been used to selectively kill newly dividing cells. In recent years, other chemical analogues that mimic BrdU’s functions as a marker of dividing cells have been generated, including 5-ethynyl-2’-deoxyuridine (EdU), which can be detected directly using specific fluorescent reagents that react in situ with a reactive terminal alkyne group in the EdU molecule.

FIGURE 20-26 Bromodeoxyuridine incorporates into DNA in place of deoxythymidine during DNA synthesis. Bromodeoxyuridine (BrdU) is a thymidine analog, as the large bromine group serves to mimic the size and shape of the methyl group of thymidine. It is incorporated into DNA instead of thymidine and can be detected by anti-BrdU antibodies.
Propidium Iodide Enables Analysis of the Cell Cycle Status of Cell Populations
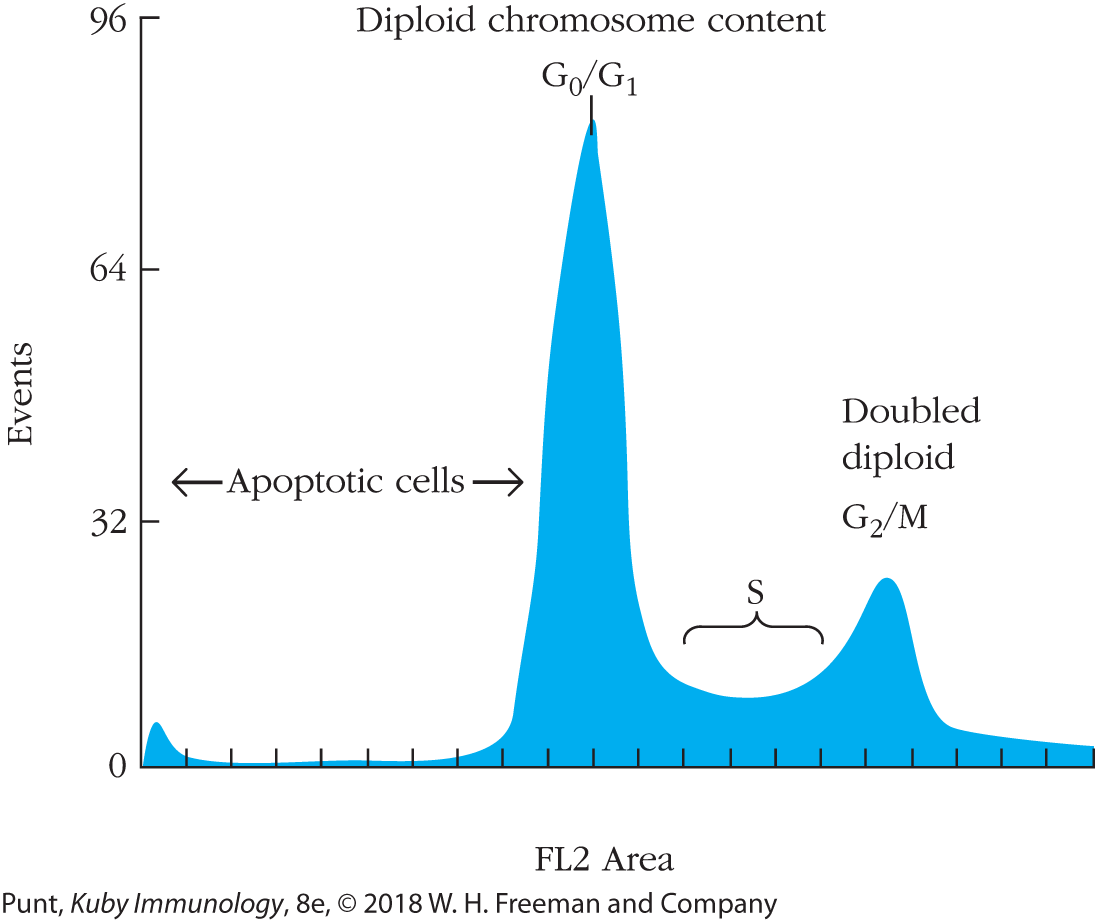
Propidium iodide (PI) is a fluorescent dye with a flat, planar structure that slides between the rungs of (intercalates into) the DNA ladder in a quantitative manner. Its fluorescence can be detected in the red (FL2) channel of a flow cytometer. When using PI to make cell cycle measurements, the investigator typically analyzes the area of the voltage pulse, rather than its height, which is used in most other flow cytometric measurements. Typically, G2/M cells are considerably larger than G1 cells, and G1 cells will have half the DNA of G2 cells about to enter mitosis; cells that are currently replicating DNA and are therefore in S phase will have an intermediate value. Apoptotic cells and fragments that have begun to break down their DNA will appear as events with less than G1 amounts of DNA (Figure 20-27). Cells that have stuck together in pairs (doublets) or larger clumps must first be excluded from analysis because they have the same amount of DNA per doublet as a cell in the G2 or M phase of the cell cycle; failure to exclude doublets will therefore result in an overestimate of the fraction of dividing cells.

FIGURE 20-27 Propidium iodide intercalates into DNA and acts as a cell cycle and apoptosis indicator. A histogram of fluorescence measured in the FL2 channel shows cells bearing amounts of DNA characteristic of apoptotic cells, and cells in the G0/G1, S, and G2/M phases of the cell cycle.
Other dyes that bind to DNA and allow for similar types of cell cycle analysis include DAPI, Hoechst 33342, and 7-aminoactinomycin D (AAD).
Carboxyfluorescein Succinimidyl Ester Can Be Used to Follow Cell Division
Carboxyfluorescein succinimidyl ester (CFSE) is more correctly named carboxyfluorescein diacetate succinimidyl ester (CFDASE), but we will use the more common CFSE abbreviation in this section. The uncharged acetyl groups, seen at the top right and left of the molecule shown in Figure 20-28a, enable CFSE to enter a cell, and are then cleaved by intracellular esterases, so that the CFSE remains trapped within the cytoplasm. In the cytoplasm, molecules of CFSE are efficiently and covalently attached to intracytoplasmic proteins, with the succinimidyl ester (seen at bottom left of the molecule in Figure 20-28a) acting as a leaving group. Somewhat surprisingly, attachment of CFSE to intracytoplasmic proteins occurs without deleterious effects on cellular metabolism or cell division.

FIGURE 20-28 CFSE labeling can be used to determine the frequency of cells that have divided a defined number of times. (a) Structure of carboxyfluorescein diacetyl succinimidyl ester (CFSE). The acetyl groups that enable the molecule to pass through the cell membranes are highlighted in red, and the succinimidyl ester that is cleaved is shown in green. The chemistry of the molecule is such that the succinimidyl ester derivatizes fluorescein at either the 5 or the 6 position of the ring in approximately equal amounts. Hence the ester is shown midway between the 5 and the 6 position on the ring. (b) The left-hand theoretical plot shows a histogram illustrating how CFSE fluorescence is cut in half with each cell division. The peak on the right of this plot represents those cells that have not divided since addition of the CFSE. The next peak to the left represents cells that have divided once, and the peak farthest left, cells that have divided twice. The right-hand plot shows real data from an experiment in which significant numbers of cells have divided one, two, three, four, or five times, with a few outlying cells that have divided six or seven times. (c) A similar experiment to that shown on the right-hand side of part b is represented as a scatter plot. Again, peaks of cell density represent cells that have divided different numbers of times.
The power of CFSE labeling lies in the fact that the amount of fluorescence emitted is cut in half each time a labeled cell divides in Figures 20-28b and c. The left side of Figure 20-28b shows in cartoon histogram form how each time a cell divides, the fluorescence per cell is cut in half. On the right side of Figure 20-28b we see how those data look in an actual experiment, noting that, in this experiment, significant numbers of cells have divided up to five times, with smaller numbers of outliers who have divided six and seven times. Figure 20-28c shows the same data viewed as a dot plot. In each case, the right-hand peak represents those cells that did not divide after CFSE incorporation. The peak to its immediate left represents cells that have divided once, the next one to the left represents cells that have divided twice, and so on. One can use the sorting capacity of the flow cytometer to physically separate those cells that have not divided, or have divided once, twice, or more times, and then analyze the separate cell populations for the expression of particular genes.