Chapter 2. The ABCs of Using Data
So far, we’ve spoken only in general terms about “data.” Before we dive deeply into exploring the topic of experimentation, we want to take a step back and talk in a more nuanced way about data. We believe that most people you ask would agree that the statement “there are 7.125 billion people living in the world” (at least at the time of publication) contains a data point. But what about “green vegetables served at camp dinner never run out”? Is that also a data point? Is that data?
This section is structured as a series of questions: the why, when, how, and how much of data collection. These questions help contextualize the series of dimensions we introduce into questions that you might ask yourself as you’re thinking about what type of data to collect.
Compared to behavioral data, attitudes and emotions can be harder to measure without introducing bias. One common issue when collecting attitudinal data is users often want to give the “right answer,” so they’ll tell you what they think you want to hear, rather than what they actually believe. This is called the social desirability response or acquiescence bias, and there are many techniques for overcoming this effect. Despite the difficulties, though, attitude and emotional data is essential to giving users a good experience. Even if every user clicks a new button, if it doesn’t do what they’re hoping, they’ll be disappointed and lose trust in your product and brand.
Data can be broken down into qualitative and quantitative data to answer different types of questions. Qualitative data uses narrative to answer questions such as “Why?” or “How come?” It can be observed but not measured numerically. In the design process, qualitative data can help build empathy for users, and can inform your understanding of their attitudes, beliefs, values, and needs. Comparatively, quantitative data expresses observations through numbers and measurement. Quantitative data is valuable when trying to answer “How many?” or “How few?” In the design process, you might use quantitative data to measure the impact to certain metrics, such as daily active users (DAU) or user retention rates (the percentage of your users who continue to use your service across two defined periods of time—for example, across two business quarters).
Finally, depending on whether you want to be able to probe deeper into the data or determine what you’re going to be able to learn in advance, you could choose to collect moderated or unmoderated data. When collecting moderated data such as in an interview, a person asks questions or observes. If something is interesting or confusing, they’re able to ask follow-up questions about why a user did a particular action. Comparatively, in an unmoderated method such as surveys, if a piece of data is interesting or unclear you’re not able to go deeper into what was meant or intended. Moderated data requires having the resources for a person to observe or interview; however, you’re able to learn more and can clarify confusion in how you ask your questions. Comparatively, unmoderated research requires a greater upfront investment (writing survey questions must be done with great care and expertise to avoid introducing systematic bias or confusing your user, as nothing can be clarified!), but because nobody needs to sit through each research session or activity, it’s easier to collect data at scale with unmoderated methods. Additionally, unmoderated methods ensure that every research participant gets the exact same research experience; they are not subject to nuances in human behavior (such as researchers asking questions using different wording, or in slightly different order).
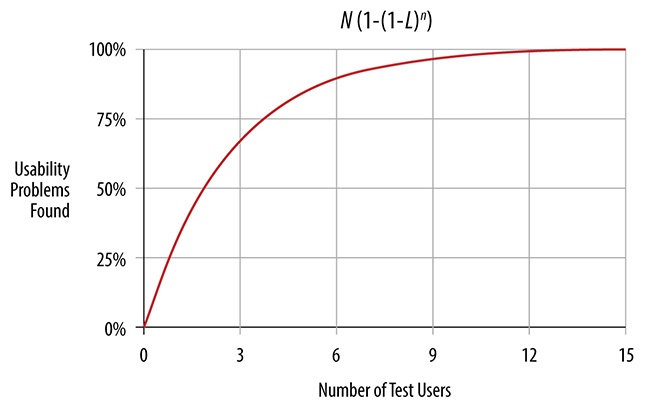
Imagine there’s a rug at work near your desk. One day, you see someone trip on a bump in the rug. Would you really wait until 10 or 100 more people tripped on that same bump before fixing it? Probably not. This is similar to how many people consider software bugs—if you observe it happen with a few software/hardware configurations you don’t know how many people will face it but you have an indication that it is a problem, and one you probably should fix. This same principle applies to usability issues in design. Research with few participants (often called “small sample research”) is perfect for identifying these types of problems, because you don’t need to quantify exactly how many people in the population will share that confusion to know it’s a problem with your design; for instance, Figure 2-1 shows that you can identify more than 85% of usability issues with only five participants. If you spend time with fewer people, you can also collect richer and deeper data in the same period of time. However, for certain types of small sample research, you can’t guarantee that the findings will generalize to everyone in your population. You also can’t quantify with a high degree of accuracy how many users in the population are likely to experience a problem, or feel the same way as your participants. This means research with just a few people isn’t good for making decisions where you have to be confident about the frequency of a problem, for instance.
Comparatively, data collected from many participants (often called “large sample research”) can give you more precise quantity and frequency information: how many people feel a certain way, what percentage of users will take this action, and so on. In an ideal world where you had unlimited resources, you might find it better to always collect more data rather than less. This would ensure that you learned everything possible. However, you may not have the time to do this kind of research. Generally, the larger your sample, the more sure you can be that your findings will generalize to the population (so long as the sample is representative, which we will discuss later). There are statistical methods you can use to determine how many users you need to collect data from to reach a certain degree of confidence in your findings. We won’t be getting into the details of this here, but we recommend reaching out to your analyst or data scientist friends to talk about the relationship between sample size and statistical power if you want to learn more.
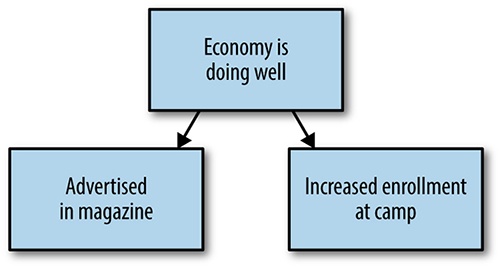
 In our camping example, let’s say we were trying to learn more about which advertising causes more campers to sign up. We might conclude that the successful sales of a magazine containing a camp advertisement caused increased enrollment at camp (Figure 2-2).

In fact, it could be the case that an improvement to the overall health of the economy led to both the successful magazine sales and increased enrollment at your camp, as economic health could lead to more disposable income in families for spending on both magazines and summer camps (Figure 2-3).
The power of A/B tests and experiments is that they provide controlled environments for us to understand why something happened; in other words, they let us establish causality. This is important to designers because by understanding the underlying causes of behavioral effects, we can make informed decisions about what will happen if we make a product or design change. This also lets us understand with accuracy and confidence how our decisions cause changes in our user’s behavior. Furthermore, we can protect ourselves against the very human tendency to see patterns in data and behaviors that confirm what we already think (what psychologists call “confirmation bias”), and mitigate the risks of investing time and company resources on assumptions that aren’t proven.
That said, there’s different ways to define “meaningful.” Rigorous qualitative methodologies are undoubtedly meaningful sources of evidence, and are essential in making good product decisions. One way to ensure that your data is meaningful is by designing good research—for instance, by asking well-thought-out questions that are not biased, bias inducing, or leading. User researchers, for instance, are trained experts in doing this type of work.
When thinking about statistical significance and its relationship to whether something is meaningful, Arianna says:
As we have noted, A/B tests are great for identifying statistically significant results, allowing you to form beliefs that you observed a true effect rather than something that happened by chance. Aside from it being very exciting and satisfying to see your work pay off with a statistically significant result, why should you care about significance in experimentation?
This ability to make data-aware choices about what will happen is extremely valuable. Your company can save time and resources by investing further in projects that perform well, while redesigning, rethinking, or pivoting away from ideas that perform poorly or don’t elicit the intended user behavior. In addition to these business advantages, A/B testing allows designers to quantify the value of their work on the user experience or their company’s bottom line. This is important because it helps designers articulate why investing in and prioritizing good design is important to their stakeholders and their business. We believe that understanding and speaking the language of data-aware methodologies like A/B testing empowers designers to argue that investing in good design is measurably, not just philosophically, critical to a business’s success.
In the words of Colin McFarland,[5] “an experiment is a means of gathering information to compare an idea against reality.” In some sense, you’ve probably been running experiments your whole life: maybe last time you cooked brownies, you substituted whole eggs for egg whites. You tracked how quickly your family and friends ate the brownies, and compared it to the rate of consumption last time you made the brownies using whole eggs. This scenario seems basic (and probably resembles things you’ve actually done), but it contains the basic building blocks of every experiment: a change, an observation, and a control (Figure 2-4).
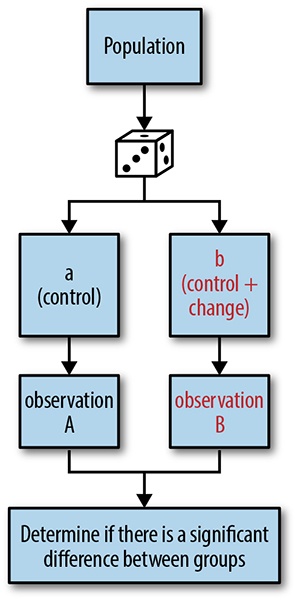
In an experiment, you make some change (using egg whites), and measure that change against a control (using whole eggs, the default recipe), to observe whether the change has had an impact on rate of consumption. The intuition here is that you are comparing two or more things that are almost the same: an experimental group and a control group. The only difference between these groups is the change that you deliberately made; in other words, your experimental group is basically your control group + some change. Therefore, if you observe a significant difference between these groups in a well-designed and well-controlled experiment, you can conclude that that difference was most likely caused by the change that you made (rather than just the result of random variation), because that was the only difference between the two groups This is how experiments establish causality.
In designing an experiment, you make a hypothesis, or a testable prediction, about what the effect of your change will be. Based on what you observe, you determine whether or not to reject your hypothesis. Rejecting a hypothesis generally means that you assume that your change did not have the intended or expected effect. This is the most important part of an experiment, because determining whether or not you reject your hypothesis is tangible learning. The goal of every experiment (just like the goal of using data in general) should be to learn something. Given the importance of hypotheses, we’ll give a more in-depth treatment to this concept later in the chapter, and in subsequent chapters as well.
Now that you understand the setup of an experiment, we’ll use a basic example from our summer camp metaphor to help introduce more granular language about experiments. Imagine that as part of your summer camp, you have a hike to another campsite deep in the woods. This is a bonding activity for your entire camp and a great source of exercise. You’re realizing that as you expand the fun activities and offerings at your camp, you need to shorten the time it takes for kids to do this hike, so that you have time for other activities in your summer camp programming. You decide to treat this hike as a bit of an experiment, by varying some factors while controlling for others, to learn about what equipment makes kids faster at the hike. This way, you can invest in equipment for the whole camp that is effective, instead of spending money on equipment that isn’t useful for your campers.
Let’s assume that campers are assigned to a cabin based on their age; that is, all campers in a cabin are similar in age. We can also assume that there are eight campers per cabin, and we’re trying to build four groups for our hike. We could sample campers by assigning two campers from each cabin to each of the four groups, resulting in groups that have a range of camper ages. So long as there’s no systematic bias in the two campers who are assigned to each group from each cabin, all groups should be representative of the whole camp.
Now, let’s say that your experiment is to vary the different type of equipment that each group gets:
Group | Equipment Received |
1 | Map (control group) |
2 | Map, compass |
3 | Map, GPS |
4 | Map, protein bars |
People have been running experiments formally and informally for a long time. Back in the 1700s, a British ship captain named James Lind ran a naïve experiment after observing that sailors on Mediterranean ships who received citrus as part of their rations had lower rates of scurvy than other sailors. He gave half his crew limes as part of their rations (experimental group: diet + citrus fruit) and the other half just ate the regular diet (control group: diet only). He found that compared to the control group, the experimental group had a significantly lower rate of scurvy, leading him to conclude that citrus fruits like limes prevent scurvy. He wrote:
The most sudden and visible good effects were perceived from the use of oranges and lemons; one of those who had taken them being at the end of six days fit for duty.... The other was the best recovered of any in his condition; and being now deemed pretty well, was appointed nurse to the rest of the sick.[6]
The digital age has radically changed the speed and scalability of experimentation practices. Not too long ago, the primary way that you shared photos with someone was much more complicated: first, you would have to load your camera with film and then take a series of snapshots. When your film roll was done, you’d take that film to the local store where you would drop it off for processing. A few days or a week later you would need to pick up your developed photos and that would be the first time you’d be able to evaluate how well the photos that you took many days prior actually turned out. Then, maybe when someone was at your house, you’d pull out those photos and narrate what each photo was about. If you were going to really share those photos with someone else, you’d maybe order duplicates and then put them in an envelope to mail to them—and a few days later, your friend would get your photos as well. If you were working at a company like Kodak that had a vested interest in increasing people’s use of their film, processing paper, or cameras, and you were asked to collect insights about customer behavior to drive designs that would increase usage, there would be many aspects of customer behavior and parts of the experience that would be hard to accurately measure. You’d also have almost no way to collect insight into your customer’s behaviors and actions along the process, and it would be even harder to conduct experiments to compare different product offerings. How would you observe the different rates of photo taking or sharing with different kinds of cameras, or the performance of real user’s photos with different kinds of film? It would be extremely challenging to track down that kind of data, especially outside of a customer experience research lab and in real (and therefore imperfect) contexts.
Now let’s take the same example of sharing a photo in the digital world. Your user will take out their phone, open the camera app, and take a photo. They may open up Instagram, apply some filters to the photo, and edit it on the spot before adding a caption and then sharing it. They might also choose to share it on different channels, like Twitter, Facebook, or via email. The entire experience of sharing a photo has been collapsed and condensed into one uninterrupted flow on a single screen, one that you can hold in the palm of your hand. And because all of this is digital, data is continuously being collected along the way. You have access to all kinds of information that you wouldn’t have had before: location, time spent in each step, which filters were tried but not used, what was written about the photo, and to whom the photo was sent. In addition, you’re not limited to observing just one user—you can gather this information from each and every user. You can make changes to your interface, filters, flow, or sharing options and observe—at scale—how real users respond as they take real photos of real moments in their life. And, because the data logging can be made automatic and seamlessly integrated into your experience, you can amass huge amounts of data quickly.
This example illustrates the power of digital interfaces for data collection. Although experimentation has been around a long time, the internet enables us to collect large amounts of data about our users cheaply and quickly. Many internet companies invest in internal tooling to enable anyone in the company to deploy an A/B test and collect results in a matter of days or weeks, helping them make business-critical design decisions in real time, as a fundamental part of their existing product development processes. For instance, Skyscanner has “Dr Jekyll”,[7] LinkedIn has “XCLNT”,[8] and Etsy has “Catapult”[9] for this purpose. Imagine how much more effort it would have taken Kodak to learn enough about their users to make reliable decisions in the pre-internet age. For these reasons, now more than ever is an exciting time to embrace designing with data. A/B tests—or online experiments—are one powerful, versatile way to do that.
A/B Testing: Online Experiments
As we have been discussing, A/B tests are essentially online experiments. The concepts—making a change and measuring its effect compared to a control group—are nearly identical. However, over time, A/B testing has adopted a language of its own that is more closely aligned to existing business terms. Here, we’ll help map over the general concepts we introduced to A/B testing-specific terminology that you’re more likely to hear in your business context. We’ll also get a bit more specific with a few additional concepts that are practical and important to understand, such as statistical significance.
When you’re looking to learn more about your users through data, one of the first questions you need to ask is which users to gather data about. Doing research with the right group of users is really important and will play a factor in how you interpret your results. Your user base is probably quite varied. By subdividing your user base into either cohorts or segments, two ways of thinking about how to split your users, you can gain different insights into their behaviors or motivations that you wouldn’t have seen if you had just considered them as one large group.
For example, perhaps in January you get a lot of visitors to your service who are coming because they got mobile phones for Christmas. These people might be different or have different motivations than the people who might sign up for your product at other times of the year. Applied to our summer camp metaphor, one cohort might be first-time campers in summer 2016. The types of activities you ran that summer, as well as the advertising you focused on prior to that year, will define their baseline and expectations for summer camp.
For instance, according to former Chief Product Officer John Ciancutti, online learning and course site Coursera has several different segments that they consider when building products: lifelong learners, seasoned professionals, and unseasoned professionals. These different segments have unique needs, approach the product in different ways, and may be more or less likely to pay for Coursera’s offerings. He said:
For instance, perhaps you decide to focus on a cohort of campers who attended your summer camp for the first time in 2015. This might help you learn meaningful insights about campers who are very similar to that cohort—for instance, they might extend to other middle school–aged campers from similar home backgrounds, as your camp only accepted middle schoolers in 2015, and you advertised primarily to suburban neighborhoods near New York City. However, the data you gather if you do research with this cohort would not necessarily apply to other potential future campers, such as whole families (if you became a family camp), high school–aged campers, or campers from the West Coast or other countries, because those perspectives weren’t reflected in your original cohort. As you can see, then, the sample(s) you focus on in any given A/B test will determine the population(s) to which your insights will apply; you should confine insights and generalizations to the groups of which your sample is representative.
For example, online accommodations rental service Airbnb answered some of these questions by sending some of its top experience researchers directly to their population in question: Japanese superhosts. The company was curious about why the number of home listings in Tokyo was so low relative to the urban city’s large population. The team did ethnographic research with some of Tokyo’s Airbnb hosts to understand what demographic these hosts occupied, what their values were, and what made them different than people in Tokyo who didn’t host. Airbnb’s researchers found that although the hosts in Tokyo seemed very different at face value, all of them were “outliers” in the sense that they had a positive defining experience with outsiders. Unlike many Tokyo residents, these super-hosts were willing to share with outsiders and bring foreigners to Japan, making them ideal early adopters of Airbnb in Tokyo.[10]
As you’re trying to learn more about your users, not all of these questions will be relevant, but hopefully you can see how getting some of this information and data will shape the way you design for your customers. It’s also rare that your experience won’t need to adapt and change as your user base evolves and grows over time. For this reason, it’s also important to remember that gathering data and understanding your users is an ongoing effort.
New users versus existing users
For most products and design decisions, you’re probably already thinking beyond your existing users toward the acquisition of new users. Data can help you learn more about both your existing users and prospective future users, and determining whether you want to sample from new or existing users is an important consideration in A/B testing.
Existing users are people who have prior experience with your product or service. Because of this, they come into the experience with a preconceived notion about how your service or product works. This learned behavior can influence how they think, what they expect, and how they experience new features that you introduce to your product or service, which is an important consideration when testing new designs in front of existing users. Compared to existing users, new users do not have experience with your product. If you’re trying to grow your business, you might be more interested in learning about new users because they aren’t predisposed to your current experience.
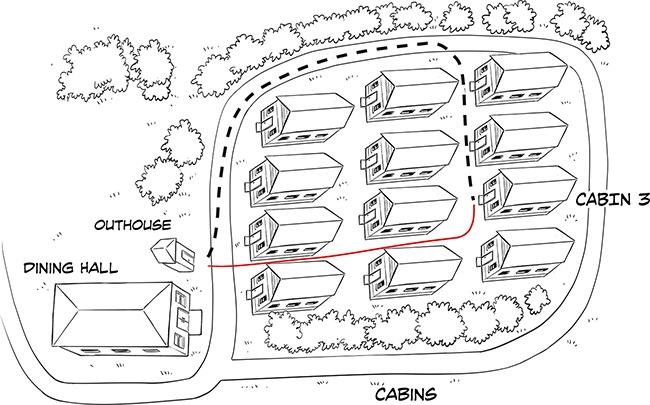
To illustrate the difference between new and existing users, imagine that you’re going to make some changes to the layout of your camp during the off-season, by moving the outhouse closer to the dining hall. The previous layout of your summer camp is shown in Figure 2-5.
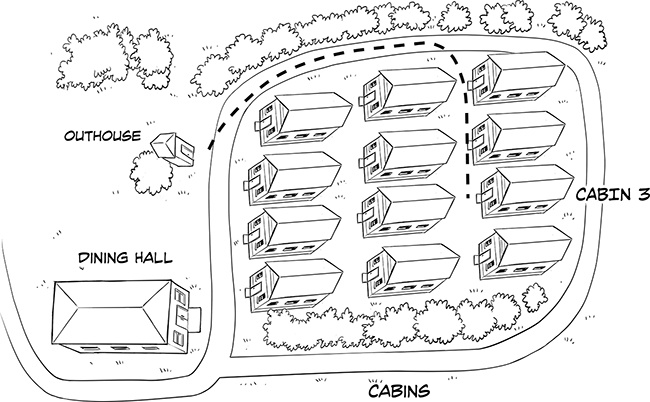
After you move the outhouse, you observe that returning campers from cabin 3 take a much longer path to get to the outhouse, while new campers in cabin 3 take a more direct path. This makes sense; they are basing their navigation on their past experiences. Returning campers need to overcome the learned behavior about how to get to the old outhouse location by using the road; they have engrained habits that lead them to walk that direction whenever they need to use the toilet. By contrast, new campers lack these old habits about where the outhouse used to be, and therefore can walk to the new location more directly through the other cabins. Figure 2-6 demonstrates the differences between returning and new campers.
Thus, it’s important to be careful about whether your test is with new or existing users, as these learned habits and behaviors about how your product used to be in the past could cause bias in your A/B test.
In addition to learned habit effects, you also need to be thoughtful about demographic differences between your existing users and folks who might become your users in the future. For instance, your existing user base might have a different demographic bias than potential new users. If your initial offering had high traction with tech-savvy or younger audiences, then it’s likely that any sample of existing users will actually have disproportionately more representation from younger and more tech-savvy folks than the average population. It’s good to ask yourself if your original customers are representative of the kinds of people that you want to be your customers one year from now. Will you continue to target tech-savvy people or are you hoping to gain audience share by moving toward a more mainstream, less tech-savvy population?
Broadly, a measure is anything you observe, capture, and count. Examples of measures might be the number of users that visit a page on your website or the number of people that successfully complete a process. A metric is a predetermined and evaluative benchmark, which has been determined to have some business value. Metrics are sometimes the result of comparing several measures, often as a ratio. Metrics are used because they can tell a compelling story about the health of your business or your designs. Acquisition, retention, and activation rates are all examples of metrics.
At Etsy [defining key metrics] is less controversial than it would be at many companies. Etsy is a business selling things, so the metric that we can optimize for is how much money we can make. The other way that we were lucky is that those metrics directly correlate to our users’ interests. The point of Etsy is to have other people sell stuff, and we make money when all those people sell stuff. When we sell more stuff, our sellers are happy and we are also happy. Those are the things we at Etsy cared about.
We won’t go into detail about how these different factors affect the metrics you should be thinking about here, but a great starting place is to ask around and find out what metrics your company is already measuring. As John shared, metrics that track time or money are often intimately connected to your business. Many companies will track key metrics even outside of A/B tests. For instance, you might be interested in how many “engaged” users you have. A basic engagement measure is the Active User (AU). The idea is to capture how many people use your product or service on a daily or monthly basis. Business reports often include summaries of Daily Active Users (DAU) and Monthly Active Users (MAU), potentially across many categories if the nature of the business is complex. To Wikipedia, an AU may be someone who contributed to more than one article. According to the Wall Street Journal, Twitter considers a user active if they log in once a month. For a social platform, an active visitor is someone who has come back to the platform at least once within 30 days. For an ecommerce platform, a metric like active browsing 2 days out of 7 may be the metric the business considers successful. For a news media outlet, active engagement with stories once a day may be sufficient.
The point we are trying to make is that deciding what to measure—and knowing that you’re measuring it well—can be challenging. Think about how this might apply to your race to the campsite. Originally, we said your metric of interest was time to the campsite. But maybe emphasizing time over all else really isn’t the most important metric, because campers will be happy doing less activities at camp but with a more fun and enjoyable pace. A different key metric you could measure is camper happiness. As you can see, there’s no objective way to determine whether camper happiness or time to campsite is more important—this is a judgment call that you’ll have to make, and the kind of judgment that designers and other folks on a product team have to make every time they run an A/B test.
We wanted to close out this section with a great comment from Arianna McClain about the subjectivity of measurement. Arianna reminds us that, “Measurement design is subjective. Someone decides what to measure, how to measure it, and how to build the model. So all data is subject to human bias.” As we just alluded to, the decision about what to measure and how to measure it is subjective; the way we usually phrase it is that behind every quantitative measure is a set of qualitative judgments. Designers have a big role to play in asking thoughtful questions and applying their expertise about users to guiding how a design or experience should be assessed, what matters from a user experience point of view, and how to get meaningful data that informs those questions.
Even though statistical significance is calculated at the end of a test, you’ll need to think about whether you can measure a statistically significant result during the design of your A/B test. Power is the probability that you can correctly detect a statistically significant result when there is a real difference between your experimental and control groups. When you design an A/B test, you want to make sure that your test is powerful enough to detect a difference in your groups if one does in fact exist. Unlike statistical significance calculations, this is an upfront calculation, before you launch your test. Here’s one way to think about the difference: power tells you whether you’re capable of observing a difference, while statistical significance tells you if you did see one in the samples that you observed. You can think of an underpowered test as having glasses that are too weak to correct your eyesight: if you don’t have a strong enough prescription, you probably won’t be able to tell the difference between a cat and a dog, and you’ll end up with a blurry and untrustworthy view of the world.
In product design, we define the minimum detectable effect (MDE) to be the minimum difference we want to observe between our test condition and control condition in order to call our A/B a success. The MDE often depends on business factors, like how much revenue increase would result from a difference at least that big in your metric. The intuition here is basically that the cost to test and implement that change should be “paid off” in some way, through a meaningfully large difference in some metric that is key to your business’s health and success or a sizable improvement to your user experience. You might also choose an MDE based on previous A/B tests you’ve run—this knowledge of how big an effect you’ve seen in the past can help benchmark how big of an effect you’d want to see in the future.
Let’s say that one camper tells you they saw a skunk behind the outhouse. You might be inclined to think that they just saw a squirrel or a raccoon but thought it was a skunk. Now, what if you heard from five campers that there was a skunk behind the outhouse? This would probably make you a little bit more inclined to believe it, and you might even have an inkling of worry about a camper encountering the skunk. What if you heard from 50 independent campers that there was a skunk behind the outhouse? By now, your confidence that the skunk is there would likely be so strong that you’d probably temporarily allow campers to use counselor bathrooms, lest they get sprayed on their way to or from the outhouse.
Here is another example. Let’s say that each of your four groups for the race to the campsite had only one camper, because everyone else got sick and couldn’t go. You might observe a difference between the groups, but you’d probably be skeptical about making purchasing decisions on such a small sample—it’s only one child who was faster, how do you know that it wasn’t just because she was extra tall or extra athletic? But what if, now, each of the four groups had 40 campers? Assuming that the groups stayed together, if you observed that Group 4 was fastest to the top, you’d probably feel fairly confident basing decisions off of that data because you have more information. All of the differences between the groups would probably level out, and 40 kids beating out 120 other kids would be more compelling than 1 kid beating out 3 kids.
Recall that p-values represent the probability that the difference you observed is due to random chance. When we see a p-value of .01, for instance, this means that 1% of the time we would observe the difference we saw or an even bigger difference just by random chance, not because of any meaningful difference between the groups. But how small of a p-value is small enough? This depends on how confident you want to be. In many social science fields like psychology, any p-value less than .05 (5%) is taken to be statistically significant—that is, the observed difference is assumed not to be due to chance. Another way to say this is that 5% of the time, you’ll think you’re observing a real effect in your data when actually it’s just random noise in the data that occurred by chance. In other fields such as physics, only p-values less than 0.0000003 are taken to be statistically significant.[11] This is of course impractical for the types of changes we make in product design, even for the largest Internet sites.
Part of designing an A/B test is determining the degree of confidence you will accept ahead of running your test. Are you OK with the result of your tests being wrong 5% of the time? That’s the typical range most internet teams set. How about 10% of the time? 20%? Only you and your teammates can decide the type of risk you’re willing to take. The main reason to be more generous about your risk taking is that more risk means you require less statistical power. And less power means smaller sample sizes, which in practice probably means shorter and less costly tests because you need less time to get data from less users.
As you can see, much of designing an A/B test involves making trade-offs between these different factors that depend on your context. However, the statistics of your test are only one important piece of the puzzle for gathering important learnings about your users. Having a solid hypothesis that expresses what you aim to learn is equally important. This is the topic of our next section.
No matter how numerous; for any conclusion drawn in this way may always turn out to be false: no matter how many instances of white swans we may have observed, this does not justify the conclusion that all swans are white...but it can be shown false by a single authentic sighting of a black swan.[12]
We find that keeping the formal definition in mind is helpful because it can be a good reminder to us that the beliefs we form about the relationship between user behavior and metrics should not be held so strongly that we become blind to the possibility that they can be disproven. Having this mindset will allow you to maintain a healthy attitude toward experimentation. Sighting a black swan—that is, being disproven—can often be the most valuable kind of learning. We challenge you to embrace these opportunities as a way to correct misconceptions and build sharper design intuitions.
With respect to data and design, your hypothesis should be a clear articulation of how you think your design will affect customer behavior and metrics and why it will have that effect. Said slightly differently, it states what you presume will happen to your metric(s) because of a change that you are going to make to your experience—essentially, it’s a prediction about the outcome of an experiment. If you have formulated your hypothesis well, then you will also have a good understanding of what you will learn about your users whether your hypothesis holds or is disproven. Having a strong hypothesis is key to the experimentation process and having a hypothesis that can’t be tested is ultimately of no value to you.
Your hypothesis should be a statement, a proposition that you make to describe what you believe will happen given specific circumstances. It often but doesn’t follow the form: “If we do X, users will do Y because of Z which will impact metrics A.” Returning to our earlier example of the race to the campsite, recall that we assigned the following equipment to our four groups:
Group | Equipment Received |
1 | Map (control group) |
2 | Map, compass |
3 | Map, GPS |
4 | Map, protein bars |
It’s easy to see here how giving campers navigational equipment like a GPS or compass would help test Hypothesis 1, while giving them protein bars would test Hypothesis 2. Simply put, if we observed that there was no difference in the time to the campsite for Group 1 (control) and Group 4 (experimental group, Hypothesis 2) then we could disprove Hypothesis 2—giving campers additional food did not decrease the time it took to get to the campsite. Similarly, if there was no difference between Group 1 and Group 2 or 3 we could disprove Hypothesis 1—navigational equipment did not help to get to the campsite faster. One important note here is that both Group 2 and Group 3 address navigation. These are two possible ways we could test the same Hypothesis 1. In Chapter 5, we’ll talk about different ways to “get at” the same hypothesis.
We might also observe that Hypothesis 3 is not disproven—the campers who got food are in fact measurably happier relative to the control group. As you can see, then, what you stand to learn depends not only on the exact experimental setup but also the metric you specify in your hypothesis. This is important, because it illustrates one major reason why defining a clear hypothesis is important: it helps build alignment among you and your team around what you think is important, and the criterion by which you will evaluate your test outcome. A clear hypothesis that involves a specific metric makes it clearer whether a test is a success or failure, paving a clearer path to next steps based on data.
There is always a temptation when embarking on a new project to jump right into exploring different design solutions or to begin to plan how you might execute on your ideas. It is a commonly accepted best practice in the design world that it takes many iterations to find the best design. The same is true for experiments. We don’t want to mislead you here into thinking that you should make one hypothesis and then go straight into testing it with an A/B test. In the remaining chapters, we’ll deep dive into how going broad is essential to learning the most from your A/B tests. But for now, just remember that choosing what you test is critical, and taking upfront time to focus your efforts on the most meaningful tests will help you learn the most.
That’s what A/B testing is at its core: uncovering the most meaningful insights about your users and how they respond to your product and design changes. We believe that if you start by considering why you think a design will have an important or meaningful impact, it will ensure that you and your team can learn from each design in an A/B test. In order to emphasize learning as central to your A/B testing process, we encourage you to clearly articulate what it is you’ll learn from each hypothesis you test.
You should aim to have two things when crafting a hypothesis:
A hypothesis statement that captures the essence of the change you propose to make and what you think the effect will be.
A clear understanding and a plan that addresses what you would learn by testing that hypothesis.
You should reach a clear agreement on both the hypothesis statement and learning statement with the other folks you’re working with (your team and any other stakeholders) before you embark on your design process. This is especially important when your hypothesis is disproven. Working with your team early on to articulate your possible learnings for all outcomes will help ensure that no matter what the data shows, you’ll have gained interesting and actionable insights about your users.
For example, if the changes that you made to the experience you were testing resulted in metrics that were negatively impacted instead of positively impacted (e.g., you lowered the sign-up rate rather than raised it) what useful information did you learn from your test? Did your customers behave differently than you expected or did they behave as you expected but the result of that behavior was different than what you predicted would happen? We’ll cover analyzing your results in Chapter 6, but the point here is that tying your hypothesis back to the lesson you are trying to learn can be really helpful in the long term. Don’t run a test, conclude that it failed, and forget about it. Unfortunately, this is a pitfall we see teams fall into all the time. Emphasizing that all experimentation is about learning ensures that negative test results aren’t really “failures” at all, because you still gain valuable insights into your users and the impact of your designs, data that will inform and improve your future experiments. Only when you can leverage failed results as well as successes can your company truly be “data aware.”
Running Creative A/B Tests
Anyone involved in product or design work would agree that creativity is essential to doing good design work. However, typically there is more pushback on the claim that experimentation is a creative process. Unfortunately, the narrative around A/B testing that we often hear is that it’s “just a way to validate your design before shipping” and “it’s for crazy and meaningless optimizations, not interesting design problems.” If you take nothing else away from this book, we hope that you come away feeling that A/B testing and other data methodologies can be as creative as the design process you already know and love. To help make that point, we’ll emphasize two main ways that you can bring creativity into your A/B tests.
Data triangulation is using multiple methods to form a holistic picture of your users and your data. It can help further improve your understanding of user behavior by explaining why you found a result to be true among many users in an A/B test, or understanding the magnitude of a finding you saw in a small-sample, moderated research activity like a usability test. Data triangulation also helps you avoid falling into the pitfall of relying too heavily on a single source of data and can spur endless new ideas for future A/B tests or design iterations.
Let’s imagine after the race to the campsite that you were surprised to find that Groups 2 and 3 (the compass and GPS groups) were even slower than the control group. This would undoubtedly be a puzzling result—how could having equipment that intuitively seems to make group fasters by helping them take a more direct route actually make them slower? To understand what happened, you decide to interview some of the campers in those two groups to learn about their experience. In those interviews, you might discover that many of the campers complained a lot about mosquitoes. They stopped often during the hike due to bug bites, and were slowed down by swarms of mosquitoes in their face. Just by looking at the results of your experiment you never would have understood such a puzzling result; data triangulation gave you a more complete view of your campers’ experience.
In Chapter 1, we showed you an illustration (shown again here in Figure 2-7) to get you in the mindset of thinking about the types of problems you’re trying to solve. Design can solve many problems, and from our experience it can be easy to lose track of the landscape of possible design activities you could be engaging in, depending on your goals and type of problem you’re trying to solve.
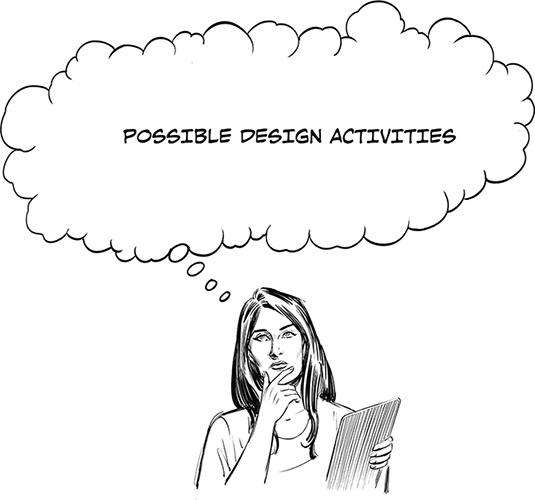
Previously, we left the space of possible design activities very vague. Now, we’re going to take a moment to provide a framework for thinking about how you could understand this space. One of the themes we hope you take away in his book is that using experimental methodologies as a means of gathering data fits seamlessly within the existing design process. Flexible methods like A/B testing can be used for a wide variety of design problems, but in order to do so successfully, you need to be aware of the design activity you’re trying to work on. This is another way that creativity makes its way into the process of designing with data: the data can answer many questions, but you need to be the driving force behind asking and solving the right design questions.
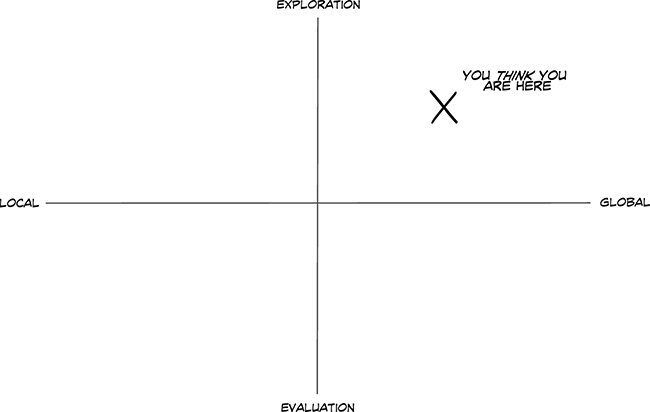
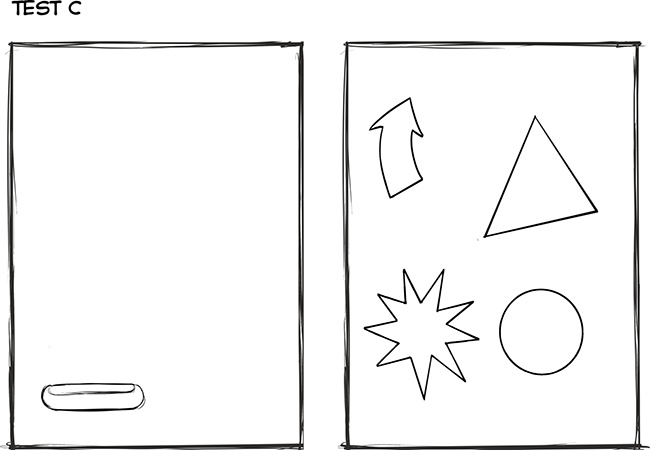
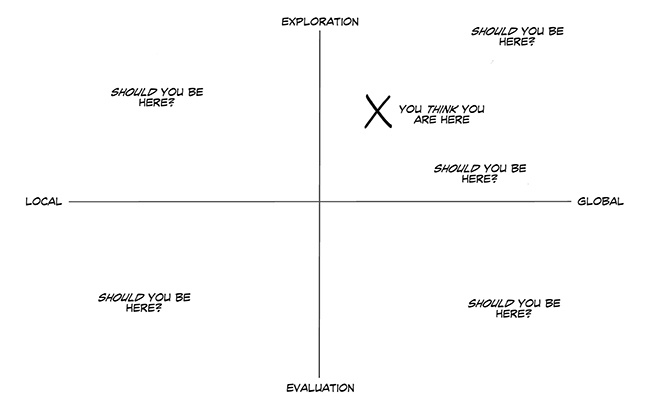
You can imagine taking the space of design activities and overlaying it with a grid. One axis represents the scope of the problem you’re solving: Is it a global or a local problem? The other indicates how far along you are in solving that problem: Are you close to finished, and just trying to evaluate your work, or are you just beginning to explore the space of possible solutions (Figure 2-8)?
As a designer, you may have already encountered conflicts with your team about how “finished” your design output is. We’ve often heard designers complain that they agreed to launch a piece of work they deemed “unfinished” thinking that it was a temporary placeholder, only to find that their team thought it was the finished and final product. Thinking about whether your problem is exploratory or evaluatory can help you address these team-wide decisions on how close you are to finishing the work. As a general rule, you can think of this dimension as conveying how close or far you are to coming up with a solution to launch to your entire user base (not that this is to say the process is purely linear; you might be evaluating a solution only to uncover something that forces you to start exploring other alternatives!). In other words, exploration helps you figure out what to build next, while evaluation helps you measure the causal impact of your work.
When you are at an exploration stage, you don’t necessarily have a specific solution in mind. Instead, you are seeking directional input on the types of solutions that will or will not work for your users. In the exploratory phase, your attitude will need to be more open minded; you might discover things out about your users that you weren’t expecting, which could alter the way you are going to approach your design moving forward. When you’re in an exploratory stage, the types of questions you might be asking are “How will my users respond to this change?” or “What happens to the metrics when I do this?” If instead you are at an evaluation stage, then you will likely be looking for very specific answers. You’ll want to know whether or not your design works in the way you expected and why it performs that way. When you’re in the evaluation stage, you might ask yourself “Can my users complete their goals with this design?” or “Did this design improve or maintain my company’s key metrics? Did I observe any drops in my metrics?”
The result of your A/B test should never be a decision to launch the winning design and move on when you’re in the exploration phase; rather, it should be to take the learnings from the test and apply them to future design work, iterations, and more A/B testing. Comparatively, as you move toward evaluation of your designs, you should expect that you’re getting closer and closer to a “finished” piece of work that you would be comfortable launching to your users. At this point, you and your team should already be directionally aligned and you might be making smaller tweaks or polishing your work. The output of a successful A/B test might be to start launching the design to more of your user base. We’ll talk more about this in Chapter 6.
Thinking Global and Thinking Local
A second dimension you want to think about defines the scope of how broad or narrow your design thinking is, and how optimal you want your solution to be. We can classify this decision of scope as looking for global versus local solutions. You can think of this dimension as determining how big of a design change you’re willing to make; that is, how much you are willing to optimize.
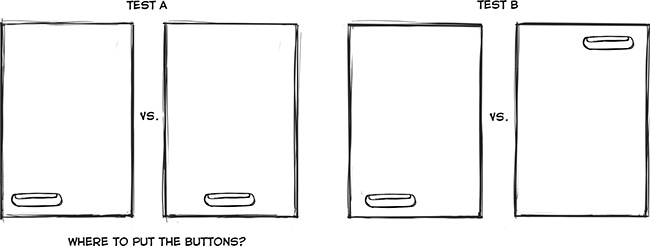
When designing for a local problem, you are focused in on a specific solution, and you’re making small changes to just one or two pieces of the experience in order to understand their impact or importance in isolation. In design folklore, these are the types of problems traditionally assumed to use A/B testing—for instance, when varying factors like the placement, color, size, and copy of a button to yield the best click-through rate. Local problems generally involve shorter time scales and are most appropriate when your existing solution is already performing adequately. Your design iterations for a local problem are generally less pronounced, changing only one or a few factors at a time (Figure 2-9).
By contrast you are solving a global problem when you’re completely redesigning an existing experience. This might be because your existing solution is performing poorly, because it’s outdated, or because you’re looking to make many large changes to your experience or product at the same time (for instance, you want to change the entire sign-up flow for your product because user attrition during the existing flow is very high). Your design iterations will likely be quite dissimilar, and it will take more time to land on the best solution when you’re changing many factors at once, because you won’t be able to separate what part of your change caused a difference. You might be trying to understand whether a given feature matters at all by changing many variables at once (Figure 2-10).
Closely related to the concept of global and local problems is the idea of global and local maxima. These concepts are borrowed from mathematics, although we find that they apply well to thinking about design and are used for this purpose among many designers. Many people explain global maxima and local maxima using the metaphor of a mountain range. Within that mountain range, each mountaintop is the tallest point in a region; however, only one of the mountains will be the tallest in the entire range. Each mountaintop symbolizes a local maxima in design, and there can be many possible local maxima. These are the best solutions within the space you are considering. For instance, perhaps you’ve done a lot of work to optimize for the color, size, and copy of a “Sign Up” button. It yields the best subscription rate of any of the designs you’ve tried. For many types of problems, optimizing for that local maxima will be good enough for your purposes. However, you can’t be sure that the local maxima you’ve found is the best overall way to get folks to subscribe to your product. That optimal point—the tallest peak in the entire mountain range—is called the global maxima. Identifying a global maxima can be challenging, because unless you explore many divergent solutions it’s hard to know whether there’s a better point than the one you’re currently at. We’ll discuss this more in Chapter 5 when we cover how to design for the hypothesis you have in mind. In the case of driving more registrations, you might do global explorations and find that the global maxima involves offering a free trial of your product before asking your users to pay money to subscribe.
Getting back to the question of whether you’re tackling a global or a local problem, you might ask yourself which of these two approaches is right for your design problem? Are you thinking too broad (your problem is actually local), or too narrow (your problem is actually global)? The answer depends on many factors. We want to be clear that a global change is not necessarily going to be more impactful to your metrics than a local change—global versus local defines how big a difference is in your experience relative to your control, not how big of a difference you’ll observe in your metrics. Often, making a global change to your app or experience will require more resources and a much longer timeframe. In those cases, you should be thoughtful about how much “better” the global maxima (that is, the best possible result across the whole of the app experience) is compared to the local maximum (that is, the best possible result on the specific thing you are testing). Does it justify the extra resources, effort, and time? Is solving for this global problem the most important thing for you to be working on right now, or is a local optimization good enough? Does local optimization have the potential to create a large effect on your metrics? These are questions you can’t decide on your own. Bringing your team into alignment on these issues at the beginning of the project will help you design solutions that are best suited for the constraints and goals you’re currently trying to solve. Bringing other teams in and engaging with business strategists can also be useful because “global” can be confusing—some simple or local experiments can impact the whole product, and can be global. A good example is changing a “call to action design” on every page.
Notably, both of these dimensions can vary together: you can do global evaluations and local explorations. And, as we noted in Figure 2-11, these two dimensions are not binary but rather exist on a spectrum. Our goal in introducing this framework is not to encourage you to pin down exactly where you are or introduce more bureaucracy into your design process. Instead, we believe that giving you a framework to think about the type of problem you’re trying to solve is essential for two reasons:
It forces you to take the time to consider the space of other possible design activities you could be working on, and confirm for yourself and with your team that you’re focusing your efforts on the right scope and problem.
Different spaces in the design activity landscape leverage data in different ways, and by being thoughtful about your specific problem space you can be more effective in how you design your A/B test (or other research methodology).
[4] Nielson Norman Group (NNG). Note that this statistic depends on some assumptions, including the homogeneity of your sample and the base rate of the usability issues in the population. The number of users needed to detect 85% of problems may vary. It is worth reading the source research to understand the assumptions made in this figure.
[5] Experiment!: Website conversion rate optimization with A/B and multivariate testing (New Riders).
[8] https://engineering.linkedin.com/ab-testing/introduction-technical-paper-linkedins-ab-testing-platform/
[11] http://www.graphpad.com/www/data-analysis-resource-center/blog/statistical-significance-defined-using-the-five-sigma-standard/
[12] Karl Popper, The Logic of Scientific Discovery (http://strangebeautiful.com/other-texts/popper-logic-scientific-discovery.pdf).