CHAPTER 2
The Historical Performance of US Middle Market Direct Loans
THE CLIFFWATER DIRECT LENDING INDEX (CDLI)
Most asset classes become institutionalized only after a long maturation period that permits discovery of both return and risk. That discovery process also involves the establishment of a database of unbiased information on the asset. For example, the Center for Research in Security Prices (CRSP) database served that early role in the study of stock performance, as did the Capital International database for international stocks, and the Salomon Brothers database for corporate bonds.
A major challenge for investors considering US middle market direct lending has been the lack of data upon which to understand long‐term return and risk. Commercial bank C&I loans or direct loans held by insurance companies might be valuable sources of information, but these records are proprietary and not kept in a form that is conducive to the rigorous performance analysis available for other asset classes. As a result, investors who have engaged in direct lending have relied primarily upon the attractive yields available on current private corporate loans and the performance records of a few asset managers who have engaged in middle market direct lending over an extended period of time. Currently investors might collect and compare the performance records of direct lending managers, but these records suffer from being self‐reported, with inconsistencies in loan valuation, asset quality, use of leverage, and time period.
Fortunately, a significant and growing segment of the direct lending market consists of loans originated and held by business development companies (BDCs), where quarterly Securities and Exchange Commission (SEC) disclosures provide a vast amount of loan (asset) information, including listings of individual loans and quarterly valuations conducted by independent valuation firms. The information provided is comprehensive enough to calculate quarterly performance measures for direct loans that include income return, price return, and total return. It is from these SEC disclosures that a corporate direct loan database has been constructed by Cliffwater LLC, together with a performance index called the Cliffwater Direct Lending Index (CDLI). As of December 31, 2017, the CDLI represented over $91 billion in direct loan assets covering over 6,000 loans from 74 individual public and private BDCs managed by the largest direct lending asset managers.
The loans captured by the direct loan database and the Cliffwater Direct Lending Index are a significant subset of the direct lending universe (∼25%),1 and importantly, represent loans that are originated and held to maximize risk‐adjusted return to shareholders/investors.
The items below describe the construction of the Cliffwater Direct Lending Index:
- Index base date. September 30, 2004.
- Index launch date. September 30, 2015.
- Data universe. All underlying assets held by private and public BDCs that satisfy certain eligibility requirements.
- Index reporting cycle. All index returns and characteristics are reported with a 2.5‐month lag to allow sufficient time for release of SEC filings.
- BDC eligibility.
- SEC regulated as a BDC under the Investment Company Act of 1940.
- At least 75% of total assets represented by direct loans as of the calendar quarter‐end.
- Release SEC 10‐K and 10‐Q filings within 75 calendar days following the calendar quarter‐end.
- Eligibility reviewed at quarterly eligibility dates (75 calendar days following the calendar quarter‐end).
- Weighting. Asset‐weighted by reported fair value.
- Rebalancing. As of calendar quarter‐end.
- Reported quarterly index characteristics. Total asset return, income return, realized gains (losses), unrealized gains (losses), and total assets.
- Location. www.cliffwaterdirectlendingindex.com.
The CDLI is consistent with other private‐asset indices in its quarterly reporting cycle, fair value asset valuation, and asset weighting. The loans are valued quarterly following SFAS 157 guidance. Returns are unlevered and gross of both management and administrative fees.
US MIDDLE MARKET DIRECT LOAN PERFORMANCE
Exhibit 2.1 provides CDLI returns from its September 30, 2004 inception through December 31, 2017. All returns are based upon quarterly data and are gross of fees and expenses.
EXHIBIT 2.1 Cliffwater Direct Lending Index performance.
| Trailing periods ending December 31, 2017 | ||||||||
| Q4 2017 (%) | Past four quarters (%) | Past five years (%)a | Past 10 years (%)a | Sep 2004 inception (%)a | ||||
| Income | 2.52 | 10.16 | 10.81 | 11.52 | 11.15 | |||
| plus | Net realized gains (losses) | −0.44 | −1.75 | −0.81 | −1.71 | −1.05 | ||
| plus | Net unrealized gains (losses) | −0.05 | 0.33 | −0.40 | −0.46 | −0.33 | ||
| equals | Total returnb | 2.02 | 8.62 | 9.50 | 9.21 | 9.70 | ||
aAnnualized return.
bReturn subcomponents may not add exactly to total return due to compounding effects.
Theoretically, the CDLI is investable indirectly through public or private BDC share purchases. However, the primary CDLI return series excludes the application of leverage and imposition of fees, both management and administrative, which for some institutional investors can be negotiated based upon objectives and size of investment. The CDLI return series should be useful to potential investors as a building block upon which to customize returns series for expected fees and desired leverage. Later in this chapter are pro forma, net‐of‐fee returns using the CDLI return series and leverage.
Importantly, SEC filing and transparency requirements eliminate common biases of survivorship and self‐selection found in other industry universe and index benchmarks. And finally, loan assets in the CDLI are managed for total return largely by independent asset managers, unlike similar assets within insurance companies where statutory and other regulatory requirements can result in non‐performance objectives.
Total returns are divided into the three major components investors use to assess performance for credit‐driven securities: income, unrealized gains (losses), and realized gains (losses). Income return is comprised of contractual interest payments and, to a lesser degree, price discounts direct lenders might receive when they originate loans. Unrealized gains (losses) represent changes in loan values, as determined by valuation agents, and are generally a reflection of movement in overall market spreads or change in assessment of specific loan credit risk, akin to a loan‐loss reserve. Finally, realized (gains) losses are predominately losses and are the product of loan‐specific defaults and recoveries, which result in a write‐down of loan principal.
Exhibit 2.2 plots the performance of the Cliffwater Direct Lending Index and its components. Visualizing performance in this way helps understanding what generates return and what detracts from performance over time.
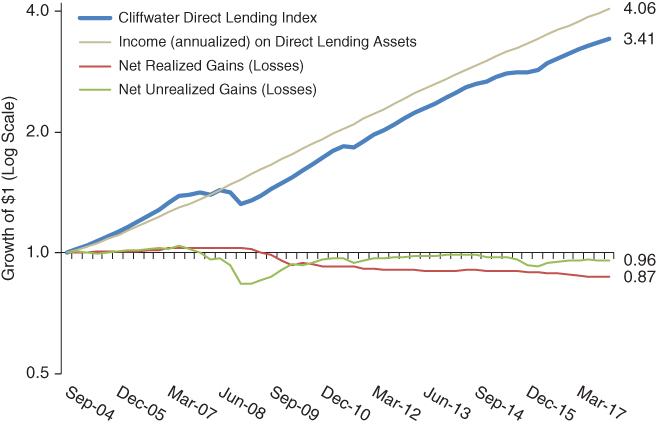
EXHIBIT 2.2 Components of direct lending returns, September 2004 to December 2017.
The heavy line in Exhibit 2.2 plots the cumulative (growth of $1.00) CDLI return, consisting of gross yield (top diagonal line) plus net realized gains/losses and plus net unrealized gains/losses. The vertical axis uses a log scale. A log scale is useful for plotting cumulative returns over long periods of time because a constant rate of return produces a straight line. For example, the CDLI income return over the 13.25‐year period appears as a straight line. This suggests that direct lending income (yield) has remained relatively constant over the period. Casual inspection also shows that direct lending income return drives total return over time, reduced periodically by net realized and unrealized losses. For the entire CDLI history, the direct loans in the Index returned 9.70%, annualized, with current income equal to 11.15%, unrealized losses equal to −0.33%, and realized losses equal to −1.05%. These returns are consistent with the investment thesis underlying most fixed income strategies that investors should try to maximize yield while minimizing losses (realized and unrealized) in principal.
YIELD ON DIRECT LOANS
Exhibit 2.3 shows the rolling, four‐quarter income return (yield) on direct CDLI loan assets. From 2004, income has been fairly stable within the US middle market, with income ranging roughly between 10 and 12% and averaging 11.15%. Higher income is associated with periods of recession while lower income is associated with periods of economic expansion.

EXHIBIT 2.3 Direct loan income as percent of loan asset value, rolling four quarters.
With direct loans, not all income is traditional interest income. Asset managers that originate corporate direct loans also receive fees for arranging and servicing the loans. These fees come in the form of discounts at origination. A typical example might be a loan origination where the lender is due $100 par value at maturity in five years but provides the borrower only $98 in financing. The lender receives a 2% discount for arranging the loan. Principal value remains at $100 while net asset value at origination is set at $98. Accounting treatment for the $2 discount, called the original issue discount (OID), can vary, with some reporting OID as income at origination and others amortizing it over the life of the loan. Understanding the accounting treatment of OID can be important because income can appear to spike during periods of high origination or prepayments.
OID‐income generation for direct loans can be measured from the Statement of Cash Flows in the BDC quarterly SEC filings by looking at amortization of discounts. Over the past five years, during which current CDLI total income return averaged 10.69%, OID contributed 0.36% (36 basis points) per year. With direct loans averaging a five‐year maturity at origination, the 0.36% annual amortized OID yield would be equivalent to a 1.8% price discount to principal value at origination.
Another, less well understood source of income is payment‐in‐kind (PIK) income. Instead of quarterly cash interest income, PIK income represents a non‐cash increase in principal. PIK income is generally associated with subordinated debt or lower quality borrowers that may have limited free cash flow in the short term. PIK income is also reported in the Statement of Cash Flows in quarterly SEC filings. Over the last five years during which current CDLI total income return averaged 10.69%, PIK income contributed 0.41% (41 basis points) per year. In the case of senior loans, the CDLI database reports only six basis points in annualized PIK income over the last five years. Consequently, the higher yields reported for some direct loan strategies may be of lower quality because some fraction is in the form of non‐cash income.
NET GAINS (LOSSES)
While the CDLI income return component largely drives long‐term total return, net gains (losses) can significantly impact returns over shorter time periods and can be very important in differentiating individual manager (lender) performance.
Net gains (losses) are defined as the periodic change in loan valuation. It is the equivalent of a price change for traded securities. Net gains (losses) are frequently divided into two components, realized and unrealized.
Realized gains (losses) represent the component of valuation change that reflects completed transactions. In the case of a portfolio of loans, such as the CDLI, realized gains (losses) mostly come in the form of realized losses generated by write‐downs of loan principal that result from borrower default. The amount of the write‐down depends upon the value of the post‐default collateral or new principal amount.
Unrealized gains (losses) represent the component of valuation change that is sourced by a change in market price or, in the case of a portfolio of loans, such as the CDLI, a change in fair value not attributable to a transaction.2
It is instructive to review the mechanisms by which gains and losses for direct loans typically are generated, as well as the linkage between realized and unrealized gains and losses.
- Loan values are established quarterly based upon a fair value assessment as to what the loan is worth. Fair value takes account of the probability and size of future loan impairments based upon individual loan circumstances.
- Price changes in the broader, traded credit markets, including high‐yield bonds and bank loans, help guide expectations for future loan impairments and fair values.
- Quarterly changes in fair value create unrealized net gains (losses) that cause fair value to differ from cost (par) value. Most likely, fair value will be below cost value to reflect some probability of impairment.3
- Unrealized losses from reductions in fair value usually occur in advance of actual loan impairments as the certainty of loss increases as default approaches.
- A subsequent default event triggers a realized loss that is a permanent reduction in the cost (par) value of the loan.
- The realized loss (from a default or restructuring) replaces the existing unrealized loss through an offsetting unrealized gain. The new unrealized gain equals the prior unrealized loan loss if the default event and realized loss was correctly anticipated.
- Over time, investors observe a build‐up in net realized losses, as defaults accumulate. These realized losses are comparable to loss rates4 reported by rating agencies and banks for high‐yield bonds and bank loans.
- Unrealized losses will generally build in the early stages of a credit downturn and reverse in the later stages as realized losses from defaults replace them.
This background should help put the realized losses and unrealized gains reported for the CDLI over the quarter and trailing year in better context.
NET REALIZED GAINS (LOSSES)
Exhibit 2.4 shows rolling four quarters and cumulative realized gains (losses) for all direct CDLI loans. Unlike current income, realized gains (losses) for direct loans are not consistent and positive but episodic and mostly negative, corresponding (with some lag) to the general US business cycle or industry specific events. For the entire 13.25‐year period, cumulative realized losses equaled −13.07%, or − 1.05% annualized.
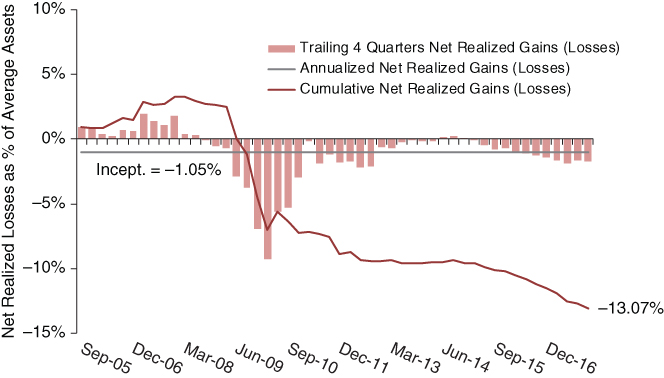
EXHIBIT 2.4 Net realized gains (losses) as a percentage of loan assets, rolling four quarters and cumulative returns.
Direct loans in the CDLI experienced modest realized gains over the period prior to the 2008 global financial crisis (GFC). These gains were largely associated with equity and warrants that sometimes come with direct loans, particularly pre‐2008 when most direct loans were subordinated and had lower yields, but came with more equity participation. This was also a period following the 2000–2002 recession where the equity markets were experiencing a sharp rebound. In the current direct lending environment, where lending is senior in orientation with little equity participation, the occurrence of net realized gains for direct lending generally would be very unlikely.
The second period covering the GFC is of great interest because it is a period that investors now use to stress test different asset classes. Also, because direct lending is a newer asset class, it is the only time period that can be used to study likely maximum‐loss scenarios.
Cumulative realized losses for direct loans caused by the GFC totaled −10.20%, covering the years 2008–2010. Realized losses are not confined to 2008 because defaults in 2009 and 2010 likely resulted from the economic recession that began in 2008 and extended through June 2009.
The third period extends from 2011 to 2015 when realized losses continued to ebb, with the final three years, 2013–2015, reflecting an unusual period of almost no realized losses. But for the Euro crisis during this period, it was marked by a slow but steady US business expansion and a climbing stock market.
The final, fourth period begins in 2016, with the oil crisis and a continuing period of retail disruption. Realized losses have been slightly above the historical average and only recently have begun to slow again, with the pick‐up in the economy in 2017 and into 2018.
A look at the CDLI data shows that realized losses from defaults come in waves. Unlike the steady source of income from direct loans, credit losses are episodic and appear highly correlated with the business cycle. The unfortunate news is that turns in the business cycle are almost impossible to predict. There are two ways to reduce realized losses. The first is to invest in senior loans, but the cost of that strategy is lower yield, which may be greater than the higher realized losses the investor would otherwise incur. The second method is to select a skilled lender (asset manager) who has strong underwriting capabilities and can sense when market risk may be higher or lower and adjust strategy appropriately. There is evidence that credit underwriting skill persists, which is covered in Chapter 12.
NET UNREALIZED GAINS (LOSSES)
Unrealized gains (losses) measure changes in loan asset value that come about not by actual transactions or permanent write‐downs, but by changes in the value of loans given by a market or third‐party valuation agent. Since middle market direct loans are seldom traded and instead held to maturity, periodic changes in loan value that create unrealized gains (losses) are determined by the lender itself or third‐party valuation agents. This type of valuation is referred to in accounting as “fair value” and guidance for determining fair value is given by accounting standard FAS 157.
FAS 157 places assets for valuation purposes into levels 1, 2, and 3. Level 1 assets are exchange traded where a market price is available at the end of each day. Public stocks are an example. Level 2 assets are traded through broker/dealer markets with prices determined when a transaction occurs or when a price (broker quote) is requested. Level 3 assets are valued based upon the lender's valuation policy that incorporates quantitative models and qualitative insight in determining fair value for each loan. These lender valuations incorporate overall market credit spreads and loan‐specific credit outlooks. In fact, in their quarterly reporting most BDCs provide an assessment of creditworthiness by categorizing loans into varying default risk categories. Most direct loans are level 3 assets.
Valuation involving level 3 assets, such as direct loans, is most often performed quarterly. Changes in valuation give rise to quarterly unrealized gains (losses) that theoretically harbinger expected but uncertain future credit losses. Unrealized losses for direct loans can be viewed in the same way that banks create and periodically change reserves against future realized losses from loan defaults.
The practice of pricing through lender valuations versus independent third‐party valuations varies and often depends upon the needs of investors. A best practice is to have all loans valued quarterly by third‐party valuation firms. But this can be expensive and unnecessary if the information generated has little use, as it would in a private fund or partnership that does not trade, or if its investors are captive. More likely, fair value is determined only once a year by a third‐party valuation firm, either by valuation of all loans once a year or valuing one quarter of the portfolio every fiscal quarter. At those times loans are not being independently valued, the lender itself is valuing the loans based upon methodologies like what the third‐party valuation firm would otherwise use.
Exhibit 2.5 shows rolling four quarters and cumulative unrealized gains (losses) for all direct loans in the Cliffwater Direct Lending Index.

EXHIBIT 2.5 Net unrealized gains (losses) as a percentage of loan assets, rolling four quarters and cumulative returns.
Long‐term, cumulative returns for unrealized gains (losses) should average close to 0% because, as discussed earlier, unrealized losses will either convert to net realized losses upon a credit default, or they will be reversed when principal is fully repaid. The cumulative net unrealized gain (loss) line in Exhibit 2.5 is consistent with this expectation.
For example, unrealized losses expanded in 2007–2008 and again in 2013–2014, anticipating rising realized losses ahead. When loans are subsequently written down it creates a realized loss but also potentially an unrealized gain if the realized loss was previously anticipated in a prior period by recognizing an unrealized loss. Two accounting entries equal in dollar value, a realized loss plus an unrealized gain, convert an unrealized loss into a realized loss.
TOTAL RETURN
Exhibit 2.6 combines income, realized gains (losses), and unrealized gains (losses) into a single total return. As with the components, total return reported in the exhibit is for rolling four‐quarter periods.

EXHIBIT 2.6 Direct loan total return as a percentage of loan asset value, rolling four‐quarter returns.
The rolling four‐quarter CDLI total returns in Exhibit 2.6 have been high and fairly consistent, averaging 9.70% for the entire 13.25‐year history of the Index. The exception occurred during the GFC when the worse four‐quarter (one‐year) period was calendar 2008 when the CDLI total return equaled −6.50%. Component returns for the same one‐year period were 11.72% (income), −2.89% (realized losses), and −16.25% (unrealized losses).