CHAPTER 12
Business Development Companies
There are two primary vehicles through which direct lending managers offer corporate direct lending to investors, business development companies (BDCs) and private funds. This chapter covers BDCs, a rapidly growing investment vehicle but one still relatively unknown to the broader investing public. The second is the private partnership, a vehicle very familiar to investors in real estate and private equity. BDCs are addressed first because corporate direct lending to some extent had its start with this vehicle and because BDCs are currently undergoing significant positive changes that may make them a preferred vehicle in the future.
WHAT IS A BDC?
While differences exist, business development companies (BDCs) are in many ways like real estate investment trusts (REITs) for real estate, and master limited partnerships (MLPs) for energy assets in their cash generating, tax‐preference investment characteristics that appeal to investors. BDCs were created by Congress in 1980, under Section 54 of the Investment Company Act of 1940, to stimulate private investment in middle market US companies, which had suffered during the stagflation period following the steep 1973–1974 recession. Congress gave the BDC the advantage of electing to be private or exchange‐traded with a tax‐free pass‐through of investment income, but with some restrictions, including:
- SEC registration and oversight.
- At least 70% of assets invested in non‐public debt and equity in US corporations.
- Maximum leverage equal to 2.0x net asset value (NAV), recently increased from 1.0x.
- Annual distribution of at least 90% of income to shareholders.
- Certain portfolio diversification constraints.
Noteworthy is that the BDC is an SEC registered investment company, subject to most of the same requirements of US mutual funds. These requirements include direct SEC oversight that should give BDC investors greater comfort than found with private funds. At the same time, SEC oversight can potentially bring higher costs, less investment flexibility, and unwanted transparency.
It is the requirement that 70% of assets be invested in nonpublic (private) debt and equity of US corporations that define the business of a BDC as making direct loans and providing equity financing. While equity is a permissible investment within the 70% requirement, virtually all BDCs concentrate their corporate financing activity on direct corporate loans.
BDCs had historically been limited in their use of leverage to 1.0x their net asset value (NAV). Expressed another way, BDCs had to maintain assets equal to at least 200% of their borrowings. In a recent major change, the 2018 passage of the Small Business Credit Availability Act allowed BDCs to increase leverage from 1.0x to 2.0x debt‐to‐equity ratio (i.e., maintain assets equal to at least 150% of their borrowings). The change is effective immediately with BDC independent board director approval and shareholder vote. Otherwise, the board can increase leverage after a one‐year cooling off period.
Many BDCs can apply for, create, and invest in small business investment companies (SBICs) where loans are made to smaller companies. BDCs find the SBIC desirable because the SBIC provides low‐cost, long‐term financing at attractive leverage levels with subordination. Further, SBIC financing does not count against BDC debt limitations. However, SBIC financing is limited to $150 million for one fund and $225 million for more than one fund, which ultimately makes this type of financing a small part of the BDCs overall capital structure.
Many BDCs also invest in noncontrol special purpose vehicles (SPVs). These take the form of joint ventures between the BDC and an outside institutional investor such as an insurance company or pension plan. Loans made by the SPV must be approved by both JV partners. The attractiveness of SPVs is that they can use financing that, like the SBIC, does not count against the borrowing limitations of the BDC. The limitation on SPVs is that they do not qualify for the 70% investment requirement in US corporations.
There are several operational requirements for running a BDC as a registered investment company. These include:
- An independent board of directors.
- A CEO, CFO, and chief compliance officer (CCO).
- Independent legal counsel, administration, audit, and Sarbanes–Oxley (SOX) compliance.
- Quarterly 10‐K/Qs, board meetings, annual investment management agreement approvals, 8‐Ks, and proxy statements.
- Quarterly fair value loan and portfolio marks determined by independent valuation firms and asset management and overseen by the BDC board.
BDCs elect to be treated as a regulated investment company (RIC) under Subchapter M of the 1986 Internal Revenue Code so that investment earnings pass through to investors without tax. However, to qualify as a RIC the BDC must also:
- At least 90% of gross income must be from interest, dividends, and realized gains of securities.
- Pass a quarterly asset diversification test.
- Distribute greater than 90% of taxable income, equal to ordinary income plus short‐term capital gains.
The 90% requirement that BDC income come from interest, dividends, and realized gains of securities means that BDCs do not generate unrelated business taxable income (UBTI). The absence of UBTI in BDCs is important and desirable to private institutional investors like endowments, foundations, and private pension plans who do not want to pay taxes on private investments and instead go to offshore vehicles that may limit the types of investments that can be held. The BDC cleanses UBTI for these investors.
BDCs also present tax advantages for non‐US investors because they do not generate effectively connected income (ECI), which represents income generated in the United States. The presence of ECI potentially creates a tax liability or tax withholding for the non‐US investor operating in the United States. Nor is the non‐US investor required to file a US tax return from a BDC investment. Consequently, an increased number of foreign institutional investors are looking at BDCs as a structure within which to invest in direct lending.
The diversification test requires that at least 50% of the value of their assets consists of cash, cash items, US government securities, securities of other regulated investment companies, and other securities if such other securities of any one issuer do not represent more than 5% of their assets or more than 10% of the outstanding voting securities of the issuer. Also required is that no more than 25% of the value of their assets is invested in the securities (other than US government securities or securities of other regulated investment companies) of any one issuer or of two or more issuers that are controlled (as determined under applicable Internal Revenue Code rules) by the BDC and are engaged in the same or similar or related trades or businesses (the Diversification Tests). These diversification tests are important but generally BDC portfolios are well within the requirements.
BDCs can be internally or externally managed, though all but a few are externally managed by independent asset management firms. When externally managed, there is an investment management agreement between the BDC and the external asset manager that is approved by the BDC board annually. Annual contract approval is an SEC regulatory requirement that also applies to all registered mutual funds.
Most asset managers operating BDCs also offer private direct lending funds, in the form of private partnerships, to institutional investors. The SEC prohibits registered vehicles (like BDCs) and private funds from co‐investing in the same securities, under Rule 17d. This means that a loan originated by the asset manager cannot be divided into participations across the manager's client accounts, that include the registered vehicle (the BDC), without SEC permission. Consequently, almost all managers that operate BDCs request and are granted 17d exemptive relief from the SEC. The purpose of 17d is to prevent managers from cherry‐picking securities, good or bad, to put in a registered vehicle.
The 17d exemptive relief also means that BDC loan assets will look very much like the assets found in BDC managers' private fund offerings. This also means that investors can look to the performance of the BDC as indicative of private fund performance. This is important because it suggests that the Cliffwater Direct Lending Index, which is based upon the performance of BDC direct loans, is also representative of the broader US direct lending marketplace.
Unlike REITs, registered vehicles such as mutual funds that invest in BDCs must disclose the fees and expenses of a BDC holding in their own disclosures. This flow‐through is called acquired fund fees and expenses (AFFE) and can materially impact the mutual fund's reported expense ratio. The sensitivity of mutual fund and ETF investors to expense ratios caused index providers to expunge BDCs from their indices in 2014 not for investment purposes, but for the sole reason to reduce their reported expense ratios. Currently, the BDC industry is urging the SEC to reverse or modify its position on AFFE, arguing that BDCs are being unfairly singled out for AFFE disclosure when other asset classes like REITs and MLPs that have management fees and expenses within their structures are not disclosed. Unfortunately, AFFE disclosure limits institutional participation though there are serious efforts to get this SEC administrative rule changed.
Another SEC mutual fund and ETF rule that also applies to BDCs is the 3% Limit. Regulated investment companies cannot own more than 3% of the outstanding shares of a BDC without exemptive relief limiting control. Unfortunately, the 3% Limit which is intended to limit fee pyramiding also severely curtails corporate governance within the BDC industry. As discussed later, there are many poorly managed BDCs that might otherwise be corrected except that activist shareholders are limited from building a stock position in the target BDC beyond 3%. The limit severely curtails the influence an outside shareholder can exert on a poorly managed BDC and allows entrenched asset managers and directors to continue to disadvantage their shareholders. SEC changes to AFFE disclosures and the 3% limit would likely greatly expand and improve the BDC industry through parity in disclosure and a corporate governance solution to poor management.
One positive note on corporate governance is that BDCs are not permitted to issue new stock if the price is trading below NAV, without shareholder approval. Poor performing BDCs almost always trade below NAV, so they are at least restrained from diluting shareholder value by new share issuances. Unfortunately, this is small consolation to investors that have endured weak returns.
A couple of final BDC characteristics are worth noting. First, BDCs must also offer their corporate borrowers significant managerial assistance. Though potentially burdensome, borrowers seldom request such assistance from their direct lenders. Second, BDCs are permitted to charge management fees on gross assets and can charge incentive fees separately on (a) income and (b) net realized capital gains plus unrealized losses. These fee permissions are particularly generous to the BDC asset manager and not something found in institutional offerings of private funds. The separation of incentive fees for income and realized gains, net unrealized losses, does not meet institutional standards. Managers could stretch for yield in their loan originations to maximize the income incentive fee while recognizing that this may increase realized losses over time. Best practice is to combine, not separate the two incentive fees so that the asset manager is incentivized to optimize total return rather than one component. A more complete discussion of fees is found in a later chapter. Finally, BDCs offer investors greater convenience. In most cases there are no capital calls and tax reporting is done through Form 1099 instead of K‐1, which investors complain are often late.
BDC Industry Statistics
Exhibit 12.1 provides summary statistics on the BDC market.
EXHIBIT 12.1 BDC industry statistics at December 31, 2017.
| 74 | # of BDCs with assets > $50 million |
| 27 | # of BDCs with assets > $1 billion |
| 3 | # of BDCs with assets > $5 billion |
| $91b | assets held by all BDCs >$50 million |
| 42 | # of publicly traded BDCs |
| $32b | market capitalization of publicly traded BDCs |
| $55b | assets held by publicly traded BDCs |
| 91% | % of gross BDC investments that are debt related |
| 61% | % of gross BDC investments that are senior secured |
| 10.07% | current gross yield on gross BDC assets |
| 13.57% | current leveraged gross yield on net BDC assets (net of interest costs) |
| 9.12% | dividend yield on Cliffwater BDC Index |
| 1.66% | average management fee on gross BDC assets |
| 0.85% | average incentive fee on gross BDC assets |
| 0.41% | average expenses on gross BDC assets |
| 4.97% | average fees & expenses on net BDC assets (NAV) |
PRIVATE BDCS
BDCs can remain private or choose to be publicly traded on one of the major exchanges. Of the 74 BDCs with assets above $50 million, 41 are publicly traded and 33 are private BDCs. Private and public BDCs combined held $91 billion in direct loan assets at December 31, 2017.
Most, but not all BDCs, choose to raise assets as a private BDC and then become exchange traded through a public offering. Asset managers generally prefer sponsoring a public BDC because it helps them build brand awareness, provides a source of permanent capital, and facilitates growth opportunity through new share offerings if the BDC stock trades above NAV. Investors also seem to prefer public BDCs because they provide ongoing liquidity and are generally larger, providing better direct loan diversification.
A popular strategy after the global financial crisis (GFC) has been for an asset manager to launch a private BDC, sell shares in a private offering, and then go public later. Sometimes the asset manager will offer lower fees to investors in the private BDC to encourage commitments by larger institutional investors. At IPO, those asset management fees increase but the institutional investor has the opportunity then to sell its shares.
These institutional investors also have a reasonable expectation that they can sell their shares at a premium to NAV when the BDC goes public. For example, since the GFC, BDCs with strong asset management backing have had their shares trade at a 10–30% premium to NAV. Investors could earn an 8–10% dividend through interest income while the BDC is in the private phase and earn an additional premium of 10–30% at IPO. It generally takes the private BDC about three to four years to be fully ramped to scale before being ready to IPO. Current yield plus the IPO premium together might provide a total return expectation of between 10% and 20%.
Two recent examples of public BDCs that followed the path from private BDC to public BDC with a significant premium at IPO were TPG (ticker: TSLX) and Goldman Sachs (ticker: GSBD). TPG Specialty Lending, Inc. was organized as a private BDC in December 2010. It concurrently raised capital through a private offering of its shares to institutional investors and called committed capital as it made direct loans. Large institutional backing came from pension funds of the States of New Jersey, Oregon, Ohio, and Arizona as well as the high‐net‐worth arm of Morgan Stanley. Private BDCs that intend to go public generally want to build a retail investor base, like that brought by Morgan Stanley, that will provide greater liquidity upon IPO and will be a more representative shareholder base post‐IPO. In its private offering TPG Specialty Lending agreed to go public within four years or gradually liquidate the BDC loan holdings as they matured. The BDC went public in an IPO after four years in March 2014, traded at an early 20–30% premium to NAV and has since averaged an approximate 15% premium. During its private phase the BDC earned an 11.66% net annualized return for its shareholders. The IPO would have increased the annualized return to private shareholders from 11.66% to a range of 16–19% depending upon when the shareholder sold shares in 2014.
Goldman Sachs BDC, Inc. followed a similar path as TPG Specialty Lending but two years later. Their private BDC was launched in 2013 and the BDC conducted an IPO in May 2015. It initially traded at a 10–20% premium to NAV and has since averaged an approximate 15% premium.
Several of the 33 private BDCs are following similar strategies as TPG and Goldman Sachs. Private BDCs managed by Golub Capital, Crescent Capital, TCW, and Owl Rock will likely conduct IPOs over the next few years.
Exhibit 12.2 provides a listing of all private BDCs with assets above $50 million.
EXHIBIT 12.2 Private, nonlisted business development companies at December 31, 2017.
| Business Development Corporation (SEC code, Name) | Assets in $ Thousands |
| 1490927: Business Development Co of America (Benefit Street) | $2,652,514 |
| 1501729: Franklin Square Energy (GSO) | 4,316,431 |
| 1523526: Sierra Income Corp (Medley) | 1,187,953 |
| 1525759: Franklin Square II (GSO) | 5,110,081 |
| 1534254: CION (Apollo) | 1,815,923 |
| 1535778: HMS Income Fund (Main Street Capital) | 1,119,062 |
| 1557424: Venture Lending & Leasing 7 (Western Tech) | 336,271 |
| 1579412: Franklin Square III (GSO) | 3,847,280 |
| 1588272: NexPoint Capital | 123,306 |
| 1603480: TCW Direct Lending | 1,655,257 |
| 1617896: Corporate Capital Trust II (KKR) | 175,079 |
| 1618697: Carey Credit Income Fund (Guggenheim) | 400,687 |
| 1627515: Golub Capital Investment Corp | 1,553,536 |
| 1633336: Crescent BDC | 329,817 |
| 1633858: Audax | 214,490 |
| 1634452: AB Private Credit Investors Corp | 48,040 |
| 1637417: Franklin Square IV (GSO) | 376,306 |
| 1642862: Venture Lending & Leasing 8 (Western Tech) | 325,232 |
| 1655050: Bain Capital Specialty Finance (Sankaty) | 988,251 |
| 1655887: Owl Rock Capital Corp II | 110,340 |
| 1655888: Owl Rock Capital Corp | 2,443,547 |
| 1674760: Goldman Sachs Private Middle Market Credit | 895,349 |
| 1683074: Goldman Sachs Middle Market Lending | 532,129 |
| Total | $30,556,880 |
Several managers have more than one private BDC, including Franklin Square, Owl Rock, and Goldman Sachs. These multiple offerings generally have different investment objectives or different shareholder objectives (e.g. to stay private or go public in the future).
PUBLICLY TRADED BDCS
There are 42 publicly traded BDCs with a combined market capitalization equal to $32 billion at December 31, 2017. A listing of those BDCs with market capitalizations over $50 million is shown in Exhibit 12.3.
EXHIBIT 12.3 Publicly traded business development companies at December 31, 2017.
| Publicly Traded BDC | Ticker | Percent of Market Cap |
| Ares Capital | ARCC | 21.43% |
| Prospect Capital | PSEC | 7.18% |
| Main Street Capital | MAIN | 6.95% |
| Corporate Capital Trust, Inc | CCT | 6.74% |
| FS Investment | FSIC | 5.85% |
| TPG Specialty Lending | TSLX | 3.66% |
| Apollo Investment | AINV | 3.64% |
| TCG BDC INC | CGBD | 3.51% |
| Golub Capital | GBDC | 3.37% |
| Hercules Technology | HTGC | 3.31% |
| New Mountain Finance | NMFC | 3.21% |
| Solar Capital | SLRC | 2.70% |
| TCP Capital | TCPC | 2.66% |
| Goldman Sachs BDC | GSBD | 2.43% |
| Oaktree Specialty Lending Co | OCSL | 1.93% |
| Triangle Capital | TCAP | 1.74% |
| Pennant Park Floating Rate | PFLT | 1.63% |
| Pennant Park | PNNT | 1.51% |
| BlackRock | BKCC | 1.44% |
| Fidus Investment | FDUS | 1.00% |
| Capital Southwest | CSWC | 0.86% |
| Solar Senior Capital | SUNS | 0.84% |
| Whitehorse Finance | WHF | 0.83% |
| Monroe Capital | MRCC | 0.82% |
| THL Credit | TCRD | 0.81% |
| Oaktree Strategic Income Co | OCSI | 0.76% |
| Medley Capital | MCC | 0.75% |
| Gladstone Capital | GLAD | 0.73% |
| Triplepoint Venture | TPVG | 0.68% |
| Stellus Capital Inv. | SCM | 0.64% |
| OFS Capital | OFS | 0.45% |
| Garrison Capital | GARS | 0.42% |
| Saratoga Capital | SAR | 0.40% |
| Capitala Finance | CPTA | 0.40% |
| KCAP Financial | KCAP | 0.37% |
| Horizon Tech. Finance | HRZN | 0.37% |
| American Capital Sr. Fl. | ACSF | 0.35% |
| CM Finance | CMFN | 0.34% |
| Great Elm Capital | GECC | 0.31% |
| Alcentra Capital | ABDC | 0.27% |
| 100% |
It is worth noting that some of the largest and highest quality managers operate publicly traded BDCs, including BlackRock, Oaktree, KKR (Corporate Capital Trust), and The Carlyle Group (TCG BDC Inc.). The largest is Ares Capital, which is well known not only for its direct lending to corporations, but also to distressed private funds. It is the largest BDC by far because (i) it was a very early entrant, starting its BDC in 2004, (ii) it has been one of the best performing BDCs since its beginning, and (iii) the Ares BDC has made major acquisitions of troubled BDCs in the past and successfully turned them around. For example, Ares acquired American Capital BDC a year ago and acquired Allied Capital BDC in 2010.
BDC MARKET INDICES
There are two popular indices tracking the public BDC market, the Wells Fargo BDC Index (WFBDC)1 and the Cliffwater BDC Index (CWBDC). Both indices are capitalization‐weighted, but the Wells Fargo BDC Index is float adjusted and mandates that no single BDC can represent more than 10% of the index.
The 10% ceiling on any single BDC causes a major reweighting from traditional capitalization weighting because Ares Capital (ARCC), arguably one of the longest tenured and best performing BDCs, has a 22% weighting by market capitalization but only a 10% weight in the Wells Fargo BDC Index. Such a limitation causes extra turnover in the index and transaction costs, as the Ares excess weighting must be rebalanced quarterly to the other BDCs. The limitation is also contrary to the efficient market hypothesis that market capitalization weighting provides the highest risk‐adjusted return for the average investor. While index providers sometimes argue that limiting an outsized market weighting improves diversification, most (95%) of the benefit of diversification occurs with the first 13 BDC positions and the 21% Ares market weighting does not interfere with achieving a very diversified portfolio. For these reasons the Cliffwater BDC Index is used to provide analysis of the public BDC market. Information on the Cliffwater BDC Index, including a return history back to 2004, can be found at www.bdcs.com.
BDCS – A Tale of Two Markets
The public BDC market is often described as two‐tiered, with a group of strong performing BDCs backed by shareholder‐friendly management teams with large platforms, and another group of weak‐performing BDCs backed by smallish boutique firms whose BDCs are poor performing and who take advantage of their captive shareholders through unnecessarily high fees. While the entire BDC market trades near net asset value, the first group consistently trades at a premium to net asset value, while the second group consistently trades at a discount, sometimes a severe one. As pointed out earlier, the second group likely exists because the 3% limit restricts the corporate governance tools available to shareholders and activists broadly to force changes on management.
BDC DIVIDEND YIELD
Most investors are attracted to public BDCs because of their dividend yields, which represent most of their quarterly earnings from interest income, net of losses and management fees. Exhibit 12.4 provides a history of dividend yield for the Cliffwater BDC Index dating back to its start date in September 2004.

EXHIBIT 12.4 Comparison of Cliffwater BDC Index and five‐year Treasury yields.
Dividend yields were volatile up to and including the GFC period, following a similar pattern for REITs and other higher yielding instruments. Post‐GFC dividend yields on the Cliffwater BDC Index have remained within the 8% to 11% yield range. Most of the fluctuations in dividend yield is not the result of changing underlying loan yields but price fluctuations in BDC shares. Unlike the CDLI, which maintains loan values at NAV, the Cliffwater BDC Index is market‐price based and shares can trade above or below NAV.
Exhibit 12.5 provides the history of price premiums or discounts for the Cliffwater BDC Index price compared to the Cliffwater BDC Index NAV.

EXHIBIT 12.5 Cliffwater BDC index price premium or discount to NAV.
Investors often look at BDC premiums and discounts as an indicator of relative value, choosing to buy at discounts and sell at premiums.
BDC TOTAL RETURN
Exhibit 12.6 reports the cumulative return for the public BDC market using the Cliffwater BDC Index from its inception on September 30, 2004. The more volatile line shows the growth of $1,000 invested through May 25, 2018. The $1,000 would have grown to $2,599 and an annualized return equal to 7.24%, including dividend income.
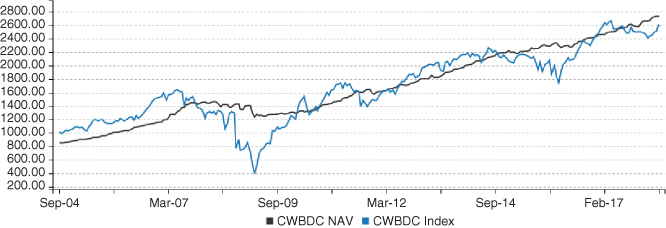
EXHIBIT 12.6 Comparison of market return and net operating return for Cliffwater BDC Index.
The smoother line shows the return on NAV, equivalent to the BDCs return on equity capital. Over the same time, the net operating return for the Cliffwater BDC Index equaled 8.91%, annualized. The difference in operating and market return is because BDCs were trading at almost a 20% premium to NAV in 2004 and a 5% discount in early 2018. The lesson is that shareholder returns do follow BDC fundamentals over time, but market premiums and discounts can impact negatively or positively on performance, particularly over shorter time periods.
Exhibit 12.7 examines just the price component of total return and compares it to net‐asset‐value (NAV). In both cases, interest or dividend income is stripped from the return calculation.
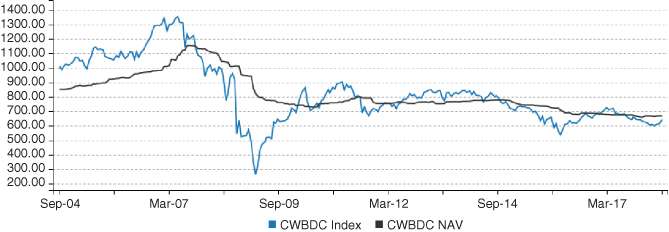
EXHIBIT 12.7 Comparison of price return and NAV return for Cliffwater BDC Index.
The dividend yield for the CWBDC Index has averaged about 10% over its history. However, as Exhibit 12.7 depicts, its net asset value (NAV) has declined, losing value at an annualized rate equal to −1.75%. This rate of loss, when de‐leveraged by the 0.61x historical average leverage ratio for BDCs, gives an equivalent unleveraged realized loss equal to −1.07%, roughly equal to the −1.05% historical realized loss ratio for the Cliffwater Direct Lending Index (see Exhibit 2.1).
Visual inspection of Exhibit 12.7 suggests that BDC premiums and discounts do a pretty good job forecasting net realized and unrealized gains and losses, though they tend to overshoot their target. This might be interpreted an efficient market pricing, as future realized, or unrealized losses are anticipated by market pricing well before they occur in the financial statements. This also suggests that an existing BDC discount may not be a value opportunity but rather an expectation that NAV may decline to meet the discounted price rather than the other way around.