
UNIT 05
SAVING ENERGY: CONSERVE AND PRESERVE
USING ENERGY TO POWER OUR LIVES means we rely on many energy sources to get us through the day. We make choices about how we use energy without thinking much about it. We choose to keep our laptops on and plugged in when they’re not in use, but we might choose to make sure we turn the lights off when we leave a room. Instead of walking, we might drive a short distance to buy a few things, but then we decide to carpool to our soccer game. These choices factor into the total amount of energy we use and have economic and environmental impacts.
When we play a video game, we pay for the electricity that powers our game console. Most of the electricity in North America is generated from nonrenewable energy sources, many of which must be burned to generate steam. This process can release emissions that have environmental impacts.
There are many things we can do to use less energy and to use it more wisely. These actions are called energy conservation and energy efficiency. Energy conservation is an action, behavior, or decision that results in using less energy. Examples of energy conservation include turning the lights off when you leave the room, using public transportation rather than a personal vehicle, and recycling or reusing products. Energy efficiency is the use of a technology or device that helps us to do the same work with less energy. Examples of energy efficiency include replacing old lightbulbs with newer, more efficient bulbs, or buying a more fuel-efficient car with a higher miles-per-gallon (MPG) rating. Energy conservation is easy to practice without much extra cost. Energy-efficient technologies can be flashy and high tech, and they can sometimes be expensive.
You can’t really have efficiency without conservation; they must work together. If you have a fancy hybrid car, but don’t know how to use the energy-saving features, then the car isn’t going to make much of a difference. By thinking about our energy use, measuring and observing our actions, and changing our behaviors, we can make noticeable changes in our personal energy expenses and also preserve our environment. The labs in this unit will give you an opportunity to observe and measure ways that you use energy in your home and day-to-day activities, as well as to identify ways to reduce energy consumption and care for the environment.

What happens when there’s too much carbon dioxide? Find out in Lab 39.
|
INSULATORS TO THE RESCUE! |

Keeping our homes at a comfortable temperature is usually the highest household energy expense. This lab will explore how insulation can help hold temperature in your home.

TIME:
30 minutes
PERSON POWER:
No Sweat!
SAFETY IS KEY:
You will need hot water for this activity. The water does not need to be boiling, just hot. Be careful when heating and transferring water to the cans. Ask an adult for help if needed.
 MATERIALS
→ 5 empty, clean aluminum cans
→ bubble wrap
→ cotton batting
→ polyester batting
→ foam craft sheet
→ masking tape
→ rubber bands
→ hot water
→ saucepan or teapot
→ measuring cup
→ 5 cotton balls
→ digital kitchen thermometer (one is good, but five are better!)
→ timer
→ notebook and pencil
1. Select four of the cans. Wrap one with bubble wrap, one with cotton batting, one with polyester batting, and one with craft foam. Secure the insulation on each with tape and rubber bands (fig. 1). Leave the fifth can unwrapped as your experimental control.
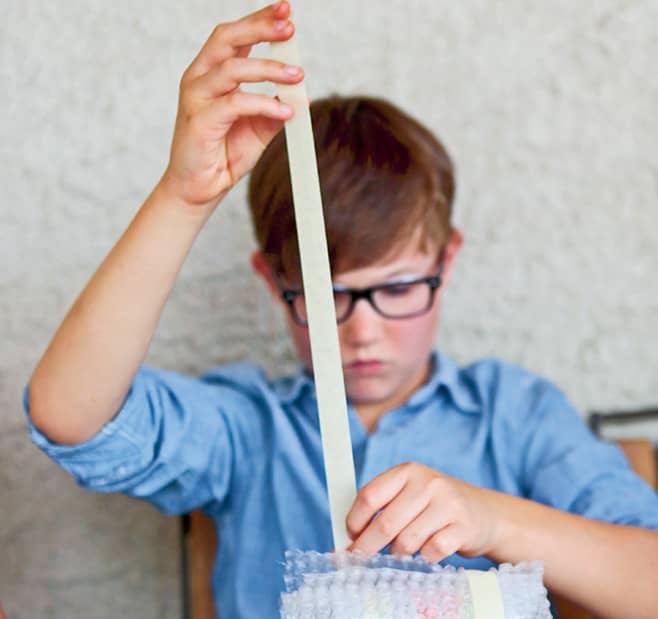
Fig. 1: Wrap the cans to insulate them.
2. Use a measuring cup to fill all five cans with hot water through their top openings (fig. 2). Quickly wedge a cotton ball into each opening to keep air from leaking out.

Fig. 2: Use a measuring cup to fill all five cans.
3. Use the thermometer(s) to take a temperature reading of the water in each can, and then quickly replace the cotton ball. Record the starting temperature of each can (fig. 3). Which one do you think will stay hottest the longest?
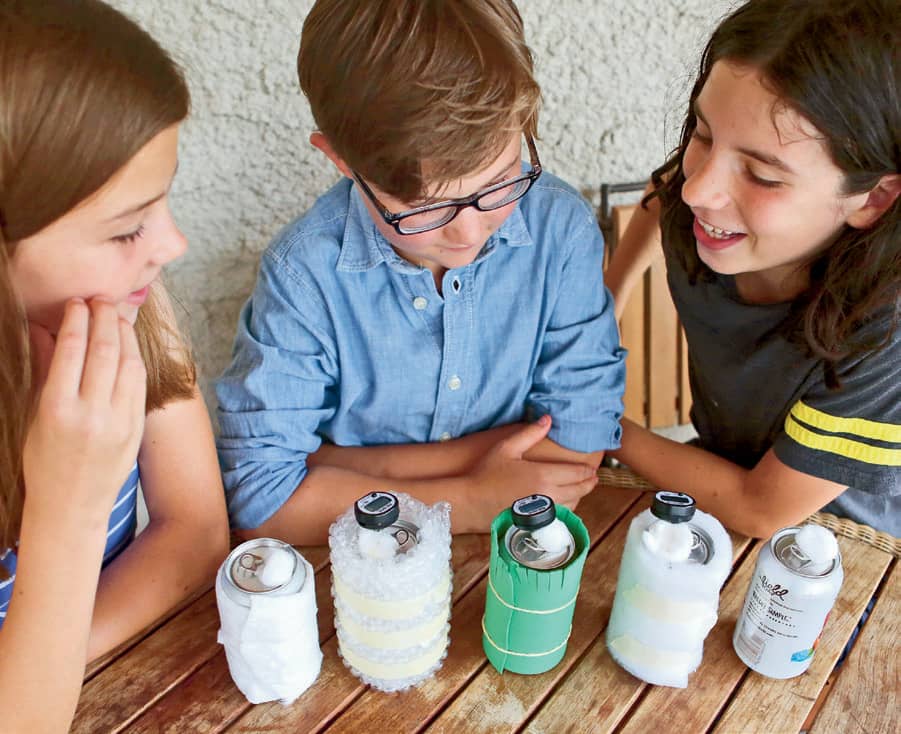
Fig. 3: Record the starting temperature of each can.
4. Set the timer for two minutes. Record the temperature of the water in each can every two minutes for twenty minutes (fig. 4). Which can keeps its temperature the longest? Which is the best insulator and which is the worst? Ask an adult if your home uses insulation and find out where it is.
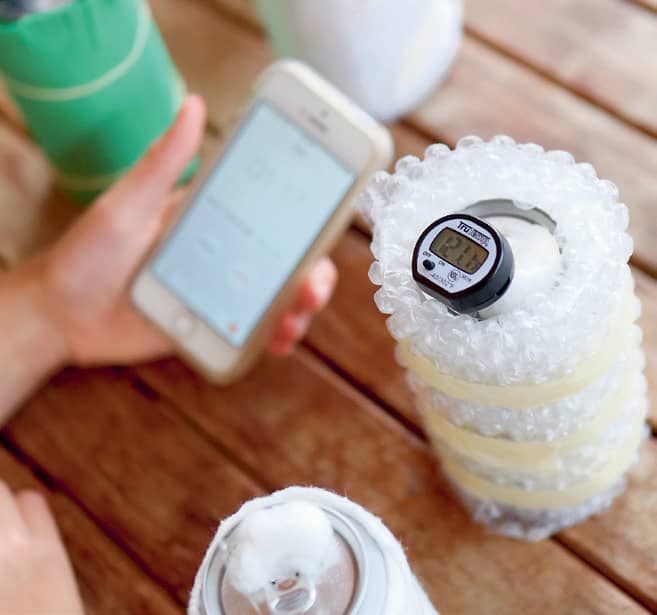
Fig. 4: Record the temperature of the water every two minutes.
5. During the two-minute waits between each reading, you can take the temperature of your home in each room. Doesn’t this require a different type of thermometer? Will it give you an accurate reading in two minutes? Are there some rooms that are warmer or cooler than others? What are some reasons for temperature changes between rooms?

Thermostat Tug of War
Residents in a house often disagree on what is a comfortable temperature. Why not let your bills decide the winner! Did you know that adjusting or programming your thermostat is an easy way to save a little money each month? When you’re not at home during the day, set the temperature lower (in colder weather) or higher (in warmer weather) so your system doesn’t have to work as hard. You can adjust your thermostat back to a comfortable temperature when you return home, or program it so that it’s working upon your arrival. Even an adjustment of 2 to 3 degrees each day can make a difference of 10 percent on your energy bill!
|
DRAFT DETECTIVE |

The air in your home naturally tries to leak out, and fresh air tries to come back in. This can be a problem when we pay to heat or cool the air in our homes to keep us comfy. How does the air get in and out? In this lab, you will explore the places where air might leak with a fun, easy-to-assemble tool! Put on your Sherlock Holmes hat and get ready for detective work!
TIME:
15–20 minutes
PERSON POWER:
No Sweat!
MATERIALS
→ crepe paper or toilet paper
→ scissors
→ ruler
→ pencil, wood dowel, or screwdriver
→ tape
→ electric fan
1. Cut a strip of paper about 2" (5 cm) wide and 3" to 4" (7.5 to 10 cm) long (fig. 1).

Fig. 1: Cut a piece of paper 3" to 4" (7.6 to 10 cm) long.
2. Tape one end of the paper to the end of the pencil, like a streamer with a handle (fig. 2).
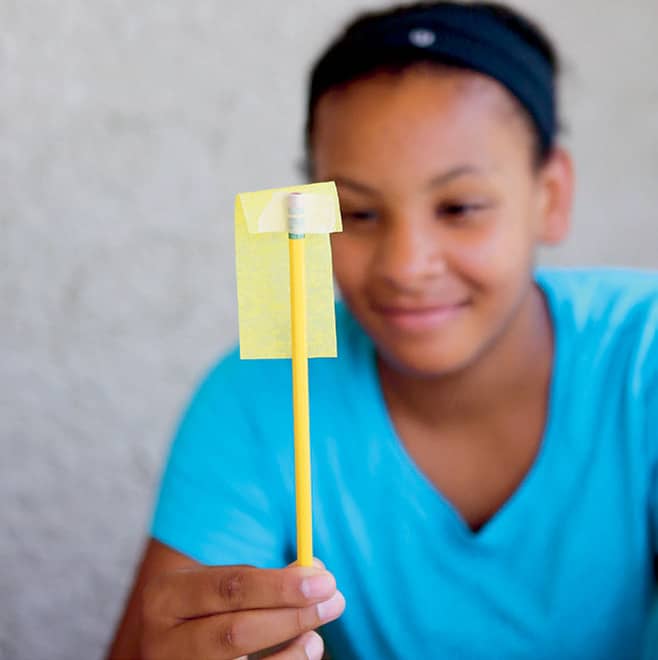
Fig. 2: Tape one end of the paper to the pencil.
3. Start by holding the taped portion of your streamer in front of a fan to watch its movement (fig. 3). If you don’t have a fan handy, blow on it with different amounts of air pressure to make sure it moves and that you can see differences in movement.
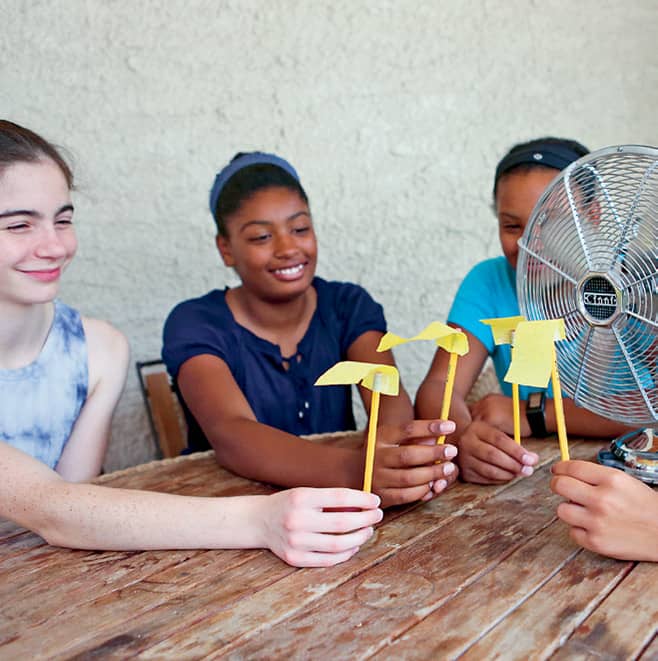
Fig. 3: Hold the streamer in front of a fan.
4. Travel around your home with your streamer and play detective (fig. 4). Hold the streamer up to window seams (bottom, top, and sides), door seams (bottom, top, and sides), and electrical outlet covers (fig. 5). Did you find any locations where you can feel air flowing or see air moving the streamer?
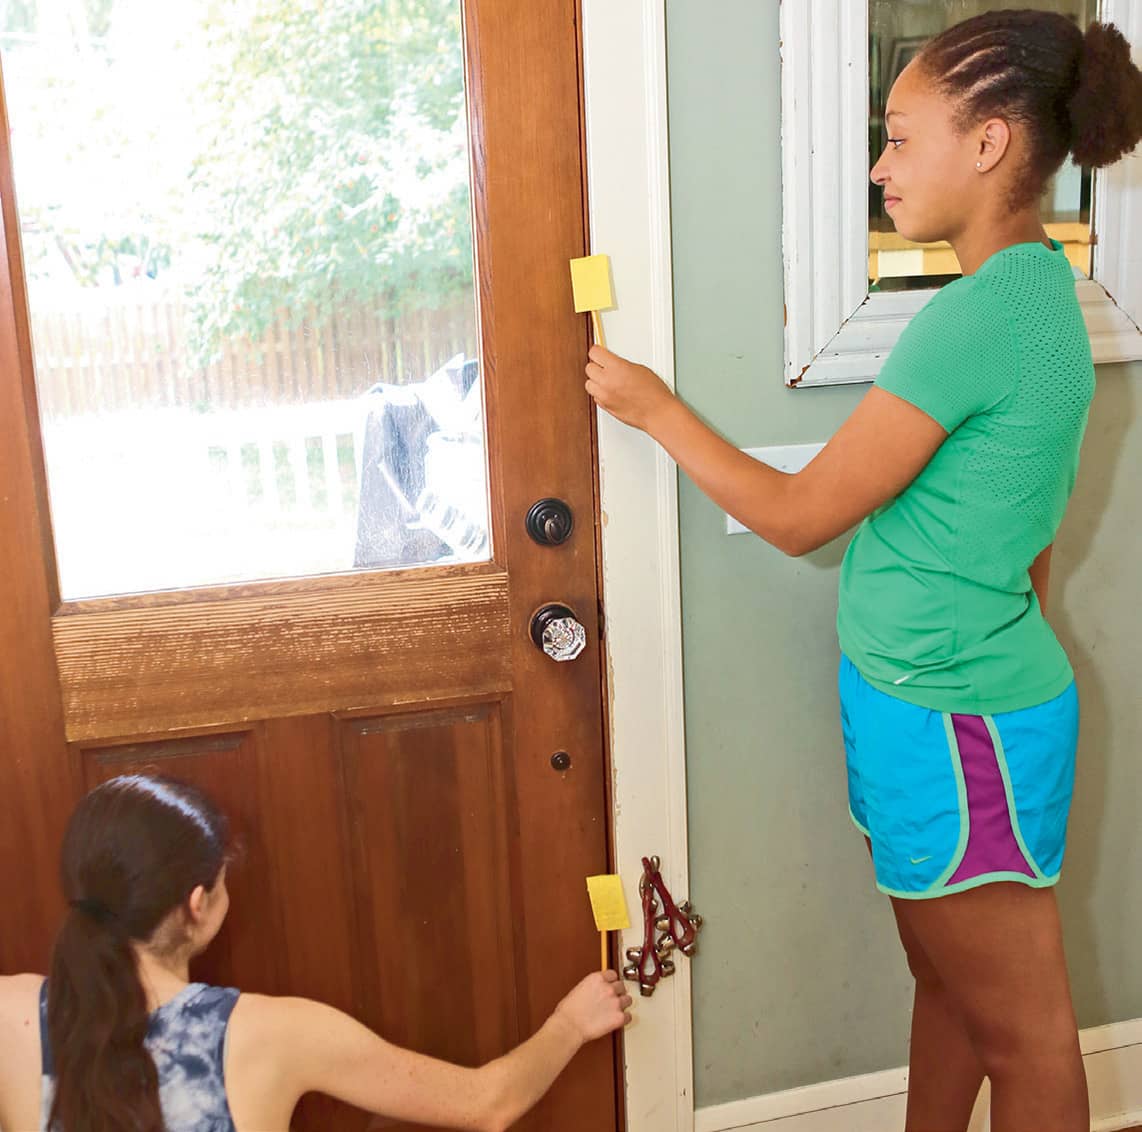
Fig. 4: Play detective in your home with your streamer.
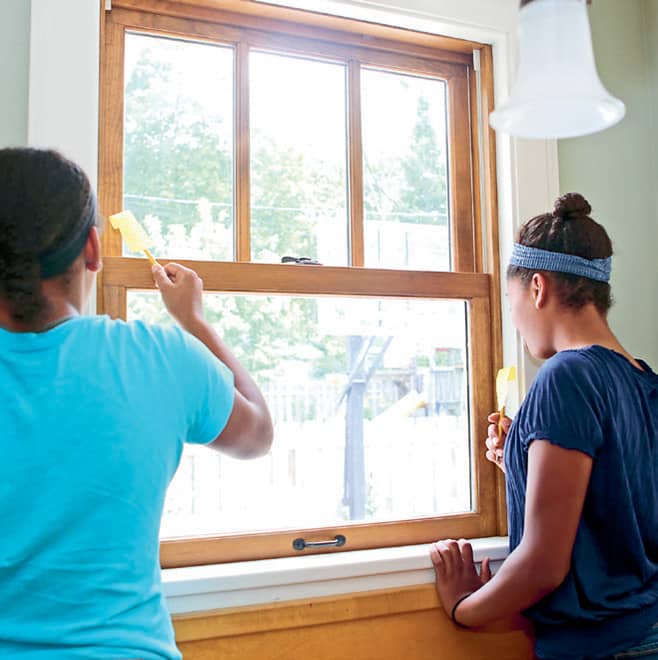
Fig. 5: Hold the streamer up to window and door seams.
Cool Career---Certified Energy Manager (CEM) or Building Analyst (BA)
CEMs and BAs are energy detectives for homes or businesses. They help customers by traveling around, under, above, and into homes to figure out where energy might be wasted. They are specially trained to look for how heat, air, and moisture move through a home and how electrical devices consume energy. CEMs and BAs look for clues by comparing utility bills, inspecting the home with special tools, and taking measurements. They are often able to help a home or business owner save money without spending much money at all!
|
LIGHTEN UP! |

In your home, up to 15 percent of the electricity you use goes to your lightbulbs. Lightbulbs are small, but very important, tools to make your day (and night) productive! There are many different lightbulbs available to use in the home. How are they similar and how are they different? Are some bulbs better energy savers than others? This activity will focus on four basic types of bulbs: incandescent, halogen incandescent, compact fluorescent (CFL), and light emitting diode (LED).
TIME:
30 minutes to an hour
PERSON POWER:
No Sweat! or Grab a Crew Member!
SAFETY IS KEY:
Have an adult present if changing or removing bulbs from their fixtures. Be extra careful because bulbs may be hot. Also, bulbs are made of glass, which can be dangerous if broken. CFL bulbs contain mercury, which can be harmful to the skin and lungs if the bulb is broken.
|
|
|
INCANDESCENT BULB |
Brightness → |
850 lumens |
Life of Bulb → |
1,000 hours |
Energy Use → |
60 watts = 0.06 KW |
Price per Bulb → |
$0.50 |

|
|
|
HALOGEN |
Brightness → |
850 lumens |
Life of Bulb → |
3,000 hours |
Energy Use → |
43 watts = 0.043 KW |
Price per Bulb → |
$3.00 |

|
|
|
COMPACT FLUORESCENT (CFL) |
Brightness → |
850 lumens |
Life of Bulb → |
10,000 hours |
Energy Use → |
13 watts = 0.013 KW |
Price per Bulb → |
$3.00 |

|
|
|
LIGHT EMITTING DIODE (LED) |
Brightness → |
850 lumens |
Life of Bulb → |
25,000 hours |
Energy Use → |
12 watts = 0.012 KW |
Price per Bulb → |
$8.00 |

|
|
|
|
COST OF BULB |
INCANDESCENT BULB |
|
Life of Bulb (how long it will light) |
1,000 hours |
|
Number of Bulbs to Get 25,000 Hours |
|
x |
Price per Bulb |
$0.50 |
= |
Cost of Bulbs for 25,000 Hours of Light |
|
|
COST OF ELECTRICITY |
Incandescent Bulb |
|
Total Hours |
25,000 hours |
x |
Wattage |
60 watts = 0.06 KW |
= |
Total kWh Consumption |
|
x |
Price of Electricity per kWh |
$0.10 |
= |
Cost of Electricity |
|
|
LIFE CYCLE COST |
Incandescent Bulb |
|
Cost of Bulbs |
|
= |
Cost of Electricity |
|
= |
Life Cycle Cost |
|


|
|
|
|
COST OF BULB |
HALOGEN |
|
Life of Bulb (how long it will light) |
3,000 hours |
|
Number of Bulbs to Get 25,000 Hours |
|
x |
Price per Bulb |
$3.00 |
= |
Cost of Bulbs for 25,000 Hours of Light |
|
|
COST OF ELECTRICITY |
Halogen |
|
Total Hours |
25,000 hours |
x |
Wattage |
43 watts = 0.043 KW |
= |
Total kWh Consumption |
|
x |
Price of Electricity per kWh |
$0.10 |
= |
Cost of Electricity |
|
|
LIFE CYCLE COST |
Halogen |
|
Cost of Bulbs |
|
= |
Cost of Electricity |
|
= |
Life Cycle Cost |
|

|
|
|
|
COST OF BULB |
COMPACT FLUORESCENT (CFL) |
|
Life of Bulb (how long it will light) |
10,000 hours |
|
Number of Bulbs to Get 25,000 Hours |
|
x |
Price per Bulb |
$3.00 |
= |
Cost of Bulbs for 25,000 Hours of Light |
|
|
COST OF ELECTRICITY |
Compact Fluorescent (CFL) |
|
Total Hours |
25,000 hours |
x |
Wattage |
13 watts = 0.013 KW |
= |
Total kWh Consumption |
|
x |
Price of Electricity per kWh |
$0.10 |
= |
Cost of Electricity |
|
|
LIFE CYCLE COST |
Compact Fluorescent (CFL) |
|
Cost of Bulbs |
|
= |
Cost of Electricity |
|
= |
Life Cycle Cost |
|

|
|
|
|
COST OF BULB |
LIGHT EMITTING DIODE (LED) |
|
Life of Bulb (how long it will light) |
25,000 hours |
|
Number of Bulbs to Get 25,000 Hours |
|
x |
Price per Bulb |
$8.00 |
= |
Cost of Bulbs for 25,000 Hours of Light |
|
|
COST OF ELECTRICITY |
Light Emitting Diode (LED) |
|
Total Hours |
25,000 hours |
x |
Wattage |
12 watts = 0.012 KW |
= |
Total kWh Consumption |
|
x |
Price of Electricity per kWh |
$0.10 |
= |
Cost of Electricity |
|
|
LIFE CYCLE COST |
Light Emitting Diode (LED) |
|
Cost of Bulbs |
|
= |
Cost of Electricity |
|
= |
Life Cycle Cost |
|

MATERIALS
→ lightbulbs and lamps
→ thermometers
→ calculator
1. Go on a scavenger hunt in your home and around the outside of your home (fig. 1). Take count all the lightbulbs you see.
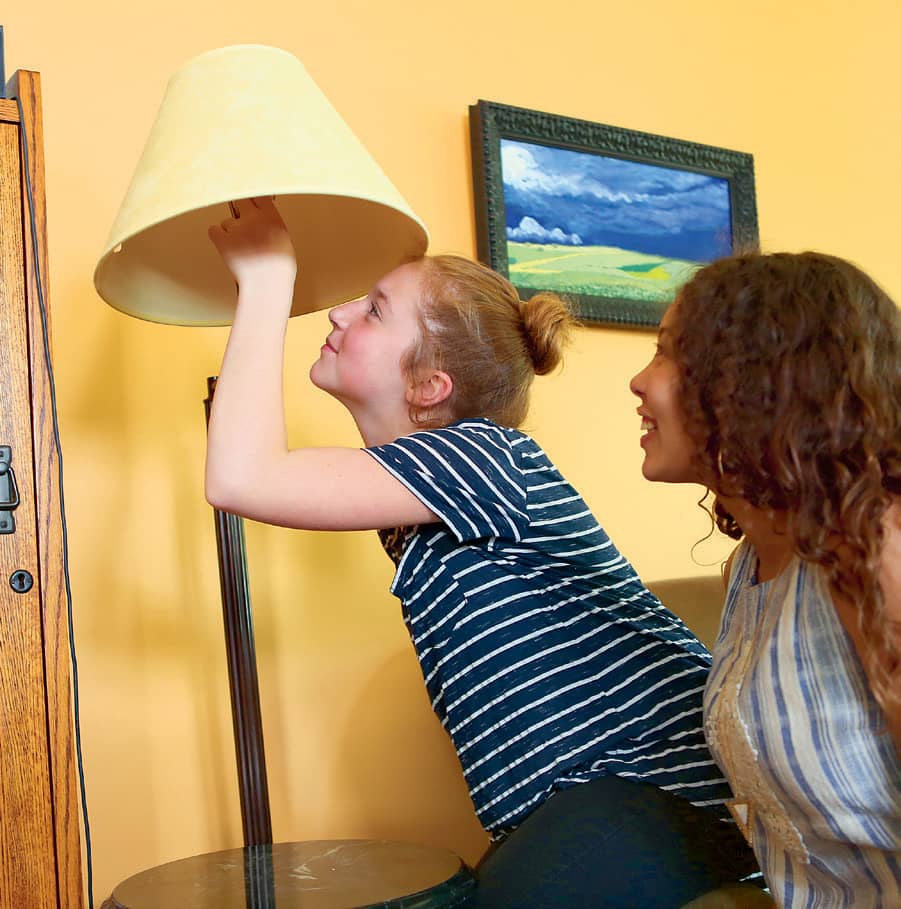
Fig. 1: Go on a lightbulb scavenger hunt in your home.
2. Using the pictures, and the help of an adult, look at the bulbs closely to classify each as incandescent, halogen, CFL, or LED (fig. 2). Which type of bulbs do you use most? Is there a reason some bulbs are used in certain spaces?
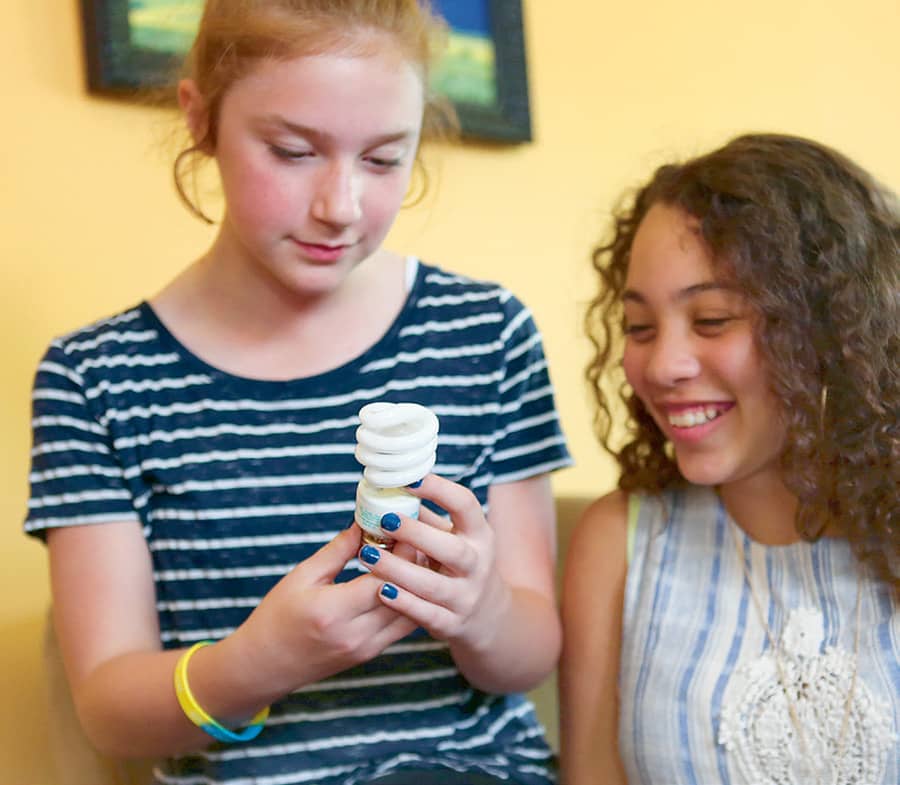
Fig. 2: Classify all the bulbs that you find.
3. Turn on each bulb that you find. Hold or place a thermometer a few centimeters away from it (fig. 3). Does the temperature change for each? Is there a difference in temperature for each type of bulb? Don’t forget to turn off each bulb again!
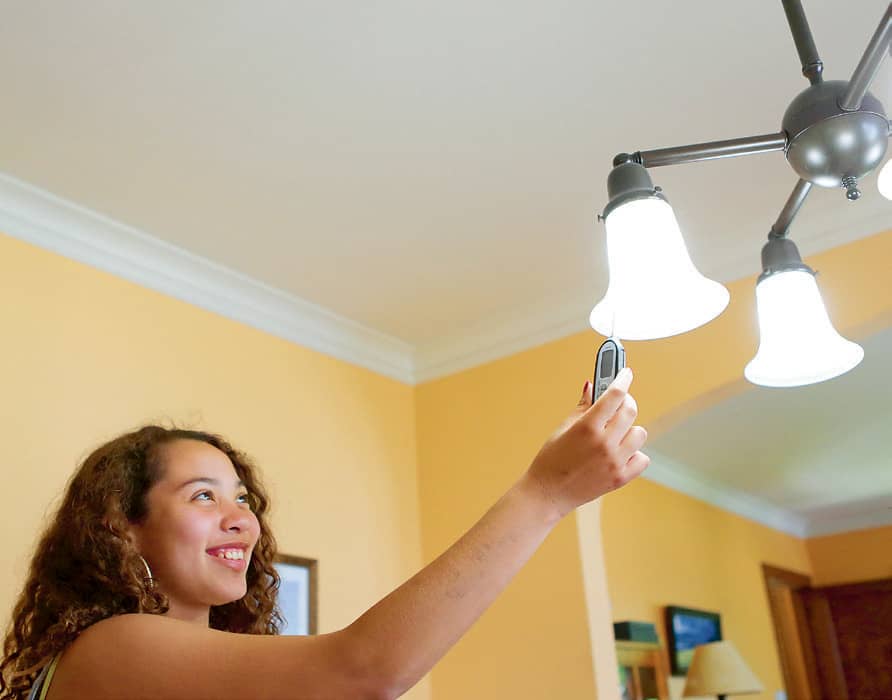
Fig. 3: Hold a thermometer a few centimeters (1 inch) away from each lit bulb.
4. Why do people suggest we switch our light bulbs to be more efficient? Try a comparison activity! One LED bulb can last up to 25,000 hours. The cost to buy the bulb is around $8.00, but we must also pay for the electricity to power the bulb for 25,000 hours. The price of the electricity plus the original price of the bulb is called the life-cycle cost. Complete the calculations in the table shown here to find out the life-cycle cost for each type of bulb. Which is the better buy overall? What happens if the cost of a CFL or LED goes up by $5? What happens if these bulbs become cheaper?
5. How much could you save by switching all the bulbs in one room of your home? Your entire home?
Conductors, Insulators, and SemiConductors…Oh My!
Conductors are materials that allow electricity and thermal energy to move through them. Many metals are good conductors. If they touch something hot, they too become hot.
Insulators are materials that stop the flow of electricity or thermal energy. Rubber is used for the handles of cooking utensils and as the coating for wires because it is a good insulator and doesn’t get hot.
Semiconductors are materials that aren’t really good conductors and aren’t really good insulators, either. But semiconductors are useful because they allow us to direct how electricity moves through the circuit. Semiconductors can make a circuit smaller and more efficient than if a conductor was used. Silicon is an example of a common semiconductor material found in many electronic devices and even LED bulbs.
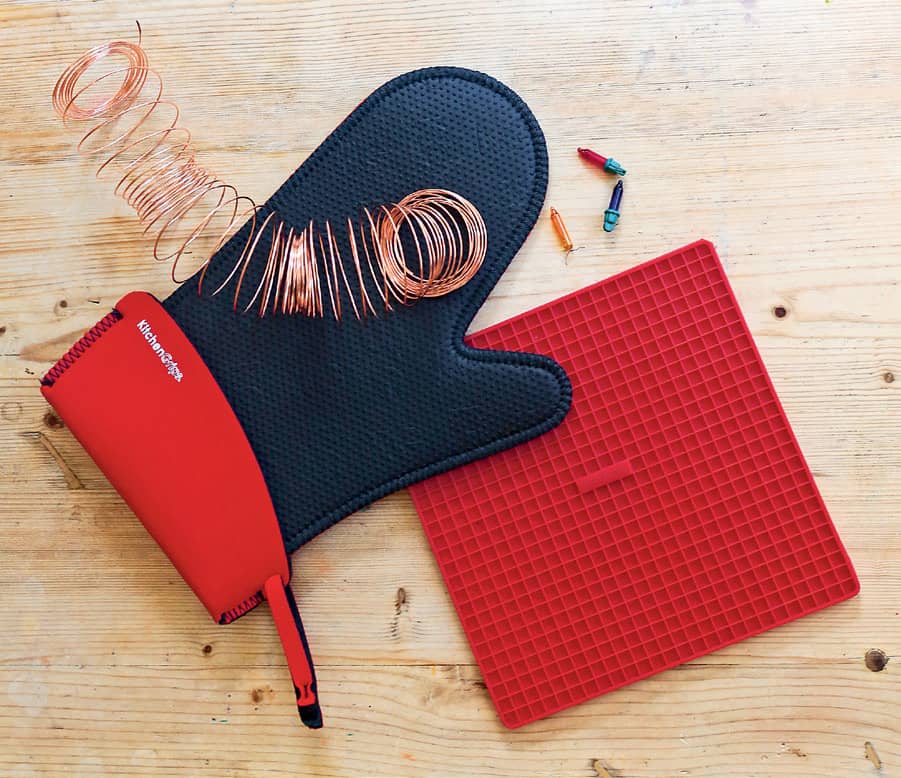
Conductors, insulators, and semiconductors
|
SOLAR WATER HEATER |

Another big expense for homes and businesses is heating water. Every family has that one person who takes long, hot showers! Using less hot water is easy to do, but, if you want to go high efficiency, a solar water heater is a great fix. In this lab, you will explore how a solar water heater can help heat water in a home. Get ready to take in some vitamin D while you wait—you’ll need a sunny day for this lab!
TIME:
30 minutes
PERSON POWER:
No Sweat!
MATERIALS
→ 2 empty soup cans
→ black paint
→ paintbrush
→ water (room temperature)
→ measuring cup
→ 2 digital thermometers
→ notebook and pencil
→ plastic wrap
→ rubber bands
→ timer
1. Remove the labels from the soup cans. Paint one of the cans black and allow it to dry. Leave the other can shiny.
2. Fill both cans with 2/3 cup (158 ml) of water so they are halfway full. Make sure you have the same amount of water in each (fig. 1).

Fig. 1: Fill both cans with water; make sure you have the same amount in each.
3. Take the temperature of the water in both cans and record it (fig. 2).
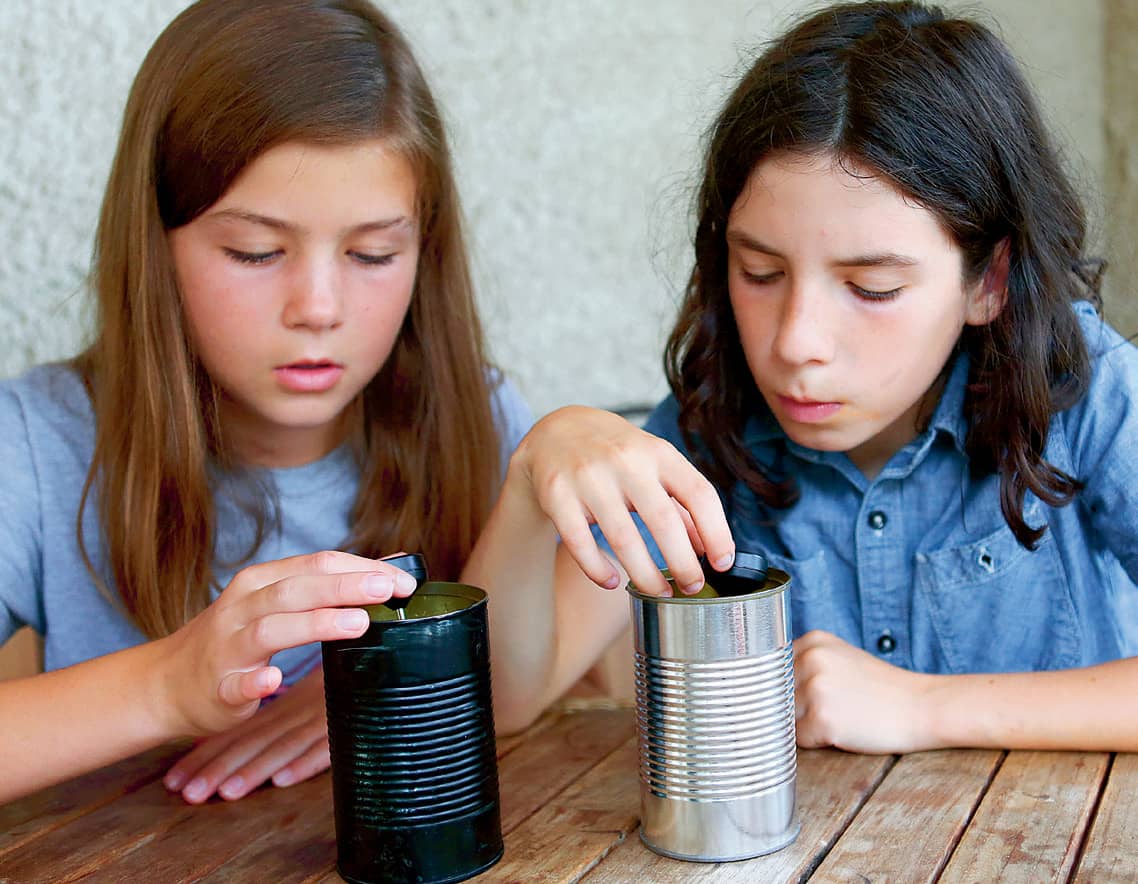
Fig. 2: Record the temperature of the water in both cans.
4. Cover both cans with plastic wrap and secure it with a rubber band (fig. 3).
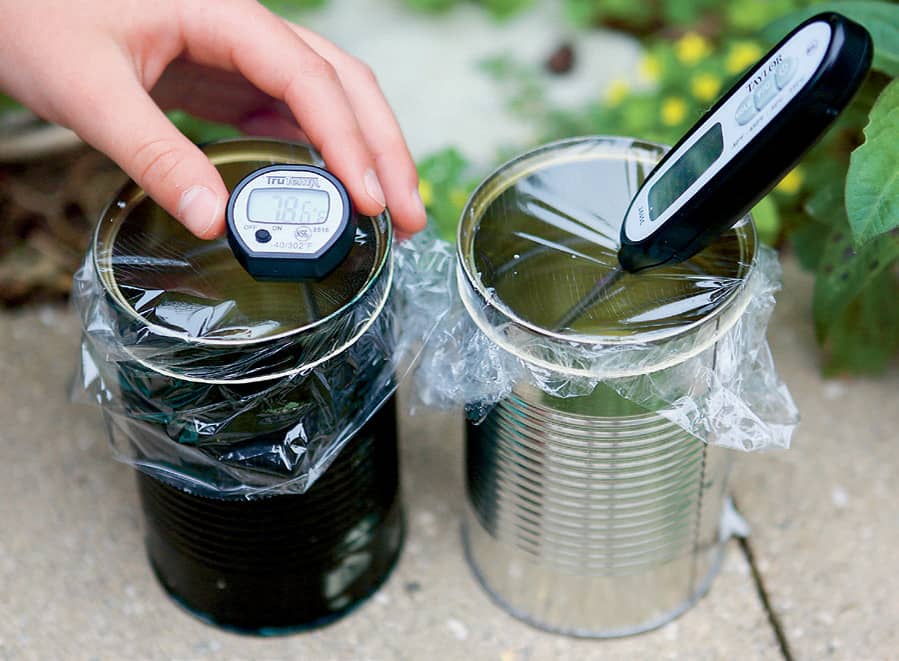
Fig. 3: Cover both cans with plastic wrap.
5. Take the cans outside and place them in direct sunlight. Record the temperature again every minute for fifteen minutes (fig. 4). Poke the digital thermometer through the plastic wrap and into the water. Record the temperatures. Which can shows the greatest temperature increase?
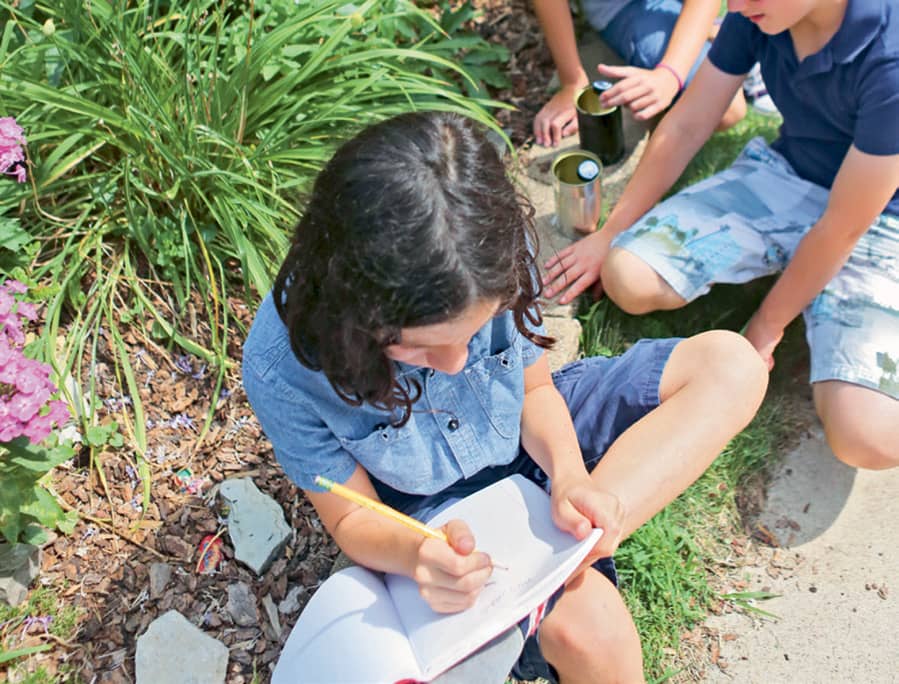
Fig. 4: Take the temperature of the water every 15 minutes.
|
WATTS IT ALL ABOUT? |

Electronics can use a load of energy. In fact, “load” is often the term used to describe any pluggable electronic device. Can you count the number of items plugged in at your home right now? It would likely be pretty difficult, since so many of our appliances, machines, and personal devices are pluggables. We use energy from these devices in units called watts. We can figure out how much each item costs us to use by doing some detective work and math. Break out your calculator: this lab will allow you to calculate just how much energy each item in your home uses and how much it costs you each year!
TIME:
30 minutes (or as long as you’d like)
PERSON POWER:
Grab a Crew Member! Math is more fun with a friend, plus it’s helpful to have a second set of eyes when moving devices and looking for information. Make sure you ask permission before unplugging and moving any devices someone might be using!
SAFETY IS KEY:
When unplugging devices, always pull on the plug itself. Never unplug a device by grabbing and pulling the cord.
MATERIALS
→ pluggable appliances and devices (easy-to-move items are good choices)
→ camera or camera phone
→ electricity bill (optional)
→ notebook and pencil
→ calculator
PART 1
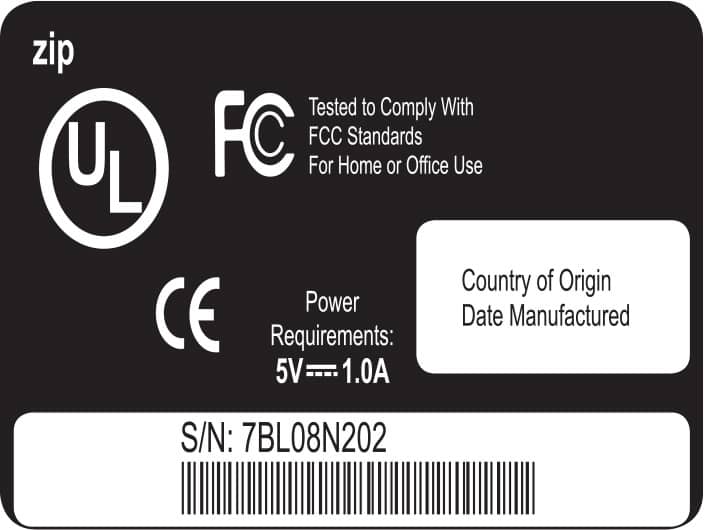
1. Every machine that runs on electricity in your home has a nameplate on it that includes information about amps (A), volts (V), and sometimes watts (W). Nameplates are often stickers or stamps on the surface that look like the picture shown above. Often these can be found on the bottom or backs of devices, but sometimes you have to look closely. Find the nameplates on five devices in your home (fig. 1). Use caution and unplug devices, if needed. Easy options include: television, game console, laptop and/or laptop charger, hair dryer, toaster, vacuum cleaner, and alarm clock.

Fig. 1: Find the nameplates on five devices in your home.
2. Take a picture of each device’s nameplate and any information printed on the device related to its amps, volts, or watts (fig. 2). Sometimes, devices like vacuum cleaners and hair dryers tell you their wattage or amperage in big bold letters because it’s important to the device’s function.
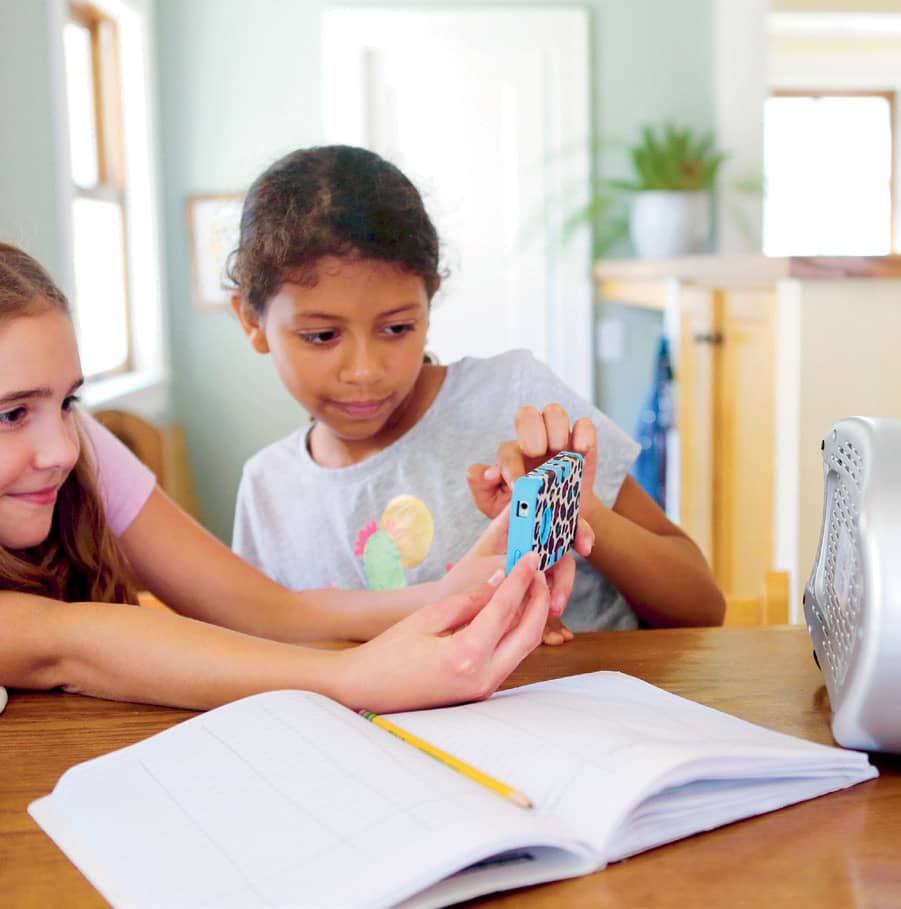
Fig. 2: Take a picture of each device’s nameplate.
3. Make a chart like the one shown here. Record any information you see on each nameplate. For most items, you will see current and voltage, and maybe watts.
Machine or applicance |
Current |
Voltage |
Wattage |
Kilowatts |
Hours Used per Day |
Hours Used per Year |
Cost per kWh |
Total Cost |
|
|
|
|
|
|
|
|
|
|
|
|
|
|
|
|
|
|
|
|
|
|
|
|
|
|
|
|
|
|
|
|
|
|
|
|
PART 2
1. To determine the cost to use each device, we need to figure out how many watts are used. If watts are not listed on the nameplate, you can calculate them by multiplying the current (amps) times the voltage. Record the wattage in the correct column.
2. We use many watts of electricity each month. Because of this, we are not billed for our energy use in watts. WATT? We’re billed in a larger unit—kilowatt-hours. We can figure out our kilowatt hours too! First we have to turn watts into kilowatts. 1 kilowatt is equal to 1000 watts, so we must divide the wattage by 1000. Record this number in the kilowatts column.
3. To figure out how often we use a particular device, we might need to do some thinking or interviewing. Consider how many hours per day the device is plugged in, turned on, and in use. Ask a family member if you’re unsure. Enter this number in the correct column.
4. Some items, like televisions or laptops, may be used on a daily basis. If an item gets used each day, multiply the hours per day by the number of days in a year (365) to find out the number of hours per year. If an appliance or device is used only a few times a year, multiply by the number of days it is actually used. Ask the family member who uses it for an estimate. Enter these figures in the correct column.
5. We are billed for our electrical use in kilowatt-hours (kWh). The average price throughout much of North America is 12 cents per kilowatt-hour, but the amount may be more or less where you live. Check your family’s electricity bill to find your kWh cost. If you don’t have a bill on hand, enter $0.12 in the cost column for the national average.
6. Now we must calculate the total cost (fig. 3). Since we are billed in kilowatt-hours, multiply the kilowatts column by the hours-per-year column times the cost-per-kWh column. This number will be the total cost for each device per year!

Fig. 3: Calculate the total cost.
Now Try This! 
Check out your home’s electric meter at the beginning of the day. Go back and check it at the end of the day. How many kilowatt-hours were used? Make a list of all the items that were turned on in your house today that contribute to this consumption. Could you turn some things off and make the list smaller?
NOTE: A nameplate lists maximum ratings. Not all devices use the maximum at all times; many have cycles and processes that use small amounts of energy some of the time and larger amounts at other times. Special devices called Kill-A-Watt® meters can help determine exactly how much a device is using at any time.
|
FRIDGE FUN |

Is your refrigerator running? Well, you’d better go catch it! That joke is so old, but one thing is true: refrigerators are always running. In fact, the refrigerator typically consumes the most energy of all appliances in a home, because it’s running all day, every day, keeping our food chilled and safe for eating. This lab will allow you to explore your refrigerator to make sure it is operating efficiently and not wasting energy.
TIME:
15 minutes, plus 5 minutes the next day
PERSON POWER:
No Sweat!
MATERIALS
→ 2 alcohol thermometers
→ water
→ drinking glass
→ dollar bill
TEST 1
1. Many refrigerators do not have actual thermostats; they have dials with settings that correspond to a temperature. Take note of the setting in your refrigerator.
2. Fill a drinking glass with warm water. Place the thermometer in the glass and position it on the shelf in the center of your refrigerator. Record the starting temperature (fig. 1).
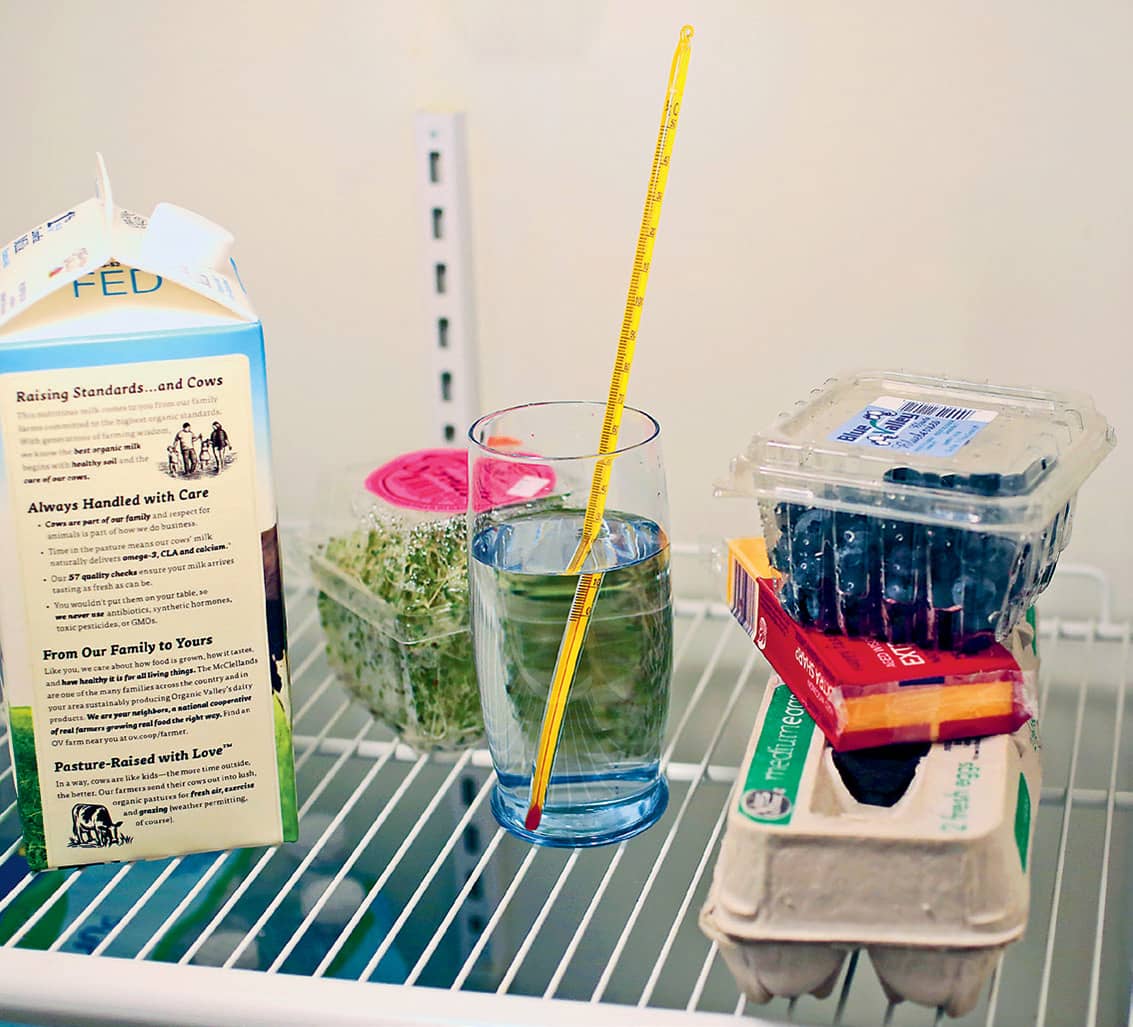
Fig. 1: Place the thermometer in the glass on a shelf in the refrigerator.
3. Allow the thermometer to remain in place for twenty-four hours, and record the temperature again.
4. Now take note of the setting for your freezer. Place the second thermometer between two frozen food packages in the freezer (fig. 2). Allow it to remain for twenty-four hours before checking the temperature.
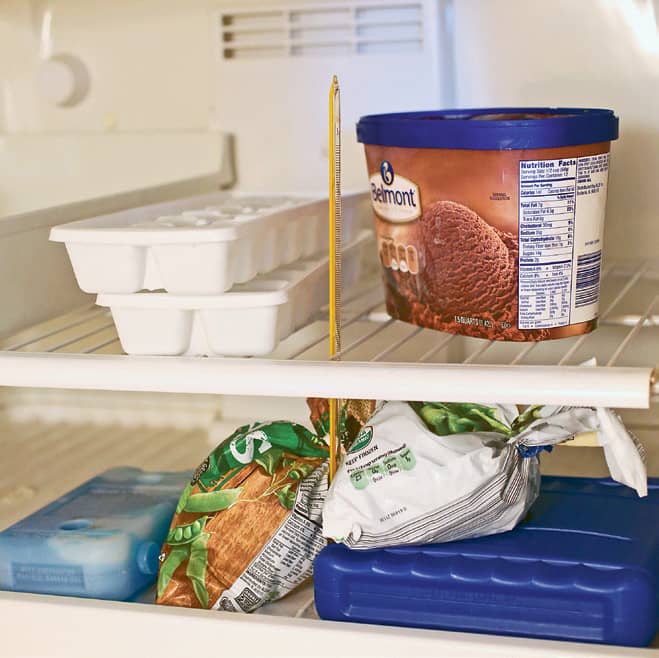
Fig. 2: Place the second thermometer between frozen foods in the freezer.
5. The recommended temperature for a refrigerator is 35°F to 38°F (1.6°C to 3.3°C). What is the temperature of the water in your refrigerator? How much did the water cool? The recommended setting for a freezer is 0°F (–17.7°C) Should you adjust your settings up or down? Try adjusting the settings by one notch each and repeat the tests. Setting the dial at too cold a temperature means you’re wasting energy and money. Not setting the temperature cold enough, however, could mean your food is unsafe.
TEST 2
1. Refrigerators seal shut when we close them, thanks to the rubber gaskets around the door. Place a dollar bill half inside the refrigerator and half outside. Close the door (fig. 3).
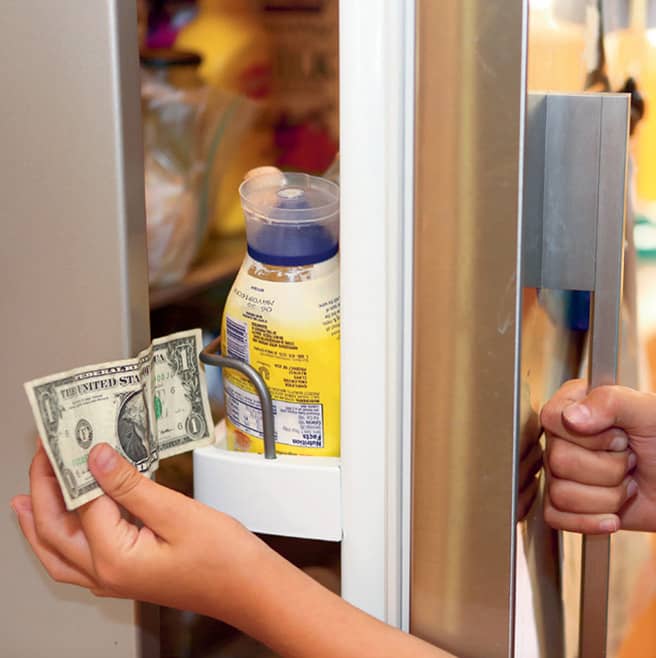
Fig. 3: Place a dollar bill half in the refrigerator and half out.
2. Try to remove the dollar bill by grasping the end and gently pulling it (fig. 4). Avoid fast or abrupt jerking, as it could tear. Did the bill move? Is it easy or difficult to make it move? How do you think this helps or hurts your refrigerator?

Fig. 4: Grasp the end of the dollar bill and pull it.
Now Try This!
There’s a common debate about refrigerators—to fill or not to fill? Well, that can depend on the fridge, how it cycles its refrigerant, and the number of times you open the door. Repeat test 1 when the refrigerator is full, and repeat it again when it is somewhat empty. Which works better to keep your water glass cold?
|
MONITOR A MONTH… (OR A WEEK) |

Have you ever observed adults on a diet? They often record or write down everything they eat. It might seem annoying, but it helps them to understand easily where they could cut out something unnecessary or budget for times they might have to splurge. Well, when conserving energy and employing energy-efficient technologies to save energy, it’s almost as if we’re going on an energy diet! This long-term lab aims to allow you and your family to observe how you use energy. Will you be able to identify a few places where you can cut the fat?
TIME:
15 to 20 minutes each day for 1 week to 1 month
PERSON POWER:
No Sweat! But, it’s definitely more interesting to work as a family, so if possible, Grab a Crew Member, or four, from your family!
MATERIALS
→ notebook and pencil
→ thermometer
→ camera or camera phone
→ spreadsheet software (optional)
1. Decide as a group how many days of energy behaviors you will monitor. Pick a start day and time, as well as an end day and time.
2. Find your home’s electric meter and record the starting reading (fig. 1). (If your meter is not digital, round the number down if the arrow is between two numbers). If your home uses natural gas, too, you may also wish to record the gas meter reading for this. Ask an adult for help with finding and reading the gas meter.

Fig. 1: Find your home’s electrical meter and record the starting reading.
3. For each day in your monitoring period, you will record your answers to a few questions listed shown here. It will be handy to record these questions and responses in a log and keep them in a family-friendly spot for all to see and keep track of with tallies or responses (figs. 2 and 3). Or, you could discuss your responses as a group each day. As a tech-savvy option, you could also respond to each question in a spreadsheet or shared document for quick data analysis.
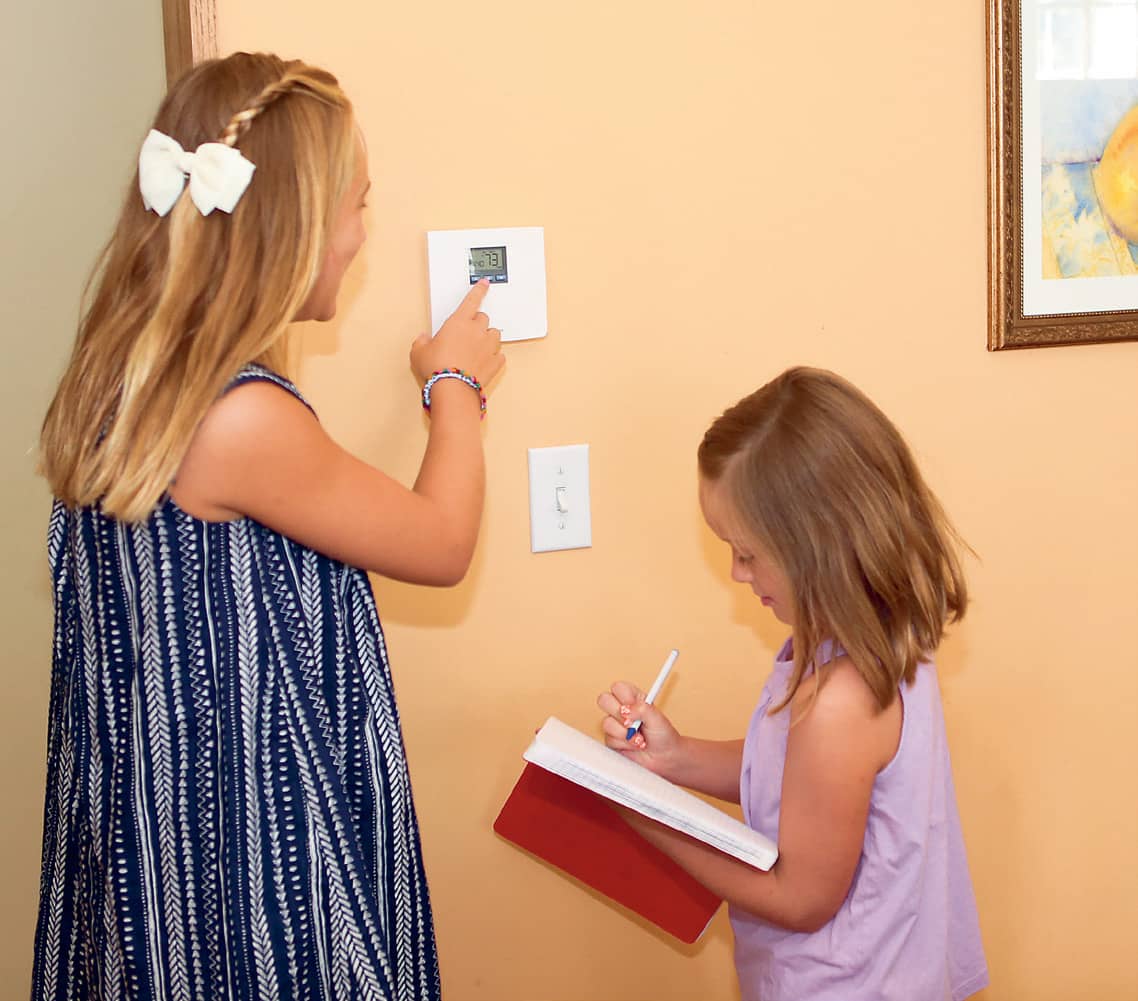
Fig. 2: What temperature was the thermostat set to during the day?

Fig. 3: What was the lowest outdoor temperature at night?
4. At the end of each week, look for any patterns or things that seem odd in your records. Were there any days when usage was higher or lower than others? If so what happened on those days that might explain the difference? What items could you do better with as a family?
5. Take the meter readings again at the close of each week. Subtract the first reading of the week from the final reading. This will equal your total energy consumption for the week. What hasn’t been counted in the survey that is included in the meter reading? What items could be monitored more closely to use less of in upcoming weeks?
monitoring survey
A. Did we run the dishwasher? _____
How many times? _____
Was it completely full each time? _____
What setting was used for each? _____
B. How many loads of laundry were done?
What temperature was used for washing in each load? _____
What temperature was used for rinsing in each load? _____
C. How many baths were taken? _____
D. How many showers were taken? _____
How long (on average) was each shower? _____
E. Are we heating or cooling the house in this season? _____
What temperature was the thermostat set to during the day? _____
What temperature was the thermostat set to during the night? _____
Were any windows open while the system was in use? _____
What was the outdoor temperature (high) during the day? _____
What was the outdoor temperature (low) at night? _____
What was the weather like? _____
Did we use fans or open windows today instead of heating or cooling? _____
Did we open the blinds or close them during the day? _____
F. How many times were lights left on in an unoccupied room? _____
How many times was a TV, game console, or computer left on with no one using it? _____
Smart Meters: There’s an App for That!
An electric meter allows a utility company to keep track of a home’s energy use. Electric meters help companies predict the amount of electricity they need to generate each day, and they also help companies know how much to bill us. Many utility companies are now replacing older meters with smart meters. These meters help consumers save money by allowing them instant access to their energy use through an app or online program. They can compare their use to the lowest user in their neighborhood and check for strange occurrences during the day. Utilities can also send alerts to customers that their energy use is high or that customers could save money by shutting off certain items. Some customers make agreements with their utility, allowing the company to turn down or shut off devices remotely at times of high demand (when everyone is using a lot of electricity). I guess Mom will know exactly when you’re not doing your homework and hitting the video games!
|
WASTE WATCHERS |

“One man’s trash is another man’s treasure,” a famous saying goes. How can trash be a treasure? We can do many things with the waste we generate each day: recycle, compost, landfill, burn it for energy, or reuse it. Everything that’s given a new purpose is a treasure, because it can help provide energy, save money, or save our planet by using fewer resources. Does one person make enough trash each day to make a difference? Well, this lab will allow you to gather information about how much trash you produce!
TIME:
1 day
PERSON POWER:
No Sweat!
IMPORTANT NOTE:
You may want to complete this activity on a day you are around the house for a majority of the day.
MATERIALS
→ permanent marker
→ 3 trash bags with ties
→ 2 resealable, quart-sized plastic bags
→ bingo chips in 3 colors, or similar items like candy or coins
→ bathroom scale
1. Use the marker to label each of your trash bags. Label one “Trash,” one “Recycling,” and one “Compost” (fig. 1). If you don’t compost in your home or town, or if you don’t have a garbage disposal for food waste, you can skip the third bag.

Fig. 1: Make a label for each of the trash bags.
2. Use the permanent marker to write “Today’s Trash” on one of the quart-sized bags (fig. 2). Mark the other bag “Chips” and put bingo chips of 3 colors in inside it (fig. 3). Assign one color of chip to coordinate with each of the trash bags. For example: Red chips = Trash, Green = Recycling, and Blue = compost. If you don’t compost or use a garbage disposal, you may skip the third color of chips.
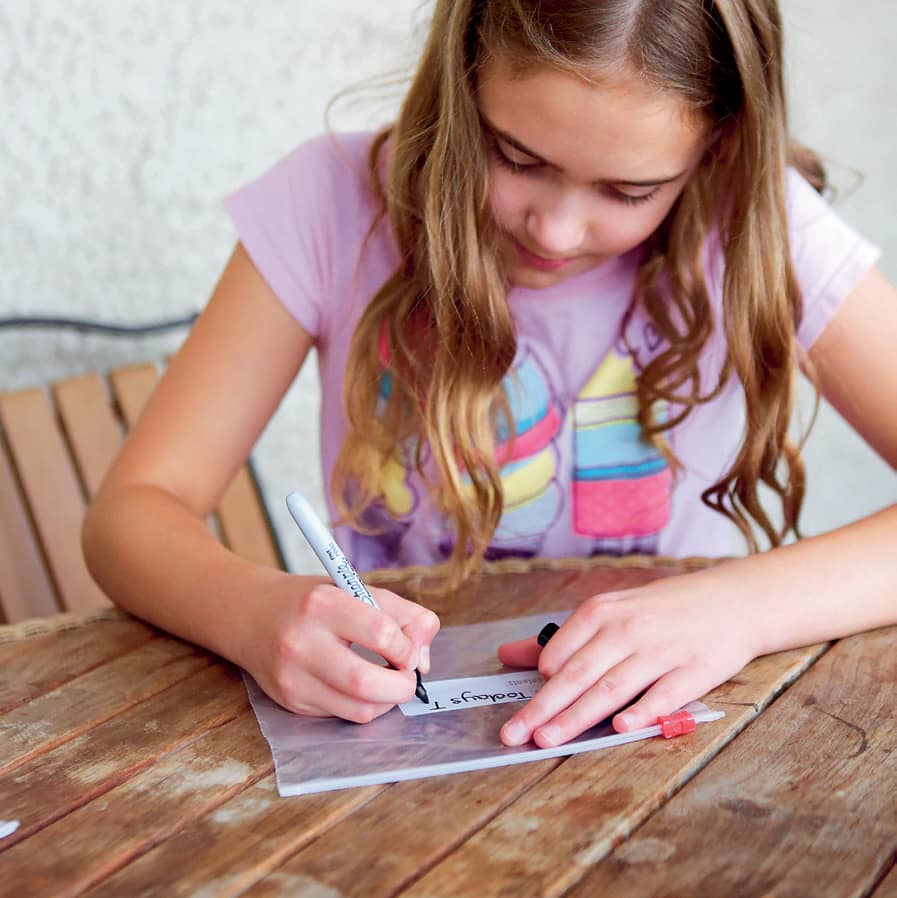
Fig 2: Label each of the quart-sized bags.

Fig. 3: Put three colors of bingo chips or candies in a bag.
3. Carry both resealable bags around with you for the day. Anytime you generate some waste (food, paper, trash, empty containers, etc.) decide how to discard of each piece—trash, recycling, or compost. Take the waste to its proper trash bag and place it inside (fig. 4). Also, transfer a chip of the matching color into your Today’s Trash bag (fig. 5). If you aren’t at home, be sure you transfer the chip, but you don’t have to carry the trash with you! Repeat this process all day, sorting out your garbage and keeping track.
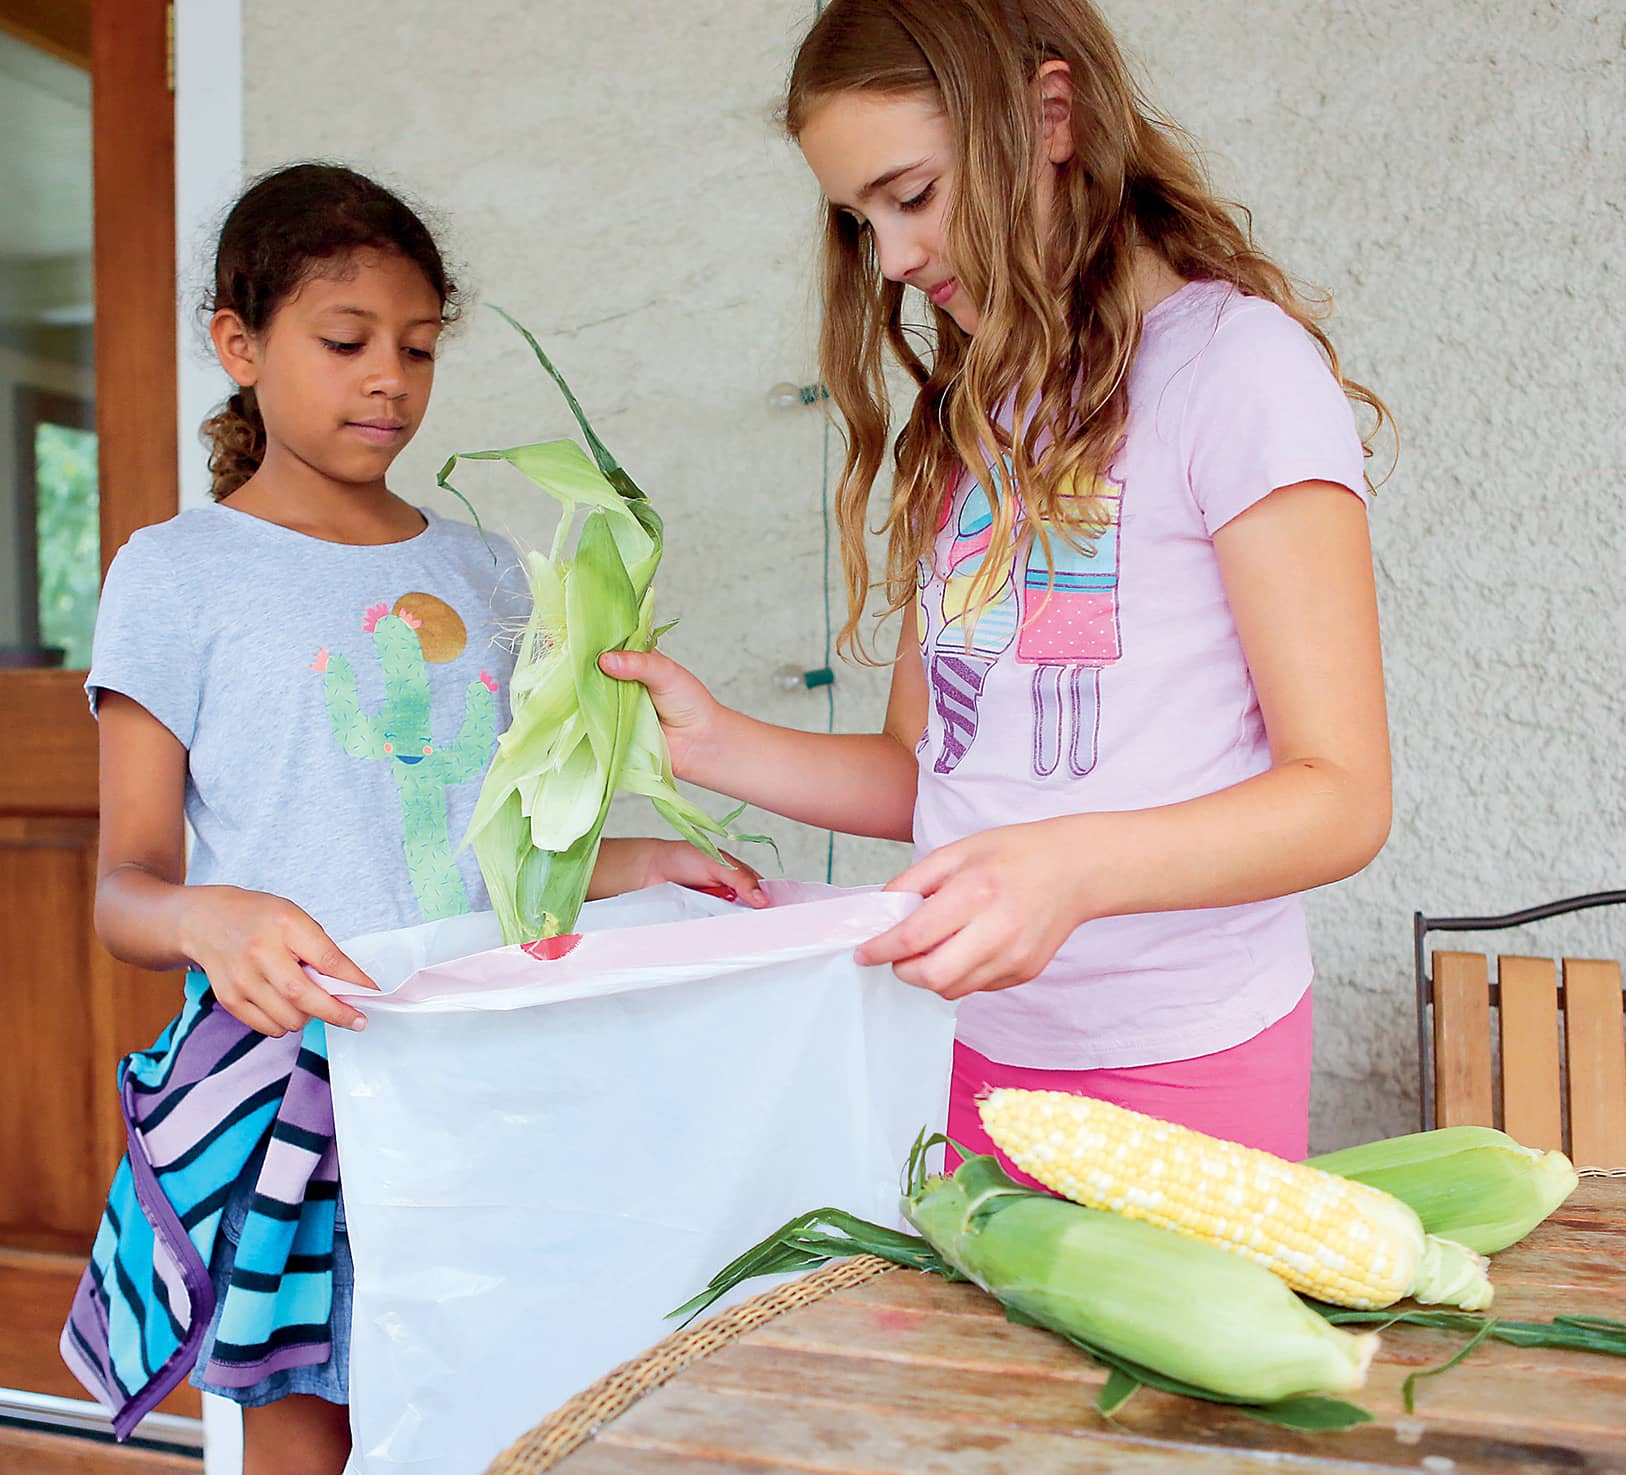
Fig. 4: Put waste in its proper bag.
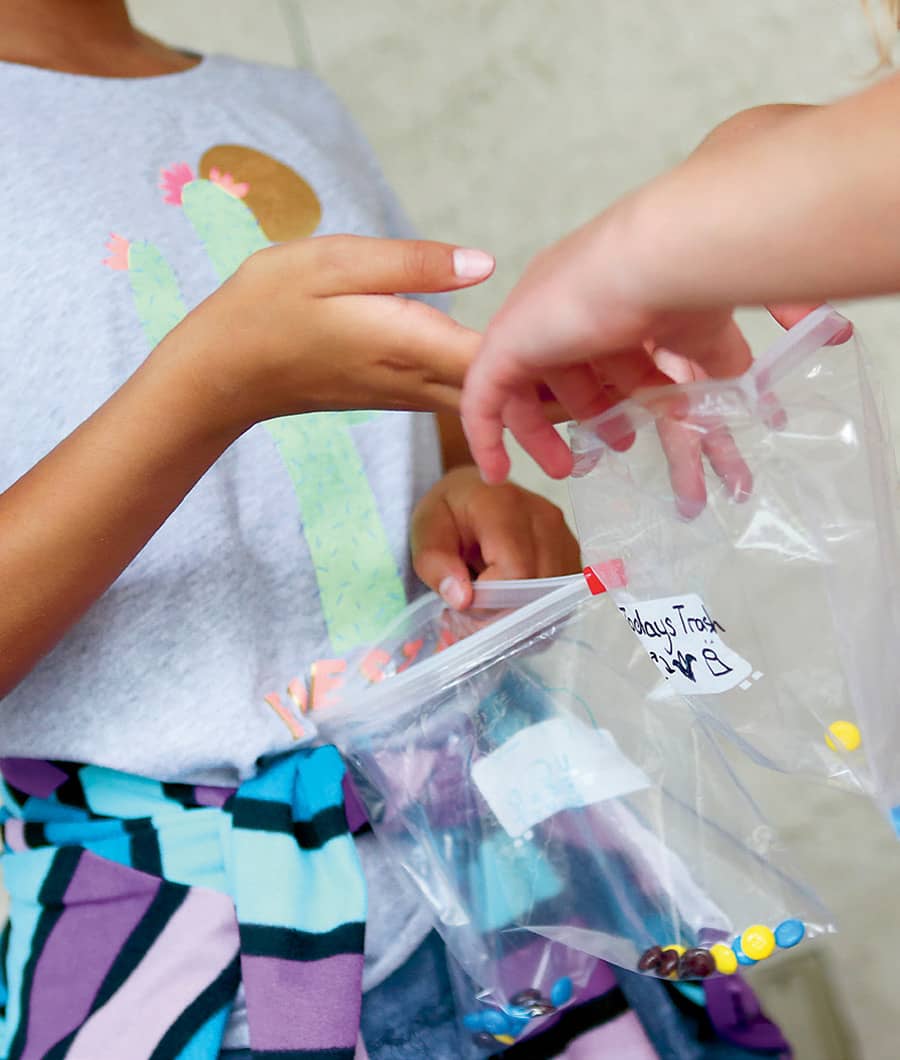
Fig. 5: Transfer a chip to a bag.
4. At the end of the day, take each of your trash bags to the scale and weigh it. Which kind of waste is the heaviest? Which kind of waste ends up taking up the most volume? How much total waste did you create?
5. Count the colored chips in your Today’s Trash bag. Is the total for each color similar in proportion to the scale readings? Why or why not? Are some kinds of trash easier to deal with than others?
6. Check to make sure that the things in your recycling bag can all be recycled in your town, and place them in your home’s receptacle. Do the same with the compost and trash.
Pondering Plastics
Did you ever take a look at the bottom of a plastic bottle? There’s always a recycling symbol with a number in it. What does the number mean? Plastics can be made in many shapes, sizes, and types. There are seven different types of plastics (including Styrofoam). Most are commonly recycled, and a few are not recycled. Each type is labeled with a number from one to seven inside the recycling symbol. This number is a code that tells consumers what each plastic is made from. Local waste-management groups can tell their communities which plastics they recycle by using these same codes. So check those labels!
|
CARBONATION CONUNDRUM |

When we burn fossil fuels in our vehicles and in power plants, we release carbon dioxide molecules. Carbon dioxide exists in our environment naturally, but what happens if there is too much? How does carbon dioxide behave? This lab simulates how carbon dioxide behaves in relation to light and thermal energy (heat).
TIME:
30 minutes, plus 2 minutes the night before (optional)
PERSON POWER:
No Sweat!
SAFETY IS KEY:
When using high-wattage bulbs, be sure to check the light fixture to make sure it is rated to support the wattage of the bulb. Ask an adult for help with this if necessary.
MATERIALS
→ high-wattage, incandescent lightbulb (60 watt or higher, heat lamp, or work bulb)
→ clip lamp
→ 2 twenty-ounce soda bottles, unopened and of the same kind
→ ruler
→ push pin
→ sharp scissors
→ 2 digital kitchen thermometers
→ permanent marker
1. Make sure your lightbulb and lamp are compatible. Also, be sure the bulb you are using is an incandescent bulb. Heat lamp bulbs also work very well.
2. Open one of the bottles. Pour out about 1/3 of the soda (fig. 1). Re-cap the bottle tightly and shake it (fig. 2). Carefully open it and allow the fizz to dissipate. Repeat this process several times until most of the bubbles are gone. Put the cap on the bottle again.
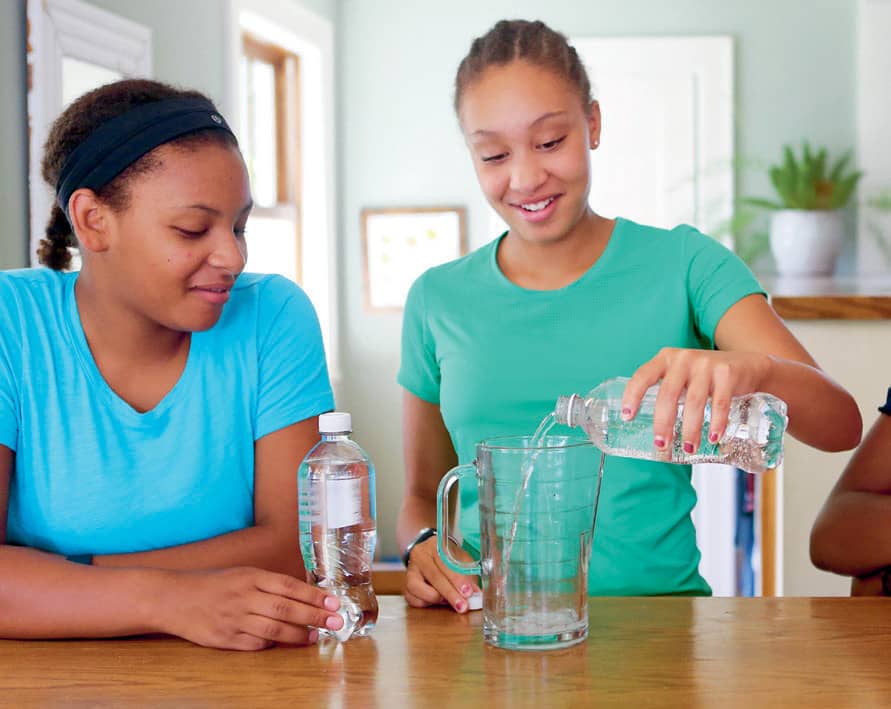
Fig. 1: Open one of the bottles and pour out 1/3 of the soda.
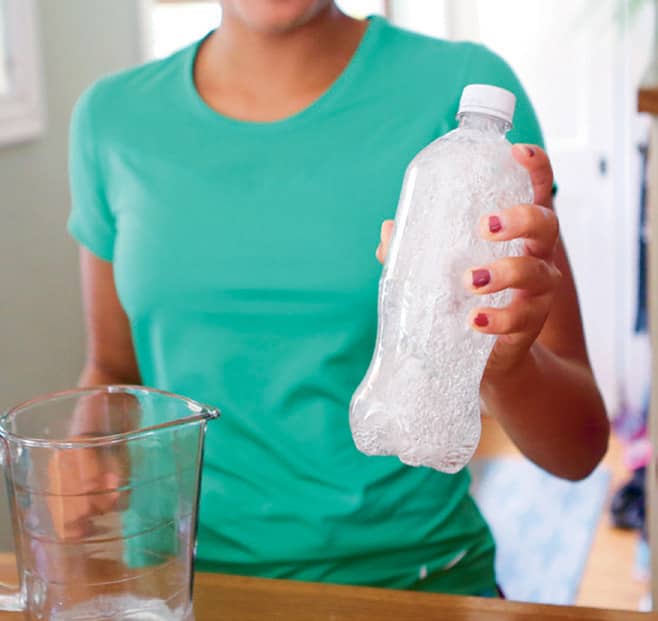
Fig. 2: Shake the bottle and allow the fizz to dissipate.
3. Poke a pushpin into the bottle, just above the top of the label. Use the sharp scissors to make the hole slightly larger (fig. 3). Insert a digital thermometer into the hole (fig. 4). Remove the label from the bottle, and using your marker, label the bottle “Flat.”
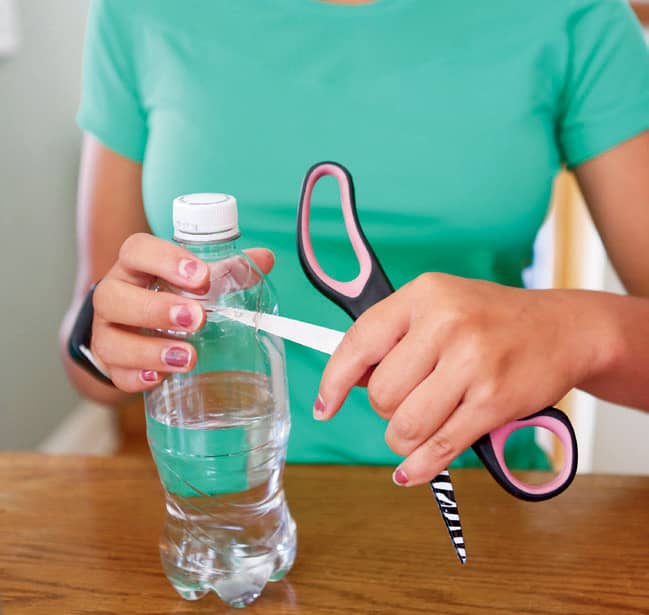
Fig. 3: Make a hole in the bottle.

Fig. 4: Insert the thermometer through the hole.
4. Remove the cap from the second bottle and pour out 1/3 of the soda so that it is about the same height as the first. Do not shake this bottle. Return the cap and seal tightly. Remove the label and mark this bottle “Fizzy.”
5. Poke a push pin into this bottle at roughly the same location as the first. Repeat the process to enlarge the hole and insert the digital thermometer.
6. Set your lamp just above the height of the bottles. Position the bottles next to each other, approximately 6" (15 cm) away from the lamp (fig. 5). Turn the bottles so that the thermometer screens face away from the light. Record the initial temperature of both bottles.
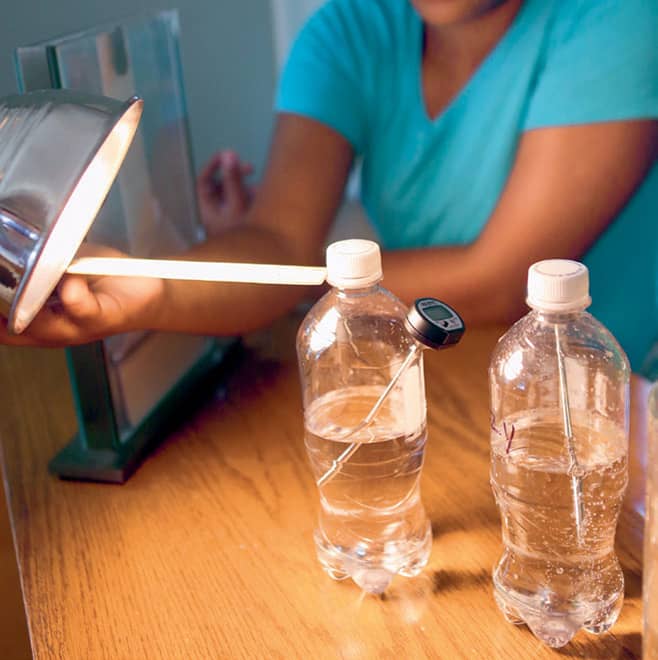
Fig. 5: Position the fizzy and flat bottles next to each other.
7. Turn on the lamp. Both bottles should be receiving equal amounts of light. Record the temperature of both bottles every two minutes for twenty minutes. What do you observe? Why aren’t the temperatures the same?
|
ROAD TRIP |

When people talk about pollution and reducing our carbon footprint, they’re asking us to consider our energy use. They want us to reduce the amount of carbon dioxide we contribute to the atmosphere with our activities. Well, how can we help? One way in which we as a society release the most carbon dioxide is through our day-to-day travels. In this lab, we will map a trip and determine just how much carbon dioxide we produce as we get from point A to point B.
TIME:
30 minutes to 1 hour
PERSON POWER:
No Sweat! But, you can always Grab a Crew Member! Math and imaginary road trips are always more fun with friends!
MATERIALS
→ atlas
→ Internet access
→ calculator
→ notebook and pencil
1. If you had to take a road trip, who would you take and what car would you use? Pick a car that holds the number of people you’d like to travel with (fig. 1). Go to www.fueleconomy.gov and record the year, make, model, miles-per-gallon (MPG) rating, and fuel type for the vehicle. What are some reasons you chose this vehicle?

Fig. 1: Pick a car that holds the right number of people.
2. Consider a destination for your road trip (fig. 2). Use the atlas or online map software to figure out the number of miles you would travel in a car to arrive there. Map your trip and record the total miles (fig. 3).

Fig. 2: Consider a destination for your road trip.
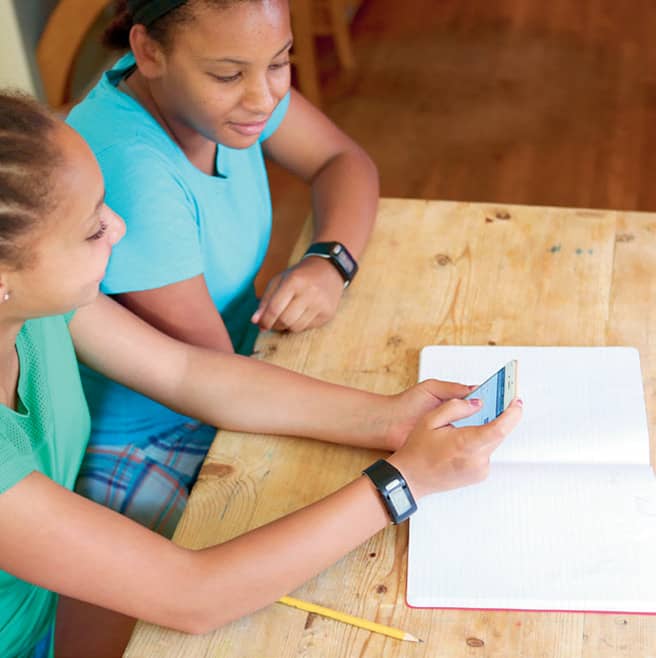
Fig. 3: Map your trip.
3. Make a list of the times you might stop and the towns or locations in which you will stop along the way (fig. 4).

Fig. 4: Make a list of the stops you will make.
4. How many gallons of fuel will you use? Divide the number of miles by the MPG rating of the car to figure out how many gallons of fuel you will need to drive to your destination.
5. How much does gasoline cost in your area? Multiply the number of gallons you will use by cost per gallon to estimate your trip cost.
6. What does your trip cost for the environment? Figure out how much carbon dioxide is released by your car by multiplying the number of gallons of fuel by the amount of CO2 released per gallon. For a gasoline or flex-fuel vehicle, you will release 19.6 pounds (8.89 kg) of CO2 per gallon (3.78 liters), and for diesel fuel, you will release 22.4 pounds (10.16 kg) per gallon (3.78 liters). (Figures taken from the United States Environmental Protection Agency (EPA).)