
misty mars
One of the important research techniques used by mid-nineteenth-century astronomers was applying the newly invented craft of spectroscopy to the study of Mars. With the tools of spectroscopy, they discovered what they believed was proof for the presence of water on the surface and in the atmosphere of Mars. With knowledge that water exists on Mars, they believed they had proof that Mars had an Earthlike climate and that the red patches on Mars were vegetation.
Spectroscopy involves channeling a beam of light from any source through a prism or a grating (a grating can also be reflective), which spreads the light out into its constituent colors, allowing scientists to study the details of brightness and faintness of the different colors. With a simple prism, one sees a few broad colors of the visible rainbow. With a high-resolution grating, however, visible light is spread out much more broadly, into thousands (or even tens of thousands) of different shades of blue, followed by thousands of different shades of green that slowly transition into thousands of different shades of yellow, then thousands of different shades of orange, and finally, thousands of different shades of red.
In obtaining such a spectrum of Mars using a telescope on Earth’s surface, we need to keep in mind that we are looking at light that originates in the photosphere of the Sun. The sunlight radiates outward through the Sun’s outer atmosphere, travels through our solar system across more than 140 million miles of nearly empty space, penetrates downward through the atmosphere of Mars, reflects off the surface of Mars, passes back upward through the Martian atmosphere, then travels across another 25–50 million miles of interplanetary space before it gets to the vicinity of Earth. Finally, the light filters through Earth’s atmosphere. In an actual spectrum of Mars, we will find that some of these thousands of nuanced shades of color are faint or missing because some molecule or chemical element, either in the Sun’s upper atmosphere or the atmosphere of Mars or the atmosphere of Earth, has absorbed some or all of the original sunlight at exactly that very narrow shade of color. Astronomers call a region of a spectrum at which the amount of light is reduced or absent for one of these reasons an absorption line. The 570 dark lines discovered in the spectrum of the Sun by Josef von Fraunhofer in 1814 are absorption lines generated in the atmosphere of the Sun, and they provide chemical clues for us about the composition of the outer layer of the atmosphere of the Sun. With a carefully designed experiment, astronomers can deduce whether the molecule or element removing a particular shade of light in the visible light coming from Mars—all of which, remember, is reflected sunlight—is found in the atmosphere of the Sun or Mars or Earth.
The pioneering work in the spectral analysis of Mars was done by William Huggins, of the Royal Astronomical Society of London, and William Allen Miller, professor of chemistry at Kings College London. They studied Mars with a primitive spectroscope in April 1863 and again, with improved equipment, in August and November 1864. In doing so, they managed to detect several strong absorption lines at the violet (short wavelength) end of the visible spectrum that they attributed to Mars. They suggested that the red color of Mars (at the long wavelength end of the spectrum) is a consequence of Mars being effective at reflecting red light but ineffective at reflecting violet and blue light. This is the same reason red paint is red: the chemicals in red paint are good at absorbing violet, blue, green, and yellow light but are good at reflecting (or not absorbing) red light.
Huggins continued these spectroscopic studies of Mars and published additional results in 1867 as a contribution to the Monthly Notices of the Royal Astronomical Society.1 By comparing spectra of Mars with spectra he obtained of the Moon, and then by identifying features in the Martian spectra that also appeared in the spectra of the reflected light from the Moon, Huggins was able to identify the spectral features due collectively to the Sun, the Moon, and Earth’s atmosphere. He concluded, quite reasonably, that the spectral features that appeared in the spectrum of Mars but that did not appear in the spectrum of the Moon must be created solely by the atmosphere or surface of Mars.
Huggins detected a large number of absorption lines in the spectrum of Mars that were found in the vicinity of the Fraunhofer F line (a line in the blue part of the spectrum now known to be caused by excited hydrogen atoms). The F line, he knew, was created in the solar atmosphere. All the other lines in the Mars spectrum were absent in a solar spectrum and therefore, he knew, were due to Mars. These lines filled the Martian spectrum from the blue region all the way toward the violet end (away from the red end), and thereby removed most of the blue and violet colors from the reflected light from Mars.
Huggins now had much more information that helped him explain, more completely, what he had already come to understand in 1864. Presumably, the reason Mars looks so red, he inferred, is that most of the violet and blue sunlight that initially reaches Mars is absorbed by the Martian atmosphere in these absorption features, leaving mostly red light to be reflected by Mars. In 1864, these violet and blue absorption lines were weaker in November than in August; that is, Mars reflected more violet and blue light in November than in August. As a result, Mars was less red (because it reflected more blue and violet light) in November than it had been in August. Huggins concluded that Mars appeared redder in August when sunlight reflected off the surface and appeared bluer in November when sunlight reflected off water in the atmosphere.2 In other words, Huggins believed that Martian mist, when present, was effective at reflecting blue sunlight; when the mist is not present in the atmosphere, sunlight reaches the surface, which is effective at absorbing blue sunlight, leaving mostly red light to reflect off the planet and back to our telescopes.
By the end of the decade of the 1860s, Huggins, using the tools of laboratory optics and chemistry applied to astronomy, had helped create a new hybrid discipline, astrophysics. Henceforth, astronomers would no longer be limited to measuring only the positions and brightnesses of celestial objects. They would learn how to use the spectra of celestial objects to discover the materials that compose the atmospheres of stars and planets; then they would learn how to use spectral signatures to determine the temperatures, pressures, densities, chemical compositions, motions, and masses of heavenly bodies. This information, in turn, combined with fundamental laws of physics, would allow them to understand the physical structures of the insides of stars, to figure out how stars are born, how they produce light, how they perform nuclear fusion to change hydrogen into heavier elements, how their internal structures evolve as they age, how long they live, and how and why and when they die. Spectroscopy, in the twentieth century, became the key to understanding the structure and evolution of the entire universe.
Huggins began the age of spectroscopy by applying these newly invented techniques of astrophysical spectroscopy to the study of planetary atmospheres, among other celestial objects. In doing so, he uncovered a remarkable result: spectroscopic evidence for the existence of water in the atmosphere of Mars. Claims for the presence of water on Mars (or in the atmosphere of Mars) no longer rested solely on the assertion that “the surface has a dark spot that looks like it should be an ocean.” Now the forensic tools of physics and chemistry could be used to tease apart the light from Mars to look for spectroscopic evidence of water or other materials. Proof that water exists on Mars lent enormous credibility to the idea that Mars was Earthlike. If Mars shows spectroscopic evidence for water, then the so-called bays, seas, and oceans might, in fact, be exactly what they looked like.
The spectroscopic work of Huggins was pioneering and done well. His technique for identifying the spectroscopic features of Mars, as opposed to those of the Sun or of Earth’s atmosphere, worked and still works. He did not, however, actually know what material was responsible for the plethora of blue and violet absorptions lines in his Martian spectra and thus did not have any actual evidence for the presence of water in the Martian atmosphere. That claim, though widely embraced by the professional astronomy community, was nothing more than an educated guess and, as we now know, an overinterpretation of his data. Huggins took one step too far, but others would follow his influential lead.
French astronomer Jules Janssen, who used the technique of spectroscopy to make the first known observations of helium in the atmosphere of the Sun during a total eclipse in 1868a and founded the Meudon Observatory in 1875, followed up the work of Huggins with his own imaginative, spectroscopic experiment. In 1867, he hauled his equipment to the summit of Mount Etna on the island of Sicily, at an elevation of 11,120 feet. From that location, he obtained spectra of both the Moon and Mars (and Saturn). At this high elevation, where he believed he was above most of the water in the atmosphere of Earth (he was wrongb), he hoped to minimize the effects of terrestrial water vapor in the spectra of both celestial objects. By minimizing the contamination of his spectra with the signal of terrestrial water vapor, and by comparing the high-altitude spectrum with others of Mars obtained at sea level from Palermo and of terrestrial water vapor collected at the La Villette Works in Paris, he thought he had accurately made a qualitative comparison of the water content in the Martian and terrestrial atmospheres. From his work, Janssen concluded, like Huggins, that he could identify “the presence of water vapour in the atmospheres of Mars and Saturn.”3
Also like Huggins, William Wallace Campbell was another of the pioneers of astronomical spectroscopy. Shortly after the founding of Lick Observatory in 1888 by the University of California, the first Lick Observatory director hired Campbell as a young assistant to help senior astronomer James Keeler with spectroscopic observations. After Keeler left for Allegheny Observatory, Campbell took over as the senior spectroscopist at Lick. Campbell quickly put the powerful tools at his disposal to work. One of those tools was the Great Refractor, a 36-inch diameter telescope that achieved the goal of its benefactor, the eccentric California millionaire James Lick, who aspired to build a “telescope superior to and more powerful than any telescope yet made.”4
In 1894, noting carefully the mistakes made by Huggins and Janssen in their experimental protocols, especially in observing from humid environments, Campbell explained that the combined factors of the dry environment of California, the largest telescope in the world that he had at his disposal, the high altitude—4,260 feet—of Lick Observatory, and the improved equipment he would be using, would enable him to carry out the definitive test of whether detectable levels of water vapor were present in the Martian atmosphere. He then laid out the criteria by which he would compare the Martian spectra with those of the Moon and how those spectra would be obtained under identical observing conditions. After observing Mars and the Moon on ten different nights during the months of July and August 1894, he had his answer. “The spectra of Mars and the Moon, observed under favorable and identical circumstances, seem to be identical in every respect.” Because the Moon was known to not have an atmosphere, the answer was clear to Campbell. Any absorption lines in the spectrum of the Moon were due solely to the atmosphere of Earth. Furthermore, because the lunar and Martian spectra looked the same, the same conclusion could be applied to Mars. In his words, “The atmospheric and aqueous vapor bands which were observed in both spectra appear to be produced wholly by the elements of the Earth’s atmosphere. The observations, therefore, furnish no evidence whatever of a Martian atmosphere containing aqueous vapor.”5 Campbell had shown, quite convincingly, that Huggins and Janssen had detected water vapor in Earth’s atmosphere, not in the atmosphere of Mars.
In November 1894, after Campbell challenged Huggins’s claim of having discovered water vapor in the atmosphere of Mars, Huggins revisited his work of three decades prior. Again, Huggins rose to the challenge. First, he obtained photographs of spectra of both the Moon and Mars, but he was unable to discern any differences between the spectral features of the two objects in the November photographs. On three nights in December, however, both Huggins and his wife made comparisons by eye of the faint spectral bands of the Moon and Mars, obtained within a few minutes of each other. “On these three nights,” he wrote in an article he chose to publish in volume 1 of a brand new journal, the Astrophysical Journal, which was billed as “An International Review of Spectroscopy and Astronomical Physics,” “the atmospheric bands . . . to which our attention was almost exclusively directed, varied considerably in intensity in the Moon’s spectrum, but were always estimated by us to be rather stronger in the spectrum of Mars.” In repeated versions of this exercise, “Mrs. Huggins’ independent observations agreed with my own.” The conclusion of their work “is to leave the strong conviction in our minds that the spectroscope does show an absorption that is really due to the atmosphere of Mars.” Unstated but understood by all was the idea that this absorption bandc was the signature of water vapor in the Martian atmosphere.6 Also unstated was the fact that despite being published in the Astrophysical Journal, Huggins’s conclusions were based on the premodern technique of judging Martian colors using the human eye, whereas Campbell’s work was modern astrophysics.
In 1908, Vesto Melvin Slipher, working on Percival Lowell’s staff and on Lowell’s behalf at Lowell Observatory in Flagstaff, Arizona, observed Mars from the high altitude of Flagstaff—7,250 feet. Over the course of the next few decades, Slipher would establish himself as one of the greatest observational astronomers of the twentieth century, if not of all time. Most notably, over a decade from about 1913 onward, Slipher measured the radial velocities (toward or away from Earth) of several dozen galaxies and discovered they were almost all redshifted. That is, almost all of these galaxies were speeding away from the Milky Way at velocities of hundreds to thousands of miles per second. Edwin Hubble recognized, in 1929, that Slipher’s and his own more recent velocities were positively correlated with the distances of these same galaxies, meaning that more distant galaxies were moving away from the Milky Way, from us, more quickly than closer galaxies. Thus, Slipher’s measurements of velocity redshifts of galaxies led very directly to Hubble’s discovery of the expanding universe and to our understanding that the universe began with a Big Bang.
Slipher spent his entire career at Lowell Observatory in Flagstaff, Arizona. He began his work there as a staff astronomer in 1901, and, after the death of Percival Lowell, served as observatory director from 1916 until 1954. Under his leadership, Lowell Observatory hired Clyde Tombaugh in 1929. Soon thereafter, in 1930, Tombaugh discovered Pluto. Slipher developed a strong reputation for reporting his discoveries only after carefully and cautiously confirming them; eventually, according to his biographer William Graves Hoyt, he “probably made more fundamental discoveries than any other observational astronomer of the twentieth century.”7 Slipher was awarded the Lalande Prize by the French Academy of Sciences in 1919, the Henry Draper Medal by the National Academy of Sciences in 1932, and the Gold Medal by the Royal Astronomical Society in 1933.
On Mars Hill at Lowell Observatory in 1908, Slipher was observing Mars at nearly twice the elevation of his competitors at Lick Observatory, and above half of the water vapor in the atmosphere of Earth at this location. His experimental method was essentially identical to that used previously by Huggins, Janssen, and Campbell: he compared the spectrum of Mars with the spectrum of the dry, airless Moon. In his spectra, Slipher claimed to have detected a “delicate Martian component” of water. He asserted that “the reasonable conclusion is that the spectrograph has revealed the presence of water in the atmosphere of Mars.” He then suggested that “more observations are needed before any definite statement can be made of the amount of water-vapor in the Martian atmosphere.”8 This particular research result, which formed the entirety of Slipher’s PhD dissertation from Indiana University, awarded in 1909, might be the least impressive and least defensible one done by Slipher over his extended and distinguished career. Slipher never returned to or again mentioned this research result.
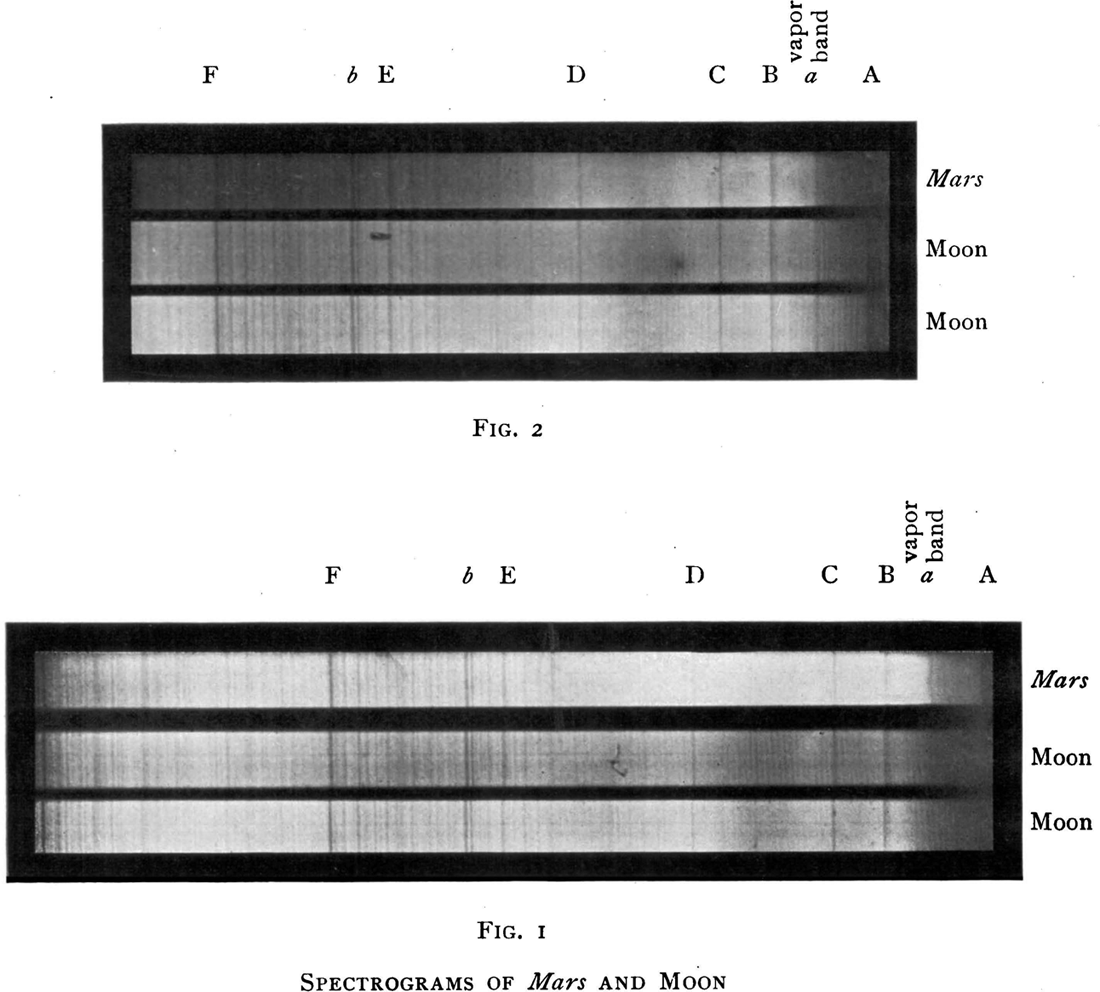
Figure 5.1. Comparison spectra of Mars and the Moon obtained by Slipher in 1908. The spectra in the bottom panel were obtained in very dry observing conditions in the air above the telescope, whereas the spectra in the top panel were obtained when the telluric moisture content was high. Slipher argued that the “vapor band” (below the letter a) was stronger (i.e., darker) in the Mars spectra than in the lunar spectra, and this was evidence for water in the Martian atmosphere. Image from Slipher, Astrophysical Journal, 1908.
A year later, Slipher’s professional nemesis on the water-on-Mars issue, W. W. Campbell, by then the director of Lick Observatory, led an expedition to the top of the then-highest peak in the United States, Mount Whitney in southern California. There his spectroscopic observations of Mars, made at an elevation of 14,600 feet above sea level, would be obtained at a position that would be above 80 percent of the water vapor in Earth’s atmosphere at that location. Campbell found, as he had a decade before, that the so-called water vapor bands were identical in appearance for both the Moon and Mars. He concluded, cautiously and very reasonably, “This does not mean that Mars has no water vapor, but only that the quantity present, if any, must be very slight.”9 He then repeated this experiment in January and February 1910, from Lick Observatory on Mount Hamilton, at a time when the relative velocity of Mars to Earth was high enough to Doppler shift any Martian water lines away from terrestrial water lines.
The Doppler shift is a change in the wavelength of light detected by an observer because of the relative motion of the light source and the observer. If the light source (in this case Mars) is moving away from Earth, light waves from Mars are shifted to longer wavelengths (this shift of the light from yellow toward the red is called a redshift); if the light source and the observer are moving toward each other, the detected light is shifted to shorter wavelengths (a blueshift). Using this observing protocol, Campbell found that “the quantity of water vapor existing . . . in the equatorial atmosphere of Mars was certainly less than one-fifth that existing above Mount Hamilton.”10
Half a century later, a team from the National Geographic Society and the National Bureau of Standards decided that observing techniques and equipment had improved to the point at which a definitive detection of water in the atmosphere of Mars was finally possible. C. C. Kiess, C. H. Corliss, Harriet K. Kiess, and Edith L. R. Corliss set up their equipment at a National Weather Bureau station near the summit of Mauna Loa, in Hawai’i, in 1956. Not only were they observing from an elevation comparable to that of Mount Whitney, but in addition the air above the highest peaks in the Hawai’ian islands is remarkably dry. They also took advantage of the Doppler effect, which should have moved the Martian water lines very slightly from overlapping exactly with the positions of the terrestrial water lines. The results “were negative.” The “numbers of molecules [of water are] too small to produce lines of sufficient strength for micrometric and photometric measurement. . . . We must conclude that if the water vapor in the planet’s atmosphere were entirely condensed, it would form a film of liquid water less than 0.08 mm thick.”11 Campbell was right. Huggins, Janssen, and Slipher were wrong. This back-and-forth, carried out over a period of a full century, captures the essence of science at its best: scientists check and recheck each other’s results. Test, test, and verify. The more impactful and controversial those results, the more important is the need for verification. In this case, the process of science worked, though the process of getting the answer right took a long time.
In 1961, a young Carl Sagan jumped into the debate about water on Mars. After noting that, “To date, all spectroscopic searches for water vapor on Mars have been negative,” he carried out a set of calculations to determine how much water might exist in the Martian environment, consistent with these nondetections. He concluded that the polar caps might be only 1 millimeter thick with water ice and that the amount of water vapor in the atmosphere might be nearly nonexistent. Nevertheless, Sagan suggested optimistically that “these low water-vapor abundances do not argue against life on Mars; obligate halophilesd are known which obtain their entire water requirements from the water absorbed on a crystal of salt.”12
Finally, in April 1963, a full century after Huggins made the first spectroscopic attempt to detect water vapor in the atmosphere of Mars, two different research teams, both using modern instruments and techniques, came very close to measuring the amount of water in the atmosphere of Mars. Lewis Kaplan and his co-workers Guido Münch and Hyron Spinrad obtained a believable result. What did they do differently from previous observers? They brought a bigger hammer. Using the 100-inch diameter telescope on Mount Wilson in California and a state-of-the-art, high-spectral-resolution spectrograph with new, hypersensitized emulsions on the photographic plates, they obtained a 270-minute time exposure of Mars. Even with all these advantages over their predecessors, their result, 14 ±7 microns of precipitable water vapor in the atmosphere of Mars, was marginal (the signal level of 14 was only twice the level of the background noise of 7; most scientists require a minimum detection at three times the noise level in order for a measurement to be considered a likely detection) and not everyone was convinced by this “detection.”13 Certainly, their result was definitive in placing an upper limit on the amount of water vapor in the Martian atmosphere: less than 21 microns, meaning that if all this water condensed onto the surface, it would form a layer no thicker than 21 microns (one-fiftieth of one millimeter).
Also in 1963, a team from Princeton carried out a dramatic, high-tech experiment in an attempt to measure the water vapor content of the Martian atmosphere. On the evening of March 1, they launched a balloon, Stratoscope II, complete with a 36-inch telescope, to a height of 80,000 feet, putting it in Earth’s stratosphere, above all but 2 microns of precipitable water vapor in Earth’s atmosphere. From this height, peering at Mars, their measurements would be virtually uncontaminated by terrestrial water signals. After launch from Palestine, Texas, the balloon landed in Pulaski, Tennessee, where the data tapes were retrieved for analysis. The Princeton team also used state-of-the-art detectors developed by the Texas Instrument Corporation. These special detectors, known as bolometers, were made of a gallium-doped materiale that, once cooled by liquid helium to a temperature of 1.8 degrees above absolute zero, became ultrasensitive to infrared light. Using remote controls to steer an onboard television camera, the observing team sighted Mars and collected data for about forty minutes before the balloon itself floated in between the telescope and Mars, bringing a dramatic and unexpected end to the experiment.
The Stratoscope II team made a very clear detection of carbon dioxide gas in the Martian atmosphere. A major discovery from this project was that the amount of carbon dioxide gas in the Martian atmosphere is so high that it overwhelms any possible signals due to water vapor. But that conclusion would only emerge after a careful and thoughtful analysis of their data. First, they held a press conference shortly after the flight ended. The scientists involved in the research oscillated between appropriately cautious and wildly optimistic in presenting their unanalyzed non-results for public consumption. Team member Harold Weaver, an astronomer from the University of California, told the press, on the basis of absolutely no actual data, that “it’s pretty certain” that Stratoscope II had detected water vapor. This was an early modern example of why science should not be done by press conference.
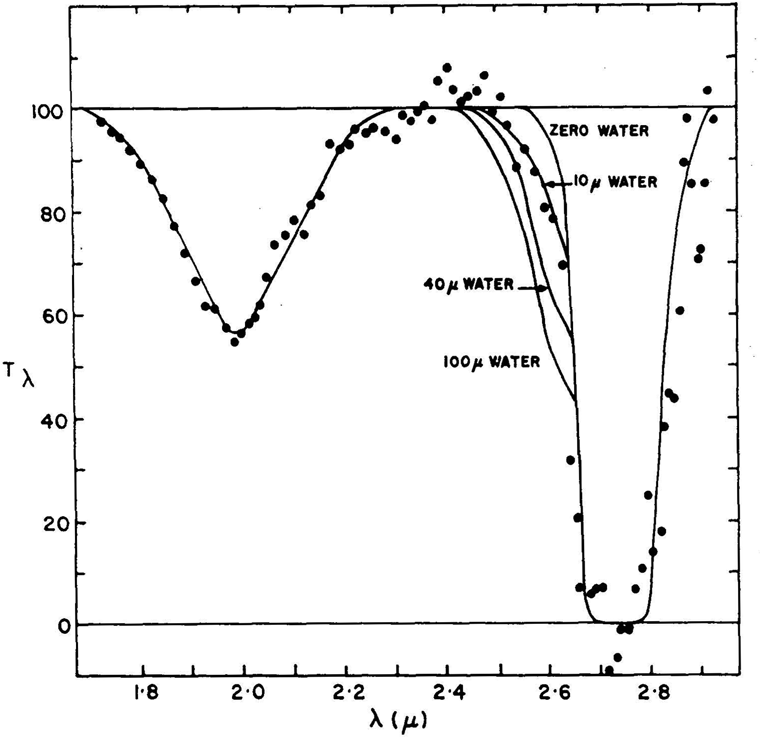
Figure 5.2. Brightness (measured as a percentage) of Mars at infrared wavelengths from 1.6 to 3.0 microns, obtained during the Stratoscope II high-altitude balloon experiment in 1963. The flat line shows the predicted spectrum of Mars assuming molecules in the Martian atmosphere absorb no light. The dots are the measured intensity of light from Mars at specific wavelengths. The lines fit through the data points are models of the Martian atmosphere. The strong, broad dips at 2.01 and 2.72 microns are due to absorption of light by Martian carbon dioxide. The dropped “shoulder” on the left side of the 2.72-micron absorption feature is due to absorption by water vapor in the Martian atmosphere. The best model fit to this shoulder indicates that Mars has about 10 microns of precipitable water vapor. The observational uncertainties in these data are apparent in the excess intensity reported from 2.4 to 2.5 microns and in the deficiency seen at 2.3 microns. Image from, R. E. Danielson, J. E. Gaustad, M. Schwarzschild, H. F. Weaver, and N. J. Woolf, The Astronomical Journal, v. 69, pp. 344–352, 1964, with permission.
The director of the project, Martin Schwarzschild, of Princeton University said, much more wisely and cautiously, “In two weeks we’ll have an opinion and in three months we’ll know.” Nevertheless, on March 5, four days after the flight, the Wall Street Journal reported “Lower Life Forms May Be Able to Live in Mars Atmosphere, Balloon Findings Show.” The WSJ went on to tell its readers that because water has been found on Mars, “some forms of lichens or moss may be present” on Mars.14 A year later, when the Stratoscope II team published their final analysis in a paper in the Astronomical Journal, they concluded, very carefully and confidently, that their measurements revealed, “it is improbable that the water vapor content of Mars is greater than 40 microns.” The actual best-fit they obtained in modeling their data suggested that Mars has about 10 microns of precipitable water vapor, a result remarkably consistent with that found by the Kaplan team.15

Figure 5.3. Brightness of Mars at infrared wavelengths from 3.5 to 6.5 microns, obtained during the Stratoscope II high-altitude balloon experiment in 1963. Brightness arbitrarily normalized to zero at 4.3 microns. The rising dashed line shows the predicted spectrum of Mars assuming the molecules in the Martian atmosphere absorb no light. The dots are the measured intensity of light from Mars at specific wavelengths (large data points are means, taken at 0.3-micron intervals). The solid line is a model fit to the data. The three absorption dips in the model at 4.3, 4.8, and 5.2 microns are due to Martian carbon dioxide, and the model is well matched by the data points in this spectral region. The dip in the model spectrum from 5.5 to 6.3 microns is due to Martian water and assumes 70 microns of precipitable water vapor in the Martian atmosphere. The data points in the 5.5–6.3-micron region indicate that Mars has much less water than this amount. Image from, R. E. Danielson, J. E. Gaustad, M. Schwarzschild, H. F. Weaver, and N. J. Woolf, The Astronomical Journal, v. 69, pp. 344–352, 1964, with permission.
While Kaplan and his colleagues along with the Stratoscope II team should perhaps share credit for the first correct (though marginal) detection of the presence of a slight amount of water in the Martian atmosphere, over the years that followed several groups carried out the first definitive and incontrovertible measurements of the amount of water. Ronald Schorn, of the California Institute of Technology and the Jet Propulsion Laboratory, summarized our knowledge of the measurements of water on Mars in a major review article written for the International Astronomical Union in 1971. “Water exists on Mars,” he wrote. “The water vapor varies with location on the planet, the season on Mars, and from year to year. The water appears to cycle through the polar caps, which are partly H2O. The total amount of water in the atmosphere of Mars is at most a few cubic kilometers.”16 If we were to spread a few cubic kilometers of water evenly across the entire surface of Mars, Mars would be covered in water to a depth of no more than about 20 microns. In other words, both Kaplan’s team and the Stratoscope II team obtained the correct answer in 1963. That’s not much water, but it is the right answer. Mars is very dry.
A century after Huggins and Janssen claimed to have detected water in the atmosphere of Mars, a team of astronomers who wrote a summary in 1992 of what was known about Mars 15 years after NASA’s 1976-era Viking missions to Mars had wrapped up, wrote very simply and succinctly about the work of both Huggins and Janssen: “their results are no longer believed.”17
The Martian atmosphere has a tiny bit of water vapor, but the Martian atmosphere is exceedingly dry, too dry to produce the strong spectroscopic effects seen by Huggins and Janssen. Modern astronomers are convinced that Huggins and Janssen could not have detected the tiny amount of water vapor that is actually present in the Martian atmosphere. Using the tools of astrophysical spectroscopy to prove that water is present in the Martian atmosphere turned out to be much harder than either Huggins or Janssen realized.
a Janssen, however, did no more than notice a bright yellow line in the solar spectrum. Later in 1868, Englishman Norman Lockyer noticed this same line. Helium, which is the cause of this yellow line, was first isolated in a laboratory on Earth by Scottish chemist Sir William Ramsay in 1895; Ramsay was awarded the Nobel Prize in Chemistry in 1904, “in recognition of his services in the discovery of the inert gaseous elements in air, and his determination of their place in the periodic system.”
b The density of Earth’s atmosphere is about 50 percent that at sea level at an altitude of 3.5 miles (18,500 feet); however, the amount of water vapor in the atmosphere varies greatly with geographic location as well as with elevation.
c An absorption band is a series of spectral lines having a common source, e.g., water molecules, in a common energy state, and that are close together in wavelength. At low resolution, these many absorption lines blend together into a single, broad absorption band.
d An obligate halophile is a salt-loving bacterium that both thrives in and requires high salt concentrations of 15–30 percent.
e Doping of a laboratory-made material involves intentionally introducing impurities (in this case, the gallium) into a semiconductor (typically silicon). The impurities change the electrical properties of the semiconductor, making it more sensitive to a particular range of wavelengths of light.