When Does a Pitcher Earn an Earned Run?
DAYN PERRY
Even a highly experienced scout may find it very difficult to tell if a player is any good. At any given moment, the player may look like Alex Rodriguez and Willie Mays combined, but his true worth is in all his moments, not just one. Unless you have an eidetic memory, even a month’s worth of game action gets reduced to a handful of impressions. The statistical record provides a shorthand version of what a player did over that span, which can then be compared to memory.
Even then, it’s not always clear which statistic to use. Many people still believe that wins are the measure of a pitcher’s effectiveness. Since the Cy Young Award was first given out in 1956, fifty-five of eighty-eight recipients have led their league in wins. Thirty-one of those led only in wins, not in earned run average or strikeouts, two other traditional measures of a pitcher’s dominance. From this it can be inferred that for many observers, wins carry more information about a pitcher’s ability than any other statistic.
Yet a win is credited to a pitcher based on a set of criteria that is indifferent to his actual performance. (See Chapter 2-1 for more on pitching statistics.) If he’s a starting pitcher, all a win signifies is that he pitched at least 5 innings and left with a lead that the team preserved. It takes no notice of whether he gave up zero runs or 15.
Won-lost records have more to do with run support, bullpen support, quality of opposition, and blind luck than with pitching excellence. When Hall-of-Famer Nolan Ryan won the National League earned run average title in 1987 but posted an 8-16 record for the season, it was mostly because the Houston Astros lineup couldn’t score any runs for him. The Astros averaged only 3.38 runs in games Ryan started (for the entire year, the team averaged 4.0 runs per contest), and in exactly half of his 34 starts they scored 2 or fewer runs. Under such conditions, Ryan could do everything in his power to accumulate wins and still fail.
Earned run average is a better guide than won-lost record, but it too is subject to distortions that lessen its accuracy. First, ERA, which is designed to isolate the pitcher’s performance from the defense’s performance, absolves the pitcher of responsibility for what occurs after a fielding error, not charging him with runs that result from a misplay by the defense (the “earned” in “earned run average”). In this, ERA does not go far enough, protecting the pitcher’s record if a fielder bobbles a ball or has it go through his legs but failing to absolve him for runs that result from the more subtle defensive lapses of fielders who never reach the ball in the first place. The pitcher whose defense bungles the routine play is forgiven, but one who plays on a team with generally poor fielding range is not. After all, an error can’t be committed on a ball that the defender doesn’t get to.
Moreover, the scoring of errors is highly subjective; what is an error to one official scorer may be a hit to another. And what about those weak pop-ups that fall between two perplexed fielders? According to the way the earned-run rule is interpreted, pitchers are to blame for those too. Baseball Prospectus’s Michael Wolverton satirized the twisted logic behind the earned-run rule:
I’ve done it! I’ve solved the problem of removing the corrupting influence of fielding on pitchers’ runs allowed. We simply pay a sportswriter to sit in the press box, munch Cheetos, and decide which safeties would have been outs with normal fielding effort. Whenever one of these “errors” occurs, we reconstruct the inning—not the game, mind you, just the inning—pretending as if the error never happened. Count up the runs that would have scored in this hypothetical reconstructed inning, and you have a revised run total for the pitcher. Things get a lot more complicated for relievers and team totals, and we’ll broaden the “plays that should have been made” definition a little bit, but you get the idea.
ERA sounds plainly ridiculous in those terms. Still, it’s the rule we have. Following the 2002 season, venerable lefty Tom Glavine parted ways with the Atlanta Braves and signed a lucrative free agent contract with the New York Mets. At various points in his career, Glavine showed pronounced fly-ball tendencies, and in Atlanta that was to his advantage with a peerless fly-chaser like Andruw Jones behind him. In Queens, however, the center fielders in Glavine’s first year included such forgettable names as Jeff Duncan, Tsuyoshi Shinjo, and Raul Gonzalez. In right were lethal doses of Jeromy Burnitz and Roger Cedeño. That was a tremendous drop-off in outfield defense, and Glavine paid for it.
Despite logging peripheral statistics (strikeout rate, home-run rate, walk rate) that weren’t out of step with the rest of his career, Glavine put up an ERA of 4.52, his worst such mark since his first full major league season in 1988. Mets center fielders that season actually posted an above-league average fielding percentage, which means they weren’t committing an inordinate number of errors. But in fielding range, they simply couldn’t compare to the great Andruw Jones. All those balls that Duncan and company didn’t reach counted against Glavine’s ERA. Many of those would’ve been tracked down for outs had Glavine still been pitching in Atlanta.
As for the overly forgiving nature of ERA, consider Texas Rangers knuckleballer Charlie Hough, who in 1987 logged a solid ERA of 3.79 while the American League as a whole posted an ERA of 4.46. This would seem to suggest that Hough was a comfortably above-average pitcher that season. In fact, Hough allowed 39 unearned runs, which is the highest single-season unearned run total of the post–World War II era. Hough allowed 5.02 runs per game in 1987, while AL pitchers as a group allowed only 4.90 runs per game. On that basis, Hough was squarely below average.
Crystallizing this divide was Hough’s outing against the Detroit Tigers on Aug. 30, 1987, when he worked 7 innings, struck out 6, and allowed no earned runs. Certifiable gem? Not even close. Hough also allowed 7 unearned runs, and the Rangers lost 7-0. Here’s how the Tigers’ half of the fifth inning went:

![]() Tom Brookens hit a foul pop-out to first;
Tom Brookens hit a foul pop-out to first;

![]() Lou Whitaker struck out but reached first on a passed ball;
Lou Whitaker struck out but reached first on a passed ball;

![]() Whitaker stole second and advanced to third on a passed ball;
Whitaker stole second and advanced to third on a passed ball;

![]() Bill Madlock was hit by a pitch;
Bill Madlock was hit by a pitch;

![]() Darrell Evans grounded to first, scoring Whitaker and moving Madlock to second;
Darrell Evans grounded to first, scoring Whitaker and moving Madlock to second;

![]() Alan Trammell hit a two-run home run; and
Alan Trammell hit a two-run home run; and

![]() Matt Nokes grounded out.
Matt Nokes grounded out.
None of the 3 runs in the frame were considered earned, including Trammell’s long ball. Hough had avoided responsibility for those runs by throwing a couple of passed balls that were deemed to be catcher Geno Petralli’s fault. This was overly generous to the pitcher: Knuckleballers deliver an inordinate number of throws that are difficult for the catcher to handle. Whether an individual offering is a wild pitch or a passed ball is often an entirely subjective decision. Regardless of how the official scorer sorts things out, wildness is a native weakness of the knuckleballer, and it’s this weakness that makes Hough’s disastrous outing look stellar in the box scores.
Run Average, which makes no arbitrary distinctions between “earned” and “unearned” runs, is a far better statistic, and in the absence of more advanced metrics, it should always be used in lieu of ERA. RA avoids many of the pitfalls of ERA, but it still doesn’t reliably tell us which runs are the pitcher’s fault and which aren’t.
To take an analogy from chemistry, runs are more like molecules than atoms. They’re compounds made up of singles, doubles, triples, home runs, walks, errors, stolen bases, baserunning, sacrifices, balks, hit batsmen, strikes, balls, fouls into the stands, and so on. To evaluate how a pitcher is doing his job, we need to focus on how well he masters the game at the atomic level.
The statistical community has done an outstanding job of divining the best ways to evaluate offensive performance, but with pitchers in particular and run prevention in general, sorting out who should be credited (or blamed) for each run element has been more difficult. In Baseball Prospectus 2000, we wrote that “pitching and defense are so intertwined that they seem impossible to separate.” Key word: “seem.” A “eureka” moment of sorts came a few years ago when researcher Voros McCracken stumbled upon something that set the baseball world on its ear and is still hotly debated. In a 2001 article that appeared at BaseballProspectus.com, McCracken posited that “there is little if any difference among major-league pitchers in their ability to prevent hits on balls hit in the field of play.” In other words, contrary to common sense and decades upon decades of received wisdom, pitchers have exceedingly limited and unpredictable control over the fate of balls once they’re in play.
This is, at first, a strongly counterintuitive notion—good pitchers don’t allow hits. According to McCracken, this is still true: Good pitchers don’t allow hits—the defense does. Pitchers exert almost total control over walks, strikeouts, and home runs (with the rare exception involving something like Jose Canseco’s coconut), and they mostly hold sway over whether a batted ball is on the ground or in the air. The defense plays a significant (but not absolute) role in almost everything else—runs, earned runs, innings, hits allowed, sacrifice hits, and sacrifice flies.
McCracken began his journey of discovery by focusing on what pitchers themselves could control, and he called his resulting metrics Defense-Independent Pitching Statistics (DIPS). For a very long time, it was assumed that pitchers had a significant degree of influence over whether a batted, non-home-run ball was an out or a hit. McCracken’s research indicated that this might not be the case. After all, in a hypothetical world where all defenders have exceptional range, sure-handedness, and flawless positioning, every fair ball that stays in the park should be an out. So it’s hardly an outrageous proposition to say that defense—or even luck—has a great deal more influence on a pitcher’s performance than was previously thought.
McCracken was led to his stunning conclusion by several findings:

![]() The pitchers who were the best at preventing hits on balls in play one year were often the worst the next year. The incomparable Greg Maddux in 1998 had one of the best batting averages on balls in play (BABIP), but in 1999 he had one of the worst, although many other key indicators remained similar.
The pitchers who were the best at preventing hits on balls in play one year were often the worst the next year. The incomparable Greg Maddux in 1998 had one of the best batting averages on balls in play (BABIP), but in 1999 he had one of the worst, although many other key indicators remained similar.

![]() A pitcher’s hits per balls in play could more accurately be predicted from the rate of the rest of the pitching staff than from the pitcher’s own previous rates.
A pitcher’s hits per balls in play could more accurately be predicted from the rate of the rest of the pitching staff than from the pitcher’s own previous rates.

![]() The range of career rates of hits per balls in play for pitchers with a significant number of innings was about the same as the range that would be expected from random chance. The vast majority of pitchers with a significant number of career innings have BABIPs between .280 and .290.
The range of career rates of hits per balls in play for pitchers with a significant number of innings was about the same as the range that would be expected from random chance. The vast majority of pitchers with a significant number of career innings have BABIPs between .280 and .290.

![]() When adjusted for environmental advantages (the designated hitter rule, park effects, league, etc.) the BABIP range became even smaller.
When adjusted for environmental advantages (the designated hitter rule, park effects, league, etc.) the BABIP range became even smaller.
Subsequent research by Baseball Prospectus’s Keith Woolner and Clay Davenport and Tom Tippett of Diamond Mind Baseball revealed several problems with McCracken’s work:

![]() The single year’s worth of data that McCracken drew on in his initial study wasn’t adequate to support his conclusions;
The single year’s worth of data that McCracken drew on in his initial study wasn’t adequate to support his conclusions;

![]() Some specialized pitchers—knuckleballers like Tim Wakefield, control artists like Ferguson Jenkins, and soft-tossing lefties like Jamie Moyer—do demonstrate a consistent ability to limit hits on balls in play;
Some specialized pitchers—knuckleballers like Tim Wakefield, control artists like Ferguson Jenkins, and soft-tossing lefties like Jamie Moyer—do demonstrate a consistent ability to limit hits on balls in play;

![]() Major league pitchers are manifestly better at preventing hits on balls in play than minor league pitchers who never made it to the highest level;
Major league pitchers are manifestly better at preventing hits on balls in play than minor league pitchers who never made it to the highest level;

![]() Inducing infield pop-ups has proved to be a repeatable skill among major league pitchers; and
Inducing infield pop-ups has proved to be a repeatable skill among major league pitchers; and

![]() Pitchers do have a great degree of control over whether a ball is hit on the ground or in the air, and those two categories of batted balls vary greatly in how often they go for base hits.
Pitchers do have a great degree of control over whether a ball is hit on the ground or in the air, and those two categories of batted balls vary greatly in how often they go for base hits.
In the final analysis, though, McCracken’s general observation still stands, leaving a truth that, retrospectively speaking, should’ve been obvious from the get-go: It’s not that pitchers have no control over what becomes of a ball in play but that they have less control in that respect than they do over walks, strikeouts, and home runs.
So what does determine the fate of a ball in play? Researchers Erik Allen, Arvin Hsu, and Tango Tiger ran a series of regression analyses, which are computations that predict the average of one random variable based on the measures of other random variables on pitchers with at least 700 balls in play in a given season. They arrived at the following breakdowns on what determines the fate of a batted ball:
Luck |
44 percent |
Pitcher |
28 percent |
Defense |
17 percent |
Park |
11 percent |
The most powerful determinant is blind luck, followed by the pitcher, and then by defense and the tendencies of the ballpark. While these findings conflict with McCracken’s, they still embody a sea change in the way we think about pitchers. When the bat hits the ball, and the ball stays in the park, luck, rather than the pitcher’s ability, usually holds sway.
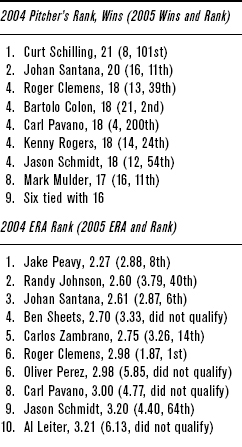
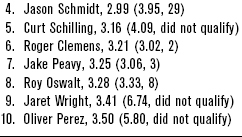
ERA tends to fluctuate fairly significantly from year to year, but DIPS statistics show more consistency. To demonstrate this, let’s take a snapshot look at how these measures carry over from year to year. Table 3-1.1 has four sections showing the top-ten 2004 major league rankings for pitcher wins, ERA, RA, and DIPS ERA. In parentheses next to each pitcher’s entry are his 2005 wins, ERA, RA, and DIPS ERA, along with his 2005 ranking (provided he logged enough innings to qualify in 2005).
As you can see, only one pitcher with a top-ten ranking in wins in 2004 also finished in the top ten in 2005. Three carry over for ERA, three for RA; but five—exactly half the list—carry over for DIPS ERA. Pitchers tend to perform more consistently in DIPS ERA because it does a better job of isolating their core skills.
This means that by looking at a pitcher’s DIPS indicators and by evaluating his home park and the defense, we can come up with a reasonably accurate forecast of his performance. Needless to say, these improved forecasting abilities have value to fans, writers, fantasy players, and executives alike. There’s a great deal of inaccuracy in ERA, but much less when a pitcher’s performance is viewed through the prism of DIPS. By homing in on what pitchers themselves control and by sensibly evaluating the external factors, we can better predict how they’ll fare in successive seasons.
TABLE 3-1.1 Pitching Measures from Year to Year


On another level, with DIPS, McCracken was trying to isolate pitching from defense, something of which ERA does a manifestly poor job. His work has forced us to reevaluate what we think we know about those two elements of run prevention. ERA is a relic and is best treated as such; Run Average is a far superior measure. DIPS is better still. Researchers have continued to dig deeper, developing gauges such as Baseball Prospectus’ Support-Neutral statistics (see Chapter 2-1). But despite all the available measures, we still haven’t developed an ideal way to analyze a pitcher’s actual contribution to his team’s success.