Marnie Grant Dobbin
INTRODUCTION
While only effective cancer treatment can reverse the symptoms of cancer cachexia, nutritional deficits and weight loss in patients with cancer can be minimized with timely nutritional intervention and pharmacologic management.
INCIDENCE AND IMPACT OF MALNUTRITION
 More than 40% of oncology patients develop signs of malnutrition during treatment.
Malnourished patients incur higher costs for their care, have impaired responses to treatment, greater risk of drug toxicity, and increased rates of morbidity and mortality compared to patients with normal nutritional status.
As many as 20% of oncology patients die from nutritional complications rather than from their primary diagnosis.
When malnutrition is identified, diagnosed, and treated, reimbursement to cover the increased cost of care can also be increased—if the physician includes the diagnosis and degree of malnutrition in his documentation, using the currently accepted criteria for diagnosing adult malnutrition. See Table 39.1.
TABLE 39.1Clinical Characteristics to Support a Diagnosis of Malnutrition in Adults
Clinical Characteristic | Related to Acute Illness/Injury | Related to Chronic Illness | Related to Social or Environmental Circumstance |
Moderate Protein-Calorie Malnutrition ICD-10 Code: E44.0 | |||
Weight Loss | 1–2% in 1 week 5% in 1 month 7.5% in 3 months | 5% in 1 month 7.5% in 3 months 10% in 6 months 20% in 12 months | 5% in 1 month 7.5% in 3 months 10% in 6 months 20% in 12 months |
Energy Intake (* per registered dietitian assessment) | < 75% of estimated needs* for > 7 days | < 75% of estimated needs* for ≥ 1 month | < 75% of estimated needs* for ≥ 3 months |
Physical Findings: Mild fat and muscle loss, mild fluid accumulation | |||
Severe Protein-Calorie Malnutrition ICD-10 Code: E43.0 | |||
Weight Loss | > 2% in 1 week > 5% in 1 month > 7.5% in 3 months | > 5% in 1 month > 7.5% in 3 months > 10% in 6 months > 20% in 12 months | > 5% in 1 month > 7.5% in 3 months > 10% in 6 months > 20% in 12 months |
Energy Intake | ≤ 50% of estimated needs for ≥5 days | < 75% for ≥ 1 month | ≤ 50% for ≥1 month |
Fat Loss (e.g. of orbital fat pads, triceps, biceps, ribs, lower back) | Moderate depletion (e.g. iliac crest prominent) | Severe depletion (e.g. loss of orbital fat pads) | Severe depletion (e.g. depression between ribs very apparent) |
Muscle Mass Loss (e.g. of the temporalis, clavicle, scapular and patella region, dorsal hand, posterior calf) | Moderate depletion (e.g. visible clavicle bone in male; clavicle protruding in female) | Severe depletion (e.g. wasting of the temporalis muscle) | Severe depletion (e.g. flattening of interosseous muscle between thumb and forefinger) |
Fluid Accumulation | Moderate to severe (e.g. slight swelling of extremity) | Severe (e.g. 3+ edema) | Severe (e.g. deep pitting) |
Functional Assessment | Grip strength has decreased | Grip strength below normative values | Grip strength below normative values |
Adapted from White JV, Guenter P, Jensen G, et al, “Consensus Statement: Academy of Nutrition and Dietetics and American Society for Parenteral Nutrition: Characteristics Recommended for the Identification and Documentation of Adult Malnutrition, J Parenteral Enteral Nutr. 2012:36:275–283
CANCER CACHEXIA
Nearly two-thirds of patients with cancer develop cancer cachexia characterized by systemic inflammation, anorexia, immunosuppression, and metabolic derangements. These can lead to unintentional weight loss and failure to preserve muscle and fat mass.
There is no consistent relationship between tumor type, tumor burden, anatomic site of involvement, and cancer cachexia.
Hypermetabolism is not uniformly present.
Tumor-induced changes in host production of proinflammatory cytokines (TNF, IL-1, IL-6, and IFN) can lead to hypermetabolism and to anorexia due to changes in gherlin, seratonin, and leptin production. Tumor production of proteolysis-inducing factor and lipid-mobilizing factor contribute to loss of muscle and fat mass—even in the presence of adequate nutrition intake. Inefficient energy metabolism and insulin resistance lead to further depletion of lean body mass.
Identification of patients with muscle loss has become increasingly difficult as 40% to 60% of patients with cancer are overweight or obese, with fat mass masking muscle loss.
Overfeeding is likely to worsen metabolic dysregulation and will not result in weight gain.
SCREENING FOR NUTRITIONAL RISK
Nutritional deterioration can be minimized if patients are screened at each visit, so that problems can be identified and interventions provided when they can have the most impact. The Joint Commission on Healthcare Accreditation standards state that inpatients are to be screened for nutritional risk within 1 day of admission. Validated screening tools such as the Subjective Global Assessment (SGA) form (https://www.accc-cancer.org/oncology_issues/supplements/Scored-Patient-Generated-Subjective-Global-Assessment-PG-SGA.pdf), may be especially helpful in the outpatient setting. Parameters include weight change, symptoms impacting nutrition, changes in diet, functional status, changes in metabolism and in muscle, fat and fluid status. Use of the form also serves to demonstrate to the patient that nutrition is a priority of the medical team.
The Pediatric Subjective Global Nutritional Assessment (SGNA) rating form has been validated for use in children. The tool combines clinical judgment and objective criteria to determine a global rating of nutritional status and for identifying those at higher risk of nutrition-related complications (https://www.ncbi.nlm.nih.gov/pubmed/22717202). Parameters include appropriateness of current height for age (stunting), current weight for height (wasting), and unintentional changes in body weight, adequacy of dietary intake, gastrointestinal symptoms, functional capacity and metabolic stress of disease, loss of subcutaneous fat, muscle wasting and nutrition-related edema.
NUTRITIONAL ASSESSMENT
Registered dietitian nutritionists (RD or RDN) use anthropometric data, biochemical indices, nutrition-focused physical assessment, diet and medical histories to assess the nutritional status of patients and to determine appropriate intervention. See Table 39.2 for RD referral information and suggestions for faddressing nutrition and dietary supplement questions from patients.
TABLE 39.2To Address Patients’ Questions about Nutrition or Dietary Supplements
Refer to a registered dietitian nutritionist (RD or RDN) for individualized nutrition counseling | The registered dietitian nutritionist is the only professional with standardized education, clinical training, continuing education, and national credentialing necessary to be directly reimbursed as a provider of nutrition therapy. RD requirements include: a bachelor’s degree or higher (>40% have a master’s or doctoral degree), 1200 hr. supervised internship, a national credentialing exam and continuing education. Other nutrition credentials, degrees or titles do not meet these standards. |
For free, responsible nutrition/cancer guidelines | “Heal Well” from the American Institute for Cancer Research, LIVESTRONG, and Meals to Heal addresses common nutrition concerns and myths such as “Does sugar feed cancer?” http://www.aicr.org/assets/docs/pdf/education/heal-well-guide.pdf “Eating Hints” from the National Cancer Institute—provides nutrition suggestions for patients undergoing treatment https://www.cancer.gov/publications/patient-education/eatinghints.pdf |
For vitamin and other dietary supplement information | The NIH Office of Dietary Supplements provides evidence-based, responsible professional and consumer level handouts https://ods.od.nih.gov/factsheets/list-all/ The Natural Medicines Comprehensive Database (published by the Therapeutic Research Faculty) provides thorough, frequently updated, well-referenced information including potential drug interactions and has consumer level information available. http://naturaldatabase.therapeuticresearch.com/home.aspx?cs=cepda&s=ND |
BODY COMPOSITION
Obtaining baseline measurements of body composition and comparing these measurements over time can be helpful for monitoring nutritional status.
Body composition is an important predictor of anti-cancer drug efficacy and toxicity. The use of body surface area (BSA) for dosing chemotherapy is being questioned as cytotoxic drugs are largely metabolized and excreted by the liver and kidney, which does not correlate with BSA. There is literature to suggest that lean body mass or fat free mass may be a better basis for normalizing drug dosages in patients with cancer, especially for hydrophilic drugs.
The recommended measurement for diagnosing sarcopenia (muscle loss) is by direct measurement of lean body mass by either DXA (dual energy x-ray absorptiometry) or computed tomography (CT). The DXA, however, does not distinguish between lean and adipose tissue sub-compartments.
The third lumbar vertebra has been validated as the standard landmark for body composition analysis (via CT) because in this region, the percentage of skeletal muscle and adipose tissue has been found to accurately reflect the percentage of skeletal muscle and fat in the entire body.
Especially as patients with cancer frequently have routine CT monitoring, the use of the third lumbar CT slice to monitor changes in body composition may become routine in the future.
Measures of muscle mass can include the use of skin calipers to measure mid-arm circumference (MAC) and mid-arm muscle circumference (MAMC). Triceps skinfold measurements can be used to estimate fat stores. There is evidence that ultrasound may also become a useful tool for monitoring muscle mass (e.g., used at bedside to measure the quadriceps).
Body mass index (BMI) correlates well with body fat, morbidity, and mortality. However, BMI could incorrectly categorize highly muscled patients or those with edema or ascites as having excess fat stores. The BMI is a reasonable means of estimating recommended weights. See Table 39.3.
Ideal body weight is not appropriate for setting weight goals as it does not reflect standard heights and weights.
TABLE 39.3IBW and BMI
IBW Ideal body weight | IBW Men (metric) = 48 kg. for first 152.4 cm of height + 1.1 kg for each additional cm. IBW Men (US) = 106# for first 5 feet of height + 6 # for each additional inch IBW Women (metric) = 45 kg. for first 152.4 cm of height + 0.9 kg for each additional cm. IBW Women (US) = 100# for first 5 feet of height + 5# for each additional inch Derived from 1943 standard height/weight insurance tables—IBW included a component of frame size and height was measured while wearing 1” heels. IBW came to represent fat-free mass—useful for pharmaceutical and other equations. IBW is not recommended for setting target weight goals as it does not represent current standards for height or weight. | |
BMI Body Mass Index | BMI = Weight(kg)/Height (meter)2 BMI <18.5 kg/m2 = Underweight BMI 18.5–24.9 kg/m2 = reference range BMI 25–29.9 kg/m2 = Overweight BMI 30–34.9 kg/m2 = Obesity 1 BMI 35–39.9 kg/m2 = Obesity II BMI >40 kg/m2 = Obesity III | BMI may overestimate body fat in taller individuals, athletes, or those with muscular builds. BMI may underestimate body fat in those who are shorter or have low muscle mass. |
Maximum recommended weight | Maximum recommended weight (BMI = 24.9 kg/m2) To find corresponding weight: Weight = 24.9 x height (meter)2 Example—for patient 160 cm tall: Recommended maximum weight = Height (meter)2 x 24.9 Recommended maximum weight = (1.60 m)2 x 24.9 = 63.7 kg | |
Minimum recommended weight | Minimum recommended weight (BMI = 18.5 kg/m2) To find corresponding weight: Weight (kg) = 18.5 x height (meter)2 Example—for patient 160 cm tall: Recommended minimum weight = Height (meter)2 x 18.5 Recommended minimum weight = (1.60 m)2 x 18.5 = 47.4 kg | |
PROTEIN
If energy intake is inadequate, catabolism of protein will occur, especially as tumors preferentially metabolize protein. Limiting protein intake has not been shown to interfere with tumor growth and may lead to protein malnutrition and impaired immunity.
Protein turnover in patients with cancer is similar to that of patients with infection or injury; their protein requirements are 50% above those of healthy individuals.
Transport proteins (such as albumin and thyroxin-binding prealbumin) are negative acute-phase proteins that decrease in the presence of inflammation, regardless of a patient’s protein status. Earlier studies incorrectly correlated these proteins with nutritional status, not accounting for their role as inflammatory markers. Dietary history and nitrogen balance measurements are more reliable measures of protein adequacy.
The Society for Critical Care Medicine and the American Society for Parenteral and Enteral Nutrition published guidelines for nutrition support of the critically ill patient in 2016, which includes the recommendation that visceral proteins (such as prealbumin and albumin) not be used as markers of nutrition status.10
NUTRITIONAL REQUIREMENTS
Indirect calorimetry, the preferred method for estimating resting energy expenditure, measures O2 consumed (VO2) and volume of carbon dioxide produced (VCO2) to determine respiratory quotient (RQ). This can be done with a portable metabolic cart operated by a respiratory therapist, or by a handheld device recently approved by the FDA.
There are a variety of recommended calculations for estimating energy, fluid, and protein requirements (Tables 39.4, 39.5, and 39.6). However, formulas that rely on stress and activity factors, or calculations such as >45 kcal/kg “for stress,” have been shown to overestimate requirements. It is important not to overfeed patients with cancer. Overfeeding can increase risk of infection and induce respiratory distress, hyperglycemia, and fatty liver.
The initial calorie goal for critically ill patients should be to meet their estimated resting energy expenditure only.
TABLE 39.4Estimates of Energy Requirements
Patient/Condition | Kilocalories/kga |
Acutely ill; obese (BMI 30–50) | 11–14 (use actual weight) |
Cancer | 25–30 |
Hypermetabolism; malabsorption | 35 |
Stem cell transplant | 30–35 |
a Fever increases energy needs by ~14%/°F.
TABLE 39.5Mifflin-St. Jeor Formula for Estimating Resting Energy Expenditure
Males | REE = 10W + 6.25H − 5A + 5 |
Females | REE = 10W + 6.25H − 5A – 161 |
A, age (y); H, height (cm); REE, resting energy expenditure; W, weight (kg).
TABLE 39.6Recommended Protein Intake for Adults
Disease State | Grams of Protein per Kilogram Body Weight |
Cancer | 1–1.2 |
Cancer cachexia | 1.2–1.5 |
Hematopoietic stem cell transplant | 1.5 |
Renal disease: | |
Obese patient | 1.2 (using actual, not adjusted weight) |
Predialysis GFR 26–55 mL/min | 0.8 |
GFR 10–25 mL/min | 0.6 |
Hemodialysis | 1.1–1.4 |
Peritoneal dialysis | 1.2–1.5 |
CVVHD | 1.5–2 |
Liver disease: | 1–1.5 |
Hepatitis chronic or acute | |
Encephalopathy grade 1 or 2 | 0.5–1.2 |
Encephalopathy grade 3 or 4 | 0.5 |
GFR, glomerular filtration rate.
NUTRITIONAL INTERVENTION
Nutritional counseling by an RD is associated with improvement in the quality of life scores and nutritional parameters, and with success of oral nutritional intervention for oncology patients. Continual reassessment, pharmacologic management, and nutritional counseling can often help avoid costly, risky nutritional support options. See Table 39.7 for nutrition recommendations appropriate for patients who are able to tolerate oral or enteral feedings.
TABLE 39.7Oral Nutrition Recommendations for Patients (by Condition)
Condition | Recommendations |
Diabetes/hyperglycemia | Begin by familiarizing patients with the carbohydrate content of foods. Most men need 45 to 75 g of carbohydrate per meal; most women need 45 to 60 g per meal. If a snack is taken, 15 to 30 g of carbohydrate is usually recommended. (One ounce of bread product, ½ cup cooked starch, ½ cup fruit or juice, and 8 oz. milk each provide ~15 g of carbohydrate) |
Diarrhea | ↓ Lactose, ↓ fat, ↓ insoluble fiber (wheat bran, skin, and seeds of produce), ↑ soluble fiber (peeled fruit, oat bran, guar gum products). Cheese has insignificant carbohydrate/lactose content (<2 g/100 g of cheese) and yogurt is naturally low in lactose |
Early satiety | Calorically dense foods/nutrition products (e.g., medical nutrition beverages with >1.5 kcal/mL); foods such as nuts, cheese, seeds, modular kcal, or protein supplements that can be added to foods without significantly altering the flavor or volume of foods |
Fat malabsorption | ↓ Fat diet and MCT–oil fortified foods/products. A diet with <30% of kcal from fat or <40 g of fat/d may be unrealistic long-term. A trial of pancreatic enzymes and bile acid sequestrants may significantly improve symptoms |
Hypercalcemia of malignancy | Does not respond to low-calcium diet. Often, crucial sources of protein and kcal are limited by such a diet |
Magnesium and potassium status | Refractory hypokalemia is often related to limited Mg stores, even when serum Mg levels are within normal range. Repletion of Mg may help normalize K levels. Increased intake of dietary Mg, K, and P can reduce reliance on supplements without the gastrointestinal side effects associated with supplementation |
Malabsorption | Semi elemental palatable products, trials of pancreatic enzymes, bile acid sequestrants, and medium-chain triglycerides (MCT) may reduce symptoms |
Neutropenia | Many hematopoietic transplant centers emphasize prevention of food-borne illness (verifying temperatures of cooked foods/meats with a thermometer, avoiding unpasteurized dairy products and juices, etc.) rather than strict diets that limit fresh produce, have poor compliance rates, and have no proven benefit in reducing infection rates |
Poor appetite/fatigue | Recommend >5 scheduled feedings/day to lessen dependence on appetite, with use of nutritious liquids for high % of kcal (milk, lactose-treated milk, soup, soy milk, fruit smoothies made with nut butters, or meal replacement beverages). Discourage patients from relying on water alone to meet fluid requirement, as nutritious beverages such as milk contain >90% water and could provide significant nutrition; excess water intake may blunt appetite |
Diet Advancement | Based on expert consensus, clear liquids are not required as the first meal postoperatively. Patients should be allowed solid foods as tolerated. |
NUTRITIONAL SUPPORT
Although tumor growth is stimulated by a variety of nutrients, limiting the nutrients preferred by tumors can be detrimental to the patient. If patients have moderate to severe malnutrition and are unable to meet their nutritional needs with oral intake alone, specialized nutrition support such as parenteral or enteral nutrition is indicated (Figure 39.1). Sample parenteral nutrition recommendations are shown in Table 39.8.
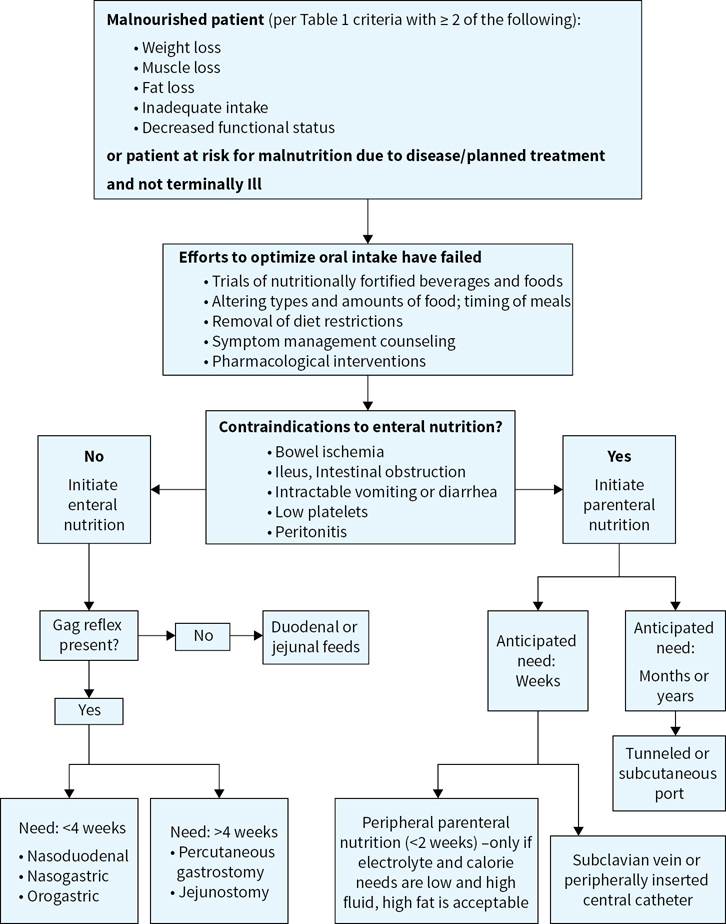
FIGURE 39.1Nutrition support algorithm.
Enteral Nutrition
Reviews of nutritional support practices indicate that parenteral nutrition (PN) is often instituted even when safer, more physiologic enteral nutritional (EN) support could have been provided. The benefits of EN over PN have been well demonstrated, including fewer infections, decreased catabolic hormones, improved wound healing, shorter hospital stay, and maintenance of gut integrity. In other words, if the gut works, use it.
To be successful, EN should be implemented as soon as possible. Surgeons may approve of enteral feeding within 4 hours of placement of gastrostomy tubes and immediately after Jejunostomy (because bowel sounds are not needed). Prophylactic placement of gastrointestinal tubes can considerably reduce weight loss during radiotherapy and may reduce the need for hospitalization due to dehydration, weight loss, or other complications of mucositis.
Many long accepted practices for initiating and monitoring enteral and parenteral nutrition have been overturned recently. See with the 2016 SCCM and ASPEN guidelines for the nutrition support of critically ill patients for the most current recommendations.
Parenteral Nutrition
PN can be beneficial to cancer patients when response to treatment is good but associated nutritional morbidity is high, and when the GI tract is unavailable to support nutrition. Perioperative PN should be limited to patients who are severely malnourished, with surgery expected to prevent oral intake for more than 10 days after surgery.
For the families of cancer patients, feeding is often synonymous with caring. However, end-stage patients who are encouraged to eat and drink as desired may have better quality of life than if specialized nutrition support is provided (which could contribute to incontinence, fluid imbalance, and respiratory compromise). The risks and benefits of PN must be addressed individually and evaluated for each case with patient and family input. In general, PN is not usually indicated in patients with an expected survival of less than 3 months.
COMPLICATIONS OF NUTRITIONAL SUPPORT
Refeeding Syndrome
Feeding after starvation is associated with increased intravascular volume, cardiopulmonary compromise, and plummeting levels of phosphorus, magnesium, and potassium due to the intracellular movement of electrolytes during anabolism. Malnourished individuals with severe weight loss, negligible intake for >7 days, a history of alcoholism, recent surgery, electrolyte losses due to diarrhea, high-output fistulas, or vomiting are especially vulnerable. Initially, no more than 50% of estimated needs (~15 kcal/kg/day and no more than 150 g dextrose/day) are recommended. Because thiamin is an important coenzyme for carbohydrate metabolism, the addition of 100 mg of thiamin for at least the first week of feeding is warranted.
Hypertriglyceridemia
For individuals receiving PN who have preexisting hyperlipidemia and obesity, or for those taking sirolimus, cyclosporine, and other medications associated with increased triglyceride (TG) levels, the goal is to keep TG <400 mg/dL. Ensure that blood is drawn 4 hours after lipid infusion or before lipids are hung, to avoid falsely elevated TG. Lipid dose should be reduced if TG is between 300 mg/dL and 600 mg/dL; however, stopping lipid altogether can worsen liver dysfunction. Five hundred milliliters per week of 20% IVFE can prevent essential fatty acid deficiency in adults.
Parenteral Nutrition–Associated Liver Disease
Hepatic fat accumulation is most common in adults and usually resolves within 2 weeks, even if PN continues. It typically presents within 2 weeks of PN with moderate elevations in serum aminotranferase concentrations. Parenteral nutrition–associated liver disease (PNALD) is usually a complication of overfeeding; it has become less common in the past 10 years, since calories provided via PN have become more appropriate.
Parenteral Nutrition–Associated Cholestasis
Parenteral nutrition–associated cholestasis (PNAC) is primarily a result of excess calories in PN. Overfeeding contributes to fat deposition in the liver by stimulating insulin release, which promotes lipogenesis and inhibits fatty acid oxidation. PNAC occurs most often in children. It is associated with elevated serum conjugated bilirubin (>2 mg/dL) and may progress to cirrhosis and liver failure. Factors unrelated to PN that have been misattributed to PNAC include bacterial and fungal infections.
Fat-free PN formulations have also been implicated in the development of fatty liver, since a high percentage of calories from carbohydrates can lead to fat deposition in the liver. Providing a balance of calories from dextrose and fat seems to decrease the incidence of steatosis, possibly by decreasing hepatic TG uptake and promoting fatty oxidation.
TABLE 39.8Sample Parenteral Nutrition Recommendations
| Infants/Children (3–30 kg) | Adolescents (≥30 kg) | Adults |
Water | 1,500–1,800 mL/m2/d 1,500 mL/kg for first 20 kg and 25 mL/kg for remaining weight | 1,500 mL/m2/d | 1,500 mL/m2/d 35 mL/kg or 1 mL/kcal |
Energy | 70–110 cal/kg/d | 40–60 cal/kg/d | 20–35 cal/kg/d |
Dextrose (3.4 kcal/g for the hydrated form) | |||
Initial | 5%–10% (50–100 g/L) | 5%–10% (50–100 g/L) | 10%–15% (100–150 g/L) |
Advance | 5% (50 g/L) | 5% (50 g/L) | 5%–10% (50–100 g/L) |
Max dextrose oxidation rate | 12–15 mg/kg/min | 5–13 mg/kg/min | 4–5 mg/kg/min |
Max dextrose concentration | 20–35% (200–350 g/L) | 20%–35% (200–350 g/L) | 20%–35% (200–350 g/L) for central access; 10% for peripheral |
Protein | |||
Initial | 1 g/kg/d | 1 g/kg/d | At goal |
Advance | 0.5–1 g/kg/d | 1 g/kg/d | — |
Max | 2–3 g/kg/d | 1.5–2 g/kg/d | 2 g/kg/d |
IVFE | 20% lipid provides 2 kcal/mL. Due to glycerol in fat emulsions, 1 g of fat in 20% emulsions = 10 kcal; ~1 g of fat per 5 mL of 20% IVFE |
|
|
Initial | 1 g/kg/d | 1 g/kg/d | At goal; usually ≥250 mL 20% IVFE for ~30% of total kcal |
Advance | 1 g/kg/d | 1 g/kg/d | — |
Max | 2–3 g/kg/d | 2 g/kg/d | 2 g/kg/d (60% of total kcal) |
Minerals | |||
Sodium | 2–4 mEq/kg/d | 2–3 mEq/kg/d | 1–2 mEq/kg 60–150 mEq/d max 155 mEq/L |
Potassium | 2–3 mEq/kg/d | 1.5–3 mEq/kg/d | 1–2 mEq/kg 40–240 mEq/d max 80 mEq/L |
Magnesium | 0.3–0.5 mEq/kg/d | 0.2–0.3 mEq/kg/d | 8–24 mEq/d |
Calcium | 0.5–2.5 mEq/kg/d | 0.5–1 mEq/kg/d | 10–40 mEq/d max 30 mEq/L |
Phosphorus | 0.5–2 mM/kg/d | 0.5–1.3 mM/kg/d | 20–40 mM/d max 30 mM/L |
Selenium | 2 mcg/kg/d (40 mcg/max) | 2 mcg/kg/d (40 mcg/max) | 40 mcg |
Trace metals and multivitamins | Daily | Daily | Daily |
IVFE, intravenous fat emulsion.
Suggested Readings
1.August DA, Huhmann MB. A.S.P.E.N. clinical guidelines: nutrition support therapy during adult anticancer treatment and in hematopoietic cell transplantation. J Parenter Enteral Nutr. 2009;33(5):472–500.
2.Bischoff-Ferrari HA. Optimal serum 25-hydroxyvitamin D levels for multiple health outcomes. Adv Exp Med Biol. 2008;624:55–71.
3.Boateng AA, Sriram K, Meguid MM, Crook M. Refeeding syndrome: treatment considerations based on collective analysis of literature case reports. Nutrition. 2010;26:156–167.
4.Elliott L, Molseed LL, McCallum PD, Grant B, eds. The Clinical Guide to Oncology Nutrition. 2nd ed. Oncology Nutrition Dietetic Practice Group. Chicago, IL: American Dietetic Association; 2006.
5.Gariballa S. Refeeding syndrome: a potentially fatal condition but remains underdiagnosed and undertreated. Nutrition. 2008;24:604–606.
6.Heaney RP. The vitamin D requirement in health and disease. J Steroid Biochem Mol Biol. 2005;97:13–19.
7.Johnson G, Salle A, Lorimier G, et al. Cancer cachexia: measured and predicted resting energy expenditures for nutritional needs evaluation. Nutrition. 2008;24:443–450.
8.Leser M, Ledesma N, Bergerson S et al Oncology Nutrition for Clinical Practice. Chicago, IL: Academy of Nutrition and Dietetics; 2013.
9.Marian M, Robert S. Clinical Nutrition for Oncology Patients. Sudberry, MA (USA, 01776). Jones & Bartlett Publishers; 2010.
10.McClave SA1, Martindale RG, Vanek VW et al, Guidelines for the Provision and Assessment of Nutrition Support Therapy in the Adult Critically Ill Patient: Society of Critical Care Medicine (SCCM) and American Society for Parenteral and Enteral Nutrition (A.S.P.E.N.).JPEN J Parenter Enteral Nutr. 2009 May-Jun;33(3):277–316.
11.Mehta NM, Corkins, MR, Lyman B et al Defining Pediatric Malnutrition: A paradigm shift toward etiology-related definitions, JPEN 2013 Jul; 37 (4):460–481.
12.Moutzakis M, Prado CMM, Lieffers JR et al A practical and precise approach to quantification of body composition in cancer patients using computed tomography images acquired during routine care, Applied Physiology,Nutrition and Metabolism, 2008; 33(5):997–1006.
13.Mueller CM. The A.S.P.E.N. Adult Nutrition Support Core Curriculum. 2nd ed. Silver Spring, ML: American Society for Parenteral and Enteral Nutrition; 2012.
14.National Cancer Institute: PDQ Hypercalcemia. Bethesda, MD: National Cancer Institute; 2011. Available at: http://cancer.gov/cancertopics/pdq/supportivecare/hypercalcemia/Health Professional. Accessed September 29,2016 .
15.Philips W, Coding for Malnutritionin the Adult Patient: What the Physician Needs to Know. Practical Gastroenterology, Sep 2014. Available at: https://med.virginia.edu/ginutrition/wp-content/uploads/sites/199/2014/06/Parrish-Sept-14.pdf.
16.Ryan, AM, Power DG, Daly L et al Cancer-associated malnutrition, cachexia and sarcopenia: the skeleton in the hospital closet 40 years later, Proceedings of the Nutrition Society 2016;75(2):199–211.
17.Schlein KM, Coulter SP, Best practices for determining resting energy expenditure in critically ill adults. Nutr Clin Pract. 2014 Feb;29(1):44–55.
18.White JV, Guenter P, Jensen G et al, Consensus statement: Academy of Nutrition and Dietetics and American Society for Parenteral and Enteral Nutrition: characteristics recommended for the identification and documentation of adult malnutrition (undernutrition) JPEN J Parenter Enteral Nutr. 2012 May;36(3):275–283.