Chapter Eight
Blackjack
Memorabilia
The exact origin of Blackjack is rather murky; it was not invented by a single person, but apparently evolved from related card games in the 19th century and gained currency during World War I. Blackjack (or “21,” or Vingt-et-Un) exhibits structural similarities to Baccarat, “ ,” Quinze, and also to Trente et Quarante. However, the connection with these games remains historically tenuous.
Transplanted from France to America, it was initially spurned. To heighten interest, casinos awarded special bonuses, one of which was a 10-to-1 payment if the player’s hand comprised the Ace of Spades and either black Jack. While the bonus generally has been discontinued, the name remains—although “21” would be a more logical appellation.
Blackjack does not constitute a game in the usual game-theoretic sense, since one player’s line of play is fixed a priori—the dealer cannot exercise independent judgment or intelligence (we might refer to it as a “one-person game”). Its special appeal lies in its property of being the only form of public gambling where the knowledgeable player is able to obtain a positive mathematical expectation. Unlike Craps and Roulette, Blackjack does possess a memory (the interdependence of the cards) and a conscience (inferior play will inevitably be penalized) and is not democratic (the mental agility and retentiveness of the player are significant factors). These facts have been realized in a qualitative sense by many professional gamblers for nearly a century. In the 1950s, numerical analyses of the Blackjack strategy were performed concurrently by engineers and mathematicians at various engineering firms across the United States. Quantitative results through computer programming were reported by the author in lectures at UCLA, Princeton, and other universities in 1955. The first published strategy (Ref. Baldwin et al.) appeared in 1956. Allan Wilson of San Diego State University programmed a simulation of several hundred thousand hands of Blackjack in 1957, obtaining the most accurate results to that date.
Then, in 1962, Edward O. Thorp (Ref. 1962) published Beat the Dealer, a work instantly extolled as the bible of Blackjack votaries. Here, for the first time, was a comprehensive mathematical treatment of the full range of Blackjack strategies and their underlying probabilities plus the first quantitative synthesis of card-counting systems.
Blackjack has since become the favored pastime in the Nevada gambling emporia and in the resort casinos of the Caribbean area. It is featured as well in casinos throughout South America, Australia, and the Far East. In Europe, the game sometimes rates a less-than-first-class status (although it is featured at the Casino Municipale di Venezia under a sign announcing “Gioco del Blak Jak o 21”).
Rules and Format
There are variations in rules as played in different cities, in different casinos of the same city, and even in a single casino from time to time, at the whim of a gaming manager. In general, however, these various rules are in accord on the principal points and differ only in minutiae. Here we adopt a set of rules that, to the greatest extent possible, reflects the degree of commonality that exists; for the fine-structured regulations, we adhere to those prevailing along the “strip” of Las Vegas.
Specifically, we postulate that the dealer stands on soft 17 (S17), the player is permitted to double down after splitting pairs (DAS), may split pairs three times (SPL3) though Aces but once (SPL1), and is offered the options of Early Surrender (ES) and Late Surrender (LS).1
An illustration of the Blackjack layout is shown in Figure 8-1. From one to seven players compete against the dealer representing the House. A single, conventional deck of cards was used exclusively until the advent of card-counting drove the casinos to develop countermeasures. Now, 4-, 6-, and 8-deck packs predominate (and are dealt from a shoe). A $5 minimum bet and a $3000 maximum are customary but not universal.
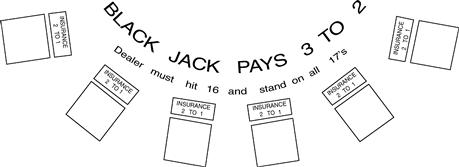
Figure 8-1 The Blackjack layout.
Assumptions
In the mathematics leading to optimal Blackjack strategies, our premise—as the only viable choice—is that of a strictly objective utility function. The mathematical expectation of an event that has probability of success p and probability of failure q is defined as p − q. If, in addition, the event has probability r of remaining unresolved (a tie), only the objective utility function permits the retention of p − q as defining the mathematical expectation. Specifically, in the game of Blackjack it is frequently necessary to select between one event, characterized by (p′, q′), and another, characterized by (p, q, r); for example, standing with a total of 16 or less (which excludes the possibility of a tie) must be compared with the action of drawing a card; the latter strategy includes the possibility of a tie. According to the objective utility function, time is irrelevant, and significant probabilities are calculated on a per-play basis; thus ties are resolved by sharing the probability r equally between probabilities p and q. That is,

so that the game (p, q, r) still exhibits a mathematical expectation of p − q.
A different utility function might emphasize time (i.e., the number of plays to achieve a given goal) but consider the variance to be irrelevant (perhaps because of an immense initial fortune). In such an instance, a tie would be resolved by renormalizing the probabilities p and q. Thus,

Other subjective utility functions could produce yet other values of p′ and q′.
Optimal Strategies
Basic Strategy
With the preceding considerations, expectations by standing or hitting (drawing a card) in each of the 550 initial situations are calculated (the player’s hand comprises one of 55 two-card combinations, the dealer’s up-card one of ten). The greater expectation in each case dictates optimal strategy—here adapted for a multi-deck game. The same procedure is applied for the options of doubling down, splitting, Insurance, and Surrender. These data are then processed to produce the optimal basic strategy displayed in Table 8-1 (Ref. Schlesinger, p. 487). (Where it is significant, the composition-dependent strategy [C-D] is given. Otherwise, the total-dependent strategy [T-D] based on a generic total suffices.)
Table 8-1. Basic Strategy—Multi-Deck, Dealer Stands on Soft 17, Doubling after Split Permitted
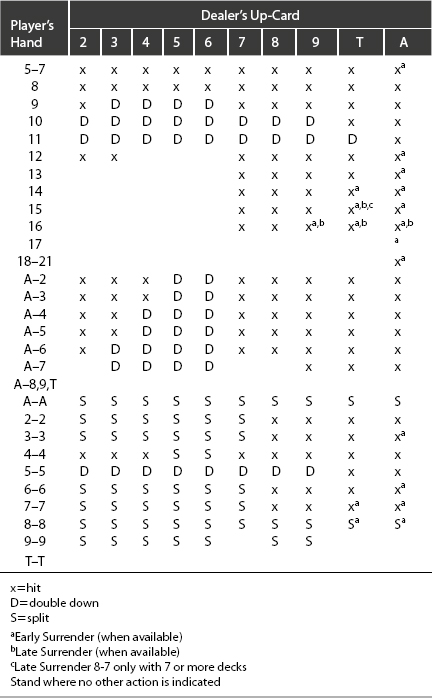
In the column listing the player’s hands, those entries not referring to two specific cards are generic totals—which may represent totals of two or more cards or totals resulting from a pair-split and subsequent draw.
Consolidating the properly weighted individual expectations arising from this strategy yields an overall mathematical expectation of −0.00419. (The virtually extinct single-deck game is susceptible to an expectation of +0.0017 and thereby constitutes the only positive-expectation game offered by the public gaming casinos.)
In addition to the exact strategy for the player’s initial hand, we might compute optimal strategy for some of the remaining 1953 hands2 containing three or more cards, particularly for those hands where the decision is composition-dependent (see Appendix Table D, for example).
The multi-deck game inherently entails lowered mathematical expectations, decreasing with increased number of decks. The advantage of doubling down is reduced with multiple decks, as are the benefits of standing on totals of 12 to 16 against the dealer’s 2 to 6 (owing to the lesser effects of removing lower-valued cards). For a specific example, consider the player with two non-Ts versus a non-T dealer up-card. In this instance, the single-deck probability of drawing a T, or of the dealer having a T as his hole card, is 16/49 = 0.3265+; with eight decks, that probability drops to 128/413 = 0.3099+; in the infinite-deck game, it drops again to 16/52 = 0.3077−. Further, with two or more decks, the advantage of applying a composition-dependent strategy over a total-dependent strategy becomes minuscule. Changes in basic strategy for one and two decks are indicated in Table 8-2.
Table 8-2. Changes from Multi-Deck Strategy
| Single deck | |
| Two decks |
Surrender
Surrender is relinquishing the hand at the cost of one-half the amount wagered. Basic strategy dictates Early Surrender (prior to the dealer checking his hole card) for 16 vs. 9; 14, 15, 16, 7-7, 8-8 vs. T; and 5, 6, 7, 12-17, 3-3, 6-6, 7-7, 8-8 vs. A. This strategy adds an expectation of 0.007 to the player’s game value—for an overall expectation of +0.0087.
Late Surrender (LS)—subsequent to the dealer checking his hole card—is less advantageous to the player, entailing an added expectation of 0.00023. Optimal strategy: surrender 16 vs. 9; T-5, 9-6, 9-7, and T-6 vs. T; 9-7 and T-6 vs. A; and 8-7 vs. T with seven or more decks.
Some casinos, mostly in the Far East, permit Surrender after doubling down. Optimal strategy with this option: surrender hands totaling 12 through 16 vs. 8, 9, T, A; further, Surrender 17 vs. A. The added expectation accruing from this option is 0.005.
Table 8-3 compares the overall expectations from variously sized decks under the rules stated above (doubling allowed on two cards and after splitting; dealer stands on soft 17). (Advantages accruing from the Surrender rule and from bonuses are computed separately.)
Table 8-3. Overall Expectations versus Deck Size

Bonuses
Premiums awarded for “special” hands vary erratically among casinos. The more common ones are listed in Table 8-4 along with their expectations to the player. “Charlies” are 5-, 6-, or 7-card combinations that total 21 or less.
Table 8-4. Various Bonuses
| Bonus | Expected Value |
| Five-card Charlie, pays 1 to 1 | 0.0146 |
| Six card Charlie, pays 1 to 1 | 0.0016 |
| Seven-card Charlie, pays 1 to 1 | 0.0001 |
| Five-card 21, pays 2 to 1a | 0.0020 |
| Six-card 21, pays 2 to 1 | 0.0010 |
| Three 7s, pays 2 to 1 | 0.0003 |
| Three 7s, pays 3 to 1 | 0.0005 |
| 6-7-8, pays 2 to 1 | 0.0003 |
| 6-7-8, same suit, pays 2 to 1b | 0.0001 |
a Alter basic strategy to hit four-card totals of 14 vs. 2; 13 vs. 2, 3, 4, and 6; 12 vs. 4, 5, and 6; soft 19 vs. T and A; and soft 18 vs. 2, 3, and 4.
b Alter basic strategy to hit 6-7 vs. 2.
Insurance and side bets
“Insurance” (wagering at 2 to 1 that the dealer’s hole-card with an A showing is a T)3 and side bets (e.g., Over/Under, Royal Match) constitute negative-expectation bets. The latter permit a separate stake independent of ongoing play. Only through the application of card counting can these options prove of value. (Insurance changes to a positive-expectation bet whenever the number of Ts remaining in the deck comprise more than one-third of all remaining cards.)
Card Counting
Because of fluctuations in the composition of the deck as it is depleted over successive (and dependent) trials, it is intuitively apparent that altering the magnitude of the wager or the strategic decisions or both in accordance with the fluctuations should prove advantageous to the player.
At the onset of each round, there is a probability distribution Fc that describes the player’s expectation, given knowledge of c cards. A theorem, proven by Thorp and Walden (Ref.), states that as c increases, Fc spreads out; therefore, increasing the bet size for positive expectations and betting the minimum for negative expectations improve the player’s overall expectation, E(Fc)—a phenomenon that Thorp and Walden term the “spectrum of opportunity.” It should be noted that the Fc are dependent—when a deck evolves into a favorable (or unfavorable) composition, it tends to retain that structure (at least for the short run).
Card-counting systems that track fluctuations in deck composition can yield player expectations in excess of +0.02.
The foundation of card counting rests on the quantitative effect on the player’s expectation of removing individual cards—referred to as the EOR (Ref. Griffin)—from the deck as the hands are dealt out. Altering the composition of the deck obviously alters the probabilities that underlie the six options (hit, stand, double down, split pairs, Insurance, Surrender).
Table 8-5 details the EOR (Ref. Schlesinger, p. 522) for each rank (under our postulated ground rules but without Surrender). It is immediately apparent that the presence of high-valued cards remaining in the deck favors the player, while low-valued cards favor the dealer.
Table 8-5. Betting EOR values (in %)

Point-count systems assign to each rank a value that approximates the relative EOR for that rank. This value is generally expressed by an integer to accommodate the limitations of human memory. As each card is dealt, the appropriate integer is added in to maintain a running count that reflects the deck’s composition. To apply the running count, it must be normalized to a true count (TC) by dividing by the number of decks (or fraction of a deck) remaining. (TC need only be estimated roughly since the criterion is whether or not it exceeds a particular integer.) Ergo, TC is approximately proportional to the player’s expectation (albeit for both exceptionally low and high TCs, the change in expectation declines from linearity).
The desiderata for an effective point-count system are (1) simplicity, preferably characterized by a single parameter, so that it can be quickly computed and deployed; (2) accuracy, so that its measure reflects the current state of the deck; and (3) equilibrium, so that its values for the full pack sum to zero. With equilibrium, the direction of the pack’s deviation from its initial state is given by the algebraic sign of the running count regardless of the number of cards remaining.
Two measures are applied to assess the worth of a point-count system: betting correlation and playing efficiency.
Betting correlation (BC) is defined as the correlation between the point values of the counting system and the best linear estimates of deck expectation—equivalent to the sum of the product of the respective value assigned to each rank and the concomitant payoff for that rank divided by the square root of the sum of squares of the point-count values (SSPC) and the sum of squares of the EOR values (SSEOR). That is,
 (8-1)
(8-1)
where ρ is the inner product of the point-count values and the EOR values.
The strategic (or playing) efficiency of a card-counting system is defined as the quotient of the expected gain it engenders and the (hypothetical) expected gain achievable with complete knowledge of the remaining cards; Griffin (Ref.) has shown that the total expected game E(n) resulting from appropriate departures from basic strategy with n cards remaining in the deck is approximated by
 (8-2)
(8-2)
where μ is the full-deck expectation from basic strategy and σn is the variance for the mean of an n-card subset of the deck:

σ being the variance of the single-card payoffs. It should be noted from Eq. 8-2 that E(n) increases as n decreases and also as σ increases and as μ decreases. To derive the similar expression for a point-count system, it is assumed that the average payoff for the system and the average payoff for the n-card subset of the deck are bivariate normally distributed with correlation coefficient γ. Then the expected gain F(γ) for the point-count system is approximated by

where μc and σc are the expectation and variance resulting from the point-count application. [F(γ) is identical to E(n) as expressed in Eq. 8-2 with γσc replacing σn.] Strategic efficiency is thus given by F(γ)/E(n) and increases with decreasing n (as the deck is depleted). For values of γ < 1 and μc ≠ 0, efficiency is less than γ; for μc = 0, efficiency = γ.
Some of the more practical and efficient point-count systems applicable to the multi-deck game are listed in Table 8-6. To describe the relative strength of these systems, a particular measure, SCORE (standard comparison of risk and expectation),4 can claim the greatest expedience. SCORE provides a rating number—the expected hourly return in dollars—that embodies an initial bankroll ($10,000), a specific risk of ruin [13.5%, the value derived from the Kelly criterion without bet sizing (pp. 61–62)], a representative bet spread (1 to 12), the number of decks in play (6), a typical deck penetration (through 5 of the 6 decks), and the number of rounds dealt per hour (100); for completeness, it also stipulates four players at the Blackjack table. Although any of these seven parameters can be changed, with a concomitant change in the SCORE rating (a modified SCORE), the ordinality of the point-count-system rankings remains unchanged.
Table 8-6. Point-Count Systems
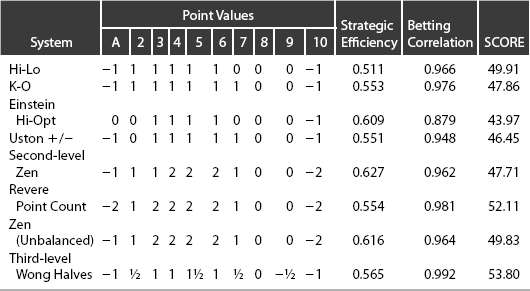
Table 8-6 presents the SCORE with these parameters for eight-count-systems under our postulated rules (plus Late Surrender). The highest SCORE is not, per se, the sole gauge of the “best” system. Ease of application, for example, would, for most players, favor a first-level system over higher-level counts.
The Hi-Lo system provides an optimal combination of simplicity and effectiveness and is employed more extensively than other systems. Devised in 1963 by Harvey Dubner, it was also developed by Julian Braun as the Braun plus–minus system. Eq. 8-1 computes its betting coefficient as

since ρ = 1(0.381 + 0.434 + 0.568 + 0.727 + 0.412) − 4(−0.512) − 1(−0.579) = 5.150. Playing efficiency for the Hi-Lo system is 0.511.
For the amount wagered to be proportional to the player’s (favorable) expectation, the prescribed bet β as a function of the TC is specified by
 (8-3)
(8-3)
where [X] signifies the largest half-integer contained in X. The quadratic term arises from the contribution of the Insurance wager. Table 8-7 lists the Hi-Lo bet spread in accordance with Eq. 8-3 for the multi-deck game.
Table 8-7. Bet Spread for the Hi-Lo Point Count

Unbalanced systems render conversion to TCs unnecessary; their Ace values consequently cannot be 0, but instead are a function of the number of decks in the game (e.g., K-O, Zen). Systems beyond the second level intrude upon the desideratum of simplicity and demand exceptional feats of mental agility.
Appendix Tables C(A) through C(J), originally computed by Griffin (Ref.) and refined by Schlesinger (Ref., pp. 506–515) and “Zenfighter,” detail the full-deck(s) EORs for Player’s hand versus Dealer’s up-card. Each entry, in percent, represents the difference in probabilistic gain between drawing a card and standing—or between doubling and either hitting or standing, or between splitting and either hitting or standing. The quantities m2, m6, and m8 represent the full-pack favorability factor for 2, 6, and 8 decks, respectively.
Illustratively, consider the example of T-6 versus T. Appendix Table C(I) indicates that the full-pack favorability for two decks (m2) is −0.19. The three EORs—for two Ts and a 6—are 2(1.12) and 1.64, which sum to 3.88. For n decks with k cards removed, this figure must be multiplied by 51/(52n − k), which for n = 2 and k = 3, equals 51/101. Thus (51/101)(3.88) = 1.96 (the adjusted EOR). Adding this number to the full-pack favorability results in +1.77. Therefore, correct strategy dictates drawing a card—as it does for this combination with six and eight decks.
If, as a counter example, Player’s 16 were composed of T-5-A (again vs. Dealer’s T), the four EORs are 2(1.12), −2.57, and −0.50, which total −0.83. For two decks with four cards removed, we adjust this figure by 51/100, whence (51/100)(−0.83) = −0.42, and optimal strategy calls for standing. A more detailed list of Player’s 16 vs. T is computed in Appendix Table D.
The Insurance wager can also be resolved by EOR calculations—for each rank A through 9, the EOR is 1.81, while Ts engender an Insurance EOR of −4.072. The full-pack favorability is, of course, −1/13 (for any number of decks). With seven non-Ts and one T dealt out of two decks, the eight EORs sum to 7(1.81) − 4.072 = 8.60. Multiplying by 51/96 equals 5.30, and optimal strategy calls for the player to accept the Insurance wager. (In this instance, less mental effort is required to divide the number of non-Ts by the number of Ts exposed.)
In addition to determining the optimal wager, point-count systems indicate advantageous changes in strategy—i.e., in hitting/standing, pair-splitting/doubling/Insurance/Surrendering decisions. For low (or negative) True Counts, with bets of 1 or 2 units, deviations from basic strategy offer the only significant means to further potential gain. For high TCs, with bets in the range of 12 to 16 units, bet variations are considerably more significant than strategy variations.
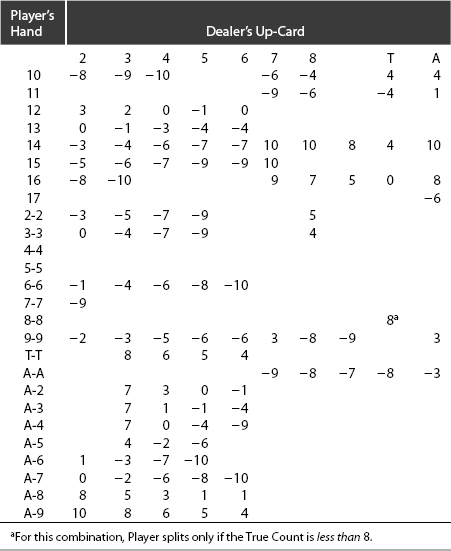
Table 8-8 (Ref. Wong) displays the Hi-Lo TC strategy numbers. player should stand (or split or double down) when the TC is equal to or greater than the number given; he should hit (and not split or double down) for a TC less than the number given.
Table 8-8. Hi-Lo True Count Strategy Numbers (Multi-deck)
Courtesy Stanford Wong
The preponderant majority of the card combinations relating to these numbers (116 in all) occurs infrequently and with a modest concomitant gain. A more expeditious procedure, suggested by Don Schlesinger (Chapter 5 in Ref.), focuses on 18 card-combinations (the “Illustrious 18”) that can claim some 80 to 85% of the gain arising from strategy changes. Further, 90% of this gain is concentrated in 12 card combinations—the “top 12” that are listed in Table 8-9. It should be noted that the Insurance wager alone accounts for 30% of the gain from all 116 strategy changes (and for some 28% of the gain from the Illustrious 18).
Table 8-9. The Top 12 Hi-Lo Strategy Changes
| Hand | Probability of Occurrence |
| Insurance | 0.077 |
| 16 vs. T | 0.035 |
| 15 vs. T | 0.035 |
| T-T vs. 5 | 0.0073 |
| T-T vs. 6 | 0.0073 |
| T vs. T | 0.0115 |
| T vs. 3 | 0.0075 |
| 12 vs. 2 | 0.0075 |
| 11 vs. A | 0.0025 |
| 9 vs. 2 | 0.0028 |
| T vs. A | 0.0020 |
| 9 vs. 7 | 0.0028 |
A similar economy can be instituted with regard to the Surrender option. Table 8-10 (Ref. Wong) displays the Hi-Lo TC strategy numbers for Early Surrender (S17, DAS).
Table 8-10. Hi-Lo TC Numbers for Early Surrender
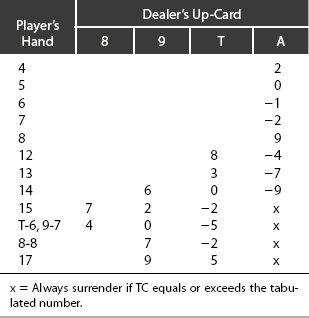
Courtesy Stanford Wong
Limiting the options to four hands forfeits less than 10% of the possible gains. These four are listed in Table 8-11. An additional gain of 0.00121 is thereby added to the basic-strategy surrender value of 0.00067—for a total gain of 0.00188.
Table 8-11. Hi-Lo Surrender TCs
| Hand | Probability of Occurrence | TC |
| 14 vs. 10 | 0.0202 | 3 |
| 15 vs. 10 | 0.0202 | 0 |
| 15 vs. 9 | 0.0055 | 2 |
| 15 vs. A | 0.0038 | 1 |
Courtesy of Stanford Wong
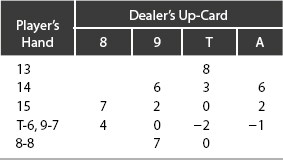
Late Surrender is more commonly available and entails fewer decision points—as shown in Table 8-12.
Table 8-12. Hi-Lo TC Numbers for Late Surrender
Shuffle Tracking (Ref. Hall)
Virtually every casino skimps on the amount of shuffling necessary to produce a randomly ordered pack of cards (Ref. Hannum) since thorough shuffling delays the game more than the casino is willing to tolerate and since only a minute fraction of Blackjack players are sufficiently astute to exploit a nonrandom pack.
Generally, with multi-deck packs, cards are divided into four piles with shuffling between groups of two. Thus a subset of cards has zero probability of ending up in a certain portion of the shuffled pile. At the conclusion of a round (when approximately 1/4 of the pack remains in the shoe) and before the shuffle ensues, the clump of unplayed cards is typically broken into two and “plugged” into two different locations in the discard pile. This clump obviously reflects the negative of the final running count.
Most shuffles are effected between the two quarters that comprise the top half of the played cards and between the two quarters that comprise the bottom half. Whenever two clusters of cards are shuffled together, the estimated count of the combined cluster is, of course, the sum of the counts in each cluster.
It has been calculated that shuffle-tracking yields an overall accuracy in all regions of the multi-deck pack greater than the accuracy of TCs halfway through the pack. On average, depending on the nature of the shuffle, shuffle-tracking offers an increased expectation on the order of that obtained from first-level card-counting systems. In those casinos that repeatedly follow an identical shuffle procedure, it is of value to develop a “shuffle profile” and approach the Blackjack tables “prearmed.”
Ace Prediction
Tracking and predicting the location of one or more Aces is both less complex and more expedient than a general shuffle-tracking system. A procedure first outlined by Thorp and Walden (Ref.) and practicalized by David McDowell (Ref.) consists of noting the “key card”—defined as that card immediately preceding the “target Ace” after the players’ hands have been “scooped up” by the dealer (after paying the winning bets) and returned to the discard pile. This process is prescribed so as to preserve the original order of the cards, thus enabling reconstruction of the hands from the discard tray should a dispute later arise.
Empirical data indicate that, in a one-riffle shuffle, two initially adjoining cards will most likely—probability 0.69—be separated by one intervening card in the next round dealt; with probability 0.18, the two adjoining cards will remain adjoining. In a two-riffle shuffle, the most likely event is for three cards to intervene between two neighboring cards—probability 0.38. One- and two-card separations occur with probabilities 0.13 and 0.18, respectively.
When the first card of a player’s hand is an Ace, his expected gain from that hand, averaged over all Dealer up-cards, is 0.51. However, this figure is achievable only with a 100%-accurate prediction. Given a two-riffle shuffle, a more realistic prediction value is 38%—resulting in an expected gain of 0.38 × 0.51 = 0.194. Ergo, by applying this Ace-prediction function and by increasing his bet-size accordingly, the player’s overall expectation is increased from −0.00419 to +0.1898.
Side Bets
Usually side bets entail limits on allowable wagers and are resolved independent of the ongoing play.
Over/Under
Here, the player may wager that his initial two cards total either over 13 or under 13. Aces are counted as 1s (even when paired with a T). A total of exactly 13 loses for either bet.
The player’s multi-deck expectation is −0.0656 for the Over bet and −0.1006 for the Under bet (averaged over all the dealer’s up-cards). Two-card totals greater and less than 13 occur with probabilities 0.4672 and 0.4497, respectively—leaving 0.0831 for the probability of an exact total of 13.
Jake Smallwood (Ref.) has devised a “crush count” to exploit this option: A and 2 are each counted +2; 3 is counted +1; and 9 and T are counted −1. An average expectation of +0.024 results from betting Over with card counts ≥3 and Under with card counts ≤ −4.6.
Royal Match, Single Deck
The player is paid 3 to 1 if his initial cards are of the same suit and 10 to 1 for a same-suited King and Queen (the Royal Match). There are  = 312 same-suited pairs including the four K-Q matches. Hence the player’s expectation for this wager is −0.038−. With multiple decks, the expectation is yet lower.
Arnold Snyder (Ref.) has proposed a facile system to identify those deck compositions that produce a positive expectation: Whenever m = seven cards of a suit have been dealt out, while at least one of the other three suits has lost no cards, the bet offers a positive expectation of 0.01 to 0.03 (depending on the number of K-Q pairs remaining and on the distribution of the two other suits). If one suit has been depleted by m = eight cards with no cards dealt out from at least one other suit, the player’s expectation ranges from 0.03 to 0.10. With m = nine cards dealt out from one suit and zero cards from a second suit, the player’s expectation extends from about 0.06 to 0.20.
The probabilities of these events are expressed by

where n = m + 0 + a + b. [a and b represent the number of cards depleted from the third and fourth suits.] For m = 7, 8, and 9, P(m) = 1.7 × 10⁻³, 5.0 × 10⁻⁴, and 9.0 × 10⁻⁶, respectively. Associated expected values are 0.0211, 0.0439, and 0.0868.
Blackjack Variations
Numerous other blackjack variants have aspired to popularity; most have attracted only transient interest. The few exceptions follow.
Full Disclosure
As an illustration of the efficacy of the knowledge of undisclosed cards, we consider the game of Blackjack played under the rule that both Dealer cards are exposed. The optimal basic strategy then changes markedly from that applicable under the conventional blackjack format. Applying this strategy, displayed in Appendix Table E, results in a mathematical expectation of +0.099. Appendix Table F details the individual expectations for each of dealer’s 55 possible hands.
As a practical casino game, the House would levy a 10% charge on all winning bets.
Double Exposure
This game, under the name “Zweikartenspiel,” was initially proposed by the author in the first edition of this work. It has since, with minor modifications, been installed in several gambling emporia.
Dealer’s cards are dealt face-up. In compensation, Dealer wins ties except for Player natural versus Dealer natural—which Player wins for an even payoff. Basic strategy for the multi-deck game (four or more decks are standard) is displayed in Appendix Table G (Ref. Wong, Tables 72 and 73)—with Dealer standing on soft 17, resplitting of pairs not permitted, and doubling allowed only on the first two cards. More frequent splitting and doubling (an obvious consequence of Dealer’s visible stiff hands) serves to counterbalance the loss of ties.
Player expectation under this format equals −0.002. Were resplitting allowed, an additional positive expectation of 0.0030 would ensue. Allowing doubling down after splitting adds another 0.002—for an overall expectation of +0.003.
The EORs in Double Exposure, shown in Table 8-13, indicate an incremental unit of TC of about 0.007 compared to about 0.005 for standard Blackjack. As these values imply, this game sustains considerably greater fluctuations. Elimination of the 3-to-2 Blackjack payoff accounts for the lower EOR for the Ace.
Table 8-13. Double Exposure EORs (%)

The Hi-Lo card-counting system is equally well suited to Double Exposure as it is to conventional Blackjack. Appendix Table H displays the corresponding TC strategy numbers based on the six-deck game (Ref. Wong, 1994, Tables 75 and 76). Player should stand (or double or split) at a TC equal to or greater than the number given for the specified card-combination. For Insurance, the strategy number is 3.0—although greater accuracy is derived from using the usual ratio of non-Ts to Ts (<2 to 1 indicating a positive expectation).
Blackarat
In this variation (suggested by the author), Player receives two cards whose ranks are added modulo 10 to define their value. Dealer receives two cards, one face-up, the other face-down. Dealer’s total is also computed modulo 10. Dealer has no drawing options.
Player may exercise the option of drawing one (and only one) additional card. player may also split any pair (at the cost of another bet) and play each hand separately.
A hand of 9-9 immediately receives a bonus, after which play continues as prescribed.
Dealer’s and Player’s totals are compared (after Dealer’s hole card is turned over); higher total wins the wager—with the exception that Dealer’s hand of 0-0 (two ten-valued cards) automatically wins. Player may buy Insurance against this possibility as in conventional blackjack.
Ties (pushes) are “no bet.”
Player’s optimal hit/stand/split-pair strategies and the consequent mathematical expectations are indicated in Appendix Tables I and J for games with a single deck and with six decks, each paying 5 to 1 for the 9-9 bonus. In the former case, Player’s expectation is −0.00478. In the latter case, the expectation improves slightly to −0.00437. Changes in expectation for different payoff bonuses are listed separately in Appendix Table K.
3-Way Blackjack (suggested by the author)
Initially, player places his wager and is also afforded the option of a Blackjack side bet at an amount up to one-fifth the original wager. Player is then dealt three cards (the side bet pays off if any two of them can form a Blackjack). Dealer receives two cards, one face-up, one face-down.
Certain three-of-a-kind hands are awarded an instant pay bonus—as detailed in Table 8-14.
Table 8-14. 3-Way Blackjack Bonuses
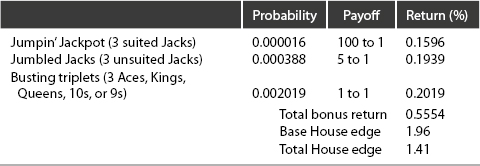
Should the sum of Player’s three cards exceed 26 with Aces counted as 11, Player busts and loses his main wager. However, if Player has made the side bet, and if his hand contains a Blackjack, that bet is paid at 6 to 1 even if the hand busts.
When the sum of Player’s three cards equals 26 or less, Player discards one of the three and continues the play, as in conventional Blackjack, with a two-card hand. [The usual options for splitting, doubling, Insurance, and Surrender apply.]
Optimal strategy for discarding from the three-card hand is displayed in Table 8-15. The hand can be partitioned into two or three distinct two-card hands (or a single pair from three-of-a-kind). Each two-card total for a particular Dealer’s up-card is specified by a numerical rating in this table. That holding showing the highest rating should be retained for the playing phase, and the third card discarded.
Table 8-15. 3-Way Blackjack Decision Matrix
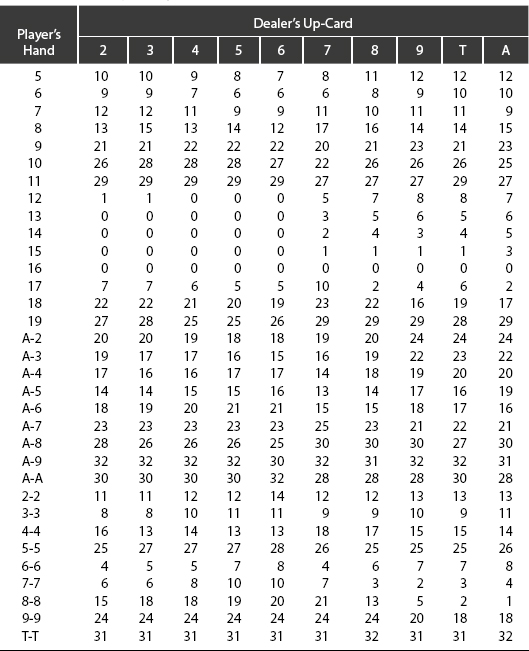
Courtesy of Norman Wattenberger, Casino Vérité
Against Player’s optimal strategy and with the bonuses as specified, the House advantage is 1.41%.
Spanish 21
Pip tens are removed from the pack (usually six or eight decks), leaving 48 cards per deck. In partial compensation, certain favorable rules are offered: (1) Player’s Blackjack and Player’s 21 always win; (2) five-card 21 pays 3 to 2, six-card 21 pays 2 to 1, seven-card 21 pays 3 to 1; (3) 6-7-8 or 7-7-7 of mixed suits, same suit, or spades pays 3 to 2, 2 to 1, and 3 to 1, respectively; and (4) Player may Surrender after doubling, forfeiting his original bet; this option is referred to as “double-down rescue.”
Basic strategy (Ref. Shackleford, Spanish 21) differs appreciably from that of conventional Blackjack. Player’s expectation for Spanish 21 (Dealer S17) is −0.0004. Potential returns, however, are insufficient to warrant investment of additional memorization.
No Bust 21
Up to eight decks are deployed for this game, with two jokers added to each deck. A hand of two jokers defines a “natural” that pays 2 to 1 (a natural for both Player and Dealer constitutes a tie). A joker paired with any other card is counted as 21 (Ref. Shackleford, No Bust 21—Rules).
As per the eponymous feature of the game, Player does not automatically lose if his total exceeds 21; in that instance, he ties if Dealer exceeds 21 by a greater amount. Player loses if his total is greater than Dealer’s total when both exceed 21.
Basic strategy is mostly identical to that of conventional blackjack, with minor differences that can be ignored with minimal penalties. Overall expectation for No Bust 21 is −0.0189 (for the six- or eight-deck game).
Blackjack Switch
In this variant Player places bets of equal size on each of two hands (dealt face-up) and is permitted to interchange the second cards dealt to each hand. Dealer total of 22 ties any player total of 21 or less (but loses to a Player blackjack). Conventional basic strategy accommodates this game with few exceptions. Player’s expectation equals −0.0018 with six decks and −0.0016 with eight decks (Ref. Shackleford, Blackjack Switch).
Grayjack
Lastly, we have contrived a simplified version of Blackjack, termed “Grayjack,” Here, the deck is comprised of but 13 cards: 1 Ace, 2 Twos, 2 Threes, 2 Fours, 2 Fives, and 4 Sixes. Each card is accorded its face value except for the Ace, which is valued as 1 or 7, at player’s discretion. Two cards are dealt to Player and Dealer, one of Dealer’s cards being face-down. The object of the game for player is to obtain a numerical total greater than dealer’s and less than or equal to 13. A sum exceeding 13 automatically loses. Doubling down with any original two-card hand is permitted, as is splitting of any initial pair. Grayjack is defined by the Ace and a Six, and, when dealt to player, is paid 3 to 2 (when Dealer’s up-card is the Ace, the option of “Insurance” is offered against the hole-card’s being a Six with a payoff of 2 to 1). Dealer is constrained to draw with totals of ten and less and to stand with 11, 12, and 13. the Ace must be valued as 7 if thereby Dealer’s hand totals 11 through 13, but not 14 or above. Player may draw or stand at each instant (with totals of 13 or less) at his discretion.
Optimal strategy and game expectation are readily computed owing to the reduced size of the deck. These calculations are left as an exercise for the interested reader.
Pooled Resources
In Blackjack, only a modest advantage attends the pooling of resources among the m players opposing the dealer. The win–lose correlation coefficient between any two players in the same game is about 0.5; that is, discounting ties, two players will incur the same result (win or lose) 75% of the time and opposite results 25% of the time. Thus, the effective bankroll Zeff, for m cooperating players, is approximately (cf. Eq. 3-12)

where Zi is the initial fortune of the ith player. For seven players, each with an initial bankroll of 1000, the effective bankroll is

REFERENCES
Baldwin Roger R, Cantey Wilbert E, Maisel Herbert, Mcdermott James P, (1956). The Optimum Strategy in Blackjack. Journal of the American Statistical Association.51(275):429–439.
Braun Julian H, (1974). Comparing the Top Blackjack Systems. Gambling Quarterly.:22–23 [Fall/Winter 54–55].
Griffin Peter, (1999). The Theory of Blackjack. 6th ed. Huntington Press.
Hall, Michael R., “The Blackjack Shuffle-Tracking Treatise,” 1991, www.bjmath.com/bjmath/playing/tracking.htm.
Hannum Robert C, (2000). Casino Card Shuffles: How Random Are They?. In: Finding the Edge: Mathematical Analysis of Casino Games. Reno: Institute for the Study of Gambling and Commercial Gaming, University of Nevadu;: 33–55. [July].
McDowell David, (2004). Blackjack Ace Prediction. Spur of the Moment Publishing.
Revere Lawrence, (1971). Playing Blackjack as a Business. Lyle Stuart.
Roberts Stanley, (1984). The Gambling Times Guide to Blackjack. Gambling Times.
Schlesinger Don, (2005). Blackjack Attack. 3rd ed. RGE Publishing Ltd.
Shackleford, Michael, “No Bust 21-Rules,” 2006, www.wizardofodds.com/nobust21.
Shackleford, Michael, “Spanish 21,” 2007, www.wizardofodds.com/spanish21.
Shackleford, Michael, “Blackjack Switch,” 2009, www.wizardofodds.com/blackjackswitch.
Smallwood, Jake, “The Crush Count,” Blackjack Monthly, March 1990.
Snyder Arnold, (2006). The Big Book of Blackjack. Cardoza Publishing.
Thorp Edward, (1961). A Favorable Strategy for Twenty-One. Proceedings of the National Academy of Science, USA.47(1):110–112.
Thorp Edward, (1962). Beat the Dealer. Blaisdell Publishing [revised edition, Random House, 1966.]
Thorp Edward O, Walden WE, (38; Walden, 1973). The Fundamental Theorem of Card Counting. Internal. J. Game Theory.2(2):109–119.
Uston Ken, (1986). Ken Uston on Blackjack. Barricade Books.
Wilson Allan, (1965). The Casino Gambler’s Guide. Harper and Row.
Wong Stanford, (1994). Professional Blackjack. Pi Yee Press.
Bibliography
Andersen Ian, (2005). Burning the Tables in Las Vegas. 2nd ed. Huntington Press.
Blackwood Kevin, (2005). Play Blackjack Like the Pros. HarperCollins.
Brisman Andrew, (1999). American Mensa Guide to Casino Gambling. Sterling.
Gordon, Edward, “Optimum Strategy in Blackjack—A New Analysis,” Claremont Economic Papers, No. 52, January (1973).
Griffin Peter, (1976). The Rate of Gain in Player Expectation for Card Games Characterized by Sampling without Replacement and an Evaluation of Card Counting Systems. In: Eadington William R, ed. Gambling and Society. Charles Thomas Publishing Company.
Griffin, Peter, “Use of Bivariate Normal Approximations to Evaluate Single Parameter Card Counting Systems in Blackjack,” Second Annual Conference on Gambling, June 1974.
Griffin Peter, (1976). On the Likely Consequences of Errors in Card Counting Systems. Mathematics Department, Sacramento State University.
Hanson James N, (1974). Nonlinear Programming, Simulation, and Gambling Theory Applied to Blackjack. Computer and Information Science Department, Cleveland State University [June].
Millman Martin H, (1983). A Statistical Analysis of Casino Blackjack. American Mathematics Monthly.90(7):931–936.
Vancura Olaf, Fuchs Ken, (1998). Knockout Blackjack. Huntington Press.
Wolfe D, (2002). Distinguishing Gamblers from Investors at the Blackjack Table. In: Schaeffer Jonathan, Müller M, Jornsson Y, eds. Computers and Games, LNCS 2883. Springer-Verlag: 1–10. .
1 This concept was first displayed publicly in 1958 by the Continental casino in Manila and is currently in force in other Far East gambling houses such as the Casino de Macao as well as in Las Vegas.
2 For hands comprising 2, 3, 4, 5, 6, 7, 8, 9, 10, and 11 cards, there are, respectively, 55, 179, 336, 434, 426, 319, 175, 68, 15, and 1 possible combinations (for a total of 2008). Of the 179 three-card combinations, 66 constitute hard totals from 12 to 16. Each dealer’s hand (single-deck game), composed of from two to nine cards, is one of 48,532 possible combinations.
3 Appropriation of the word “insurance” to describe this wager must be classed as a stroke of genius. The word implies that high-total hands, such as those comprised of two Ts, should be insured to protect their value, whereas low-total hands are not worthy of being insured. Such “reasoning,” contrary to an objective appraisal, leads the susceptible player into increasing the “House Take.”
4 Devised by Don Schlesinger (Ref.).