CHAPTER 2
Precedent Transactions Analysis
Precedent transactions analysis (“precedent transactions” or “precedents”), like comps, employs a multiples-based approach to derive an implied valuation range for a given company, division, business, or collection of assets (“target”). It is premised on multiples paid for comparable companies in prior M&A transactions. Precedent transactions has a broad range of applications, most notably to help determine a potential sale price range for a company, or part thereof, in an M&A, capital markets, or restructuring transaction.
The selection of an appropriate universe of comparable acquisitions is the foundation for performing precedent transactions. This process incorporates a similar approach to that for determining a universe of comparable companies. The best comparable acquisitions typically involve companies similar to the target on a fundamental level (i.e., sharing key business and financial characteristics such as those outlined in Chapter 1, see Exhibit 1.3).
As with trading comps, it is often challenging to obtain a robust universe of truly comparable acquisitions. This exercise may demand some creativity and perseverance on the part of the banker. For example, it is not uncommon to consider transactions involving companies in different, but related, sectors that may share similar end markets, distribution channels, or financial profiles. As a general rule, the most recent transactions (i.e., those that have occurred within the previous two to three years) are the most relevant as they likely took place under similar market conditions to the contemplated transaction. In some cases, however, older transactions may be appropriate to evaluate if they occurred during a similar point in the target’s business cycle or macroeconomic environment.
Under normal market conditions, precedents tend to provide a higher multiple range than trading comps for two principal reasons. First, buyers generally pay a “control premium” when purchasing another company. In return for this premium, the acquirer receives the right to control decisions regarding the target’s business and its underlying cash flows. Second, strategic buyers often have the opportunity to realize synergies, which supports the ability to pay higher purchase prices. Synergies refer to the expected cost savings, growth opportunities, and other financial benefits that occur as a result of the combination of two businesses.
Potential acquirers look closely at the multiples that have been paid for comparable acquisitions. As a result, bankers and investment professionals are expected to know the transaction multiples for their sector focus areas. As in Chapter 1, this chapter employs a step-by-step approach to performing precedent transactions, as shown in Exhibit 2.1, followed by an illustrative analysis for ValueCo.
| Step I. | Select the Universe of Comparable Acquisitions |
| Step II. | Locate the Necessary Deal-Related and Financial Information |
| Step III. | Spread Key Statistics, Ratios, and Transaction Multiples |
| Step IV. | Benchmark the Comparable Acquisitions |
| Step V. | Determine Valuation |
EXHIBIT 2.1 Precedent Transactions Analysis Steps
SUMMARY OF PRECEDENT TRANSACTIONS ANALYSIS STEPS
- Step I. Select the Universe of Comparable Acquisitions. The identification of a universe of comparable acquisitions is the first step in performing precedents. This exercise, like determining a universe of comparable companies for trading comps, can often be challenging and requires a strong understanding of the target and its sector. As a starting point, the banker typically consults with peers or senior colleagues to see if a relevant set of comparable acquisitions already exists internally. In the event the banker is starting from scratch, we suggest searching through M&A databases, examining the M&A history of the target and its comparable companies, and reviewing merger proxies of comparable companies for lists of selected comparable acquisitions disclosed in the fairness opinions. Equity and fixed income research reports for the target (if public), its comparable companies, and overall sector may also provide lists of comparable acquisitions, including relevant financial data (for reference purposes only).
As part of this process, the banker seeks to learn as much as possible regarding the specific circumstances and deal dynamics for each transaction. This is particularly important for refining the universe and, ultimately, honing in on the “best” comparable acquisitions.
- Step II. Locate the Necessary Deal-Related and Financial Information. This section focuses on the sourcing of deal-related and financial information for M&A transactions involving both public and private companies. Locating information on comparable acquisitions is invariably easier for transactions involving public companies (including private companies with publicly registered debt securities) due to SEC disclosure requirements. For competitive reasons, however, public acquirers sometimes safeguard these details and only disclose information that is required by law or regulation. For M&A transactions involving private companies, it is often difficult—and sometimes impossible—to obtain complete (or any) financial information necessary to determine their transaction multiples.
- Step III. Spread Key Statistics, Ratios, and Transaction Multiples. Once the relevant deal-related and financial information has been located, the banker is prepared to spread each selected transaction. This involves entering the key transaction data relating to purchase price, form of consideration, and target financial statistics into an input page, where the relevant multiples for each transaction are calculated. The key multiples used for precedent transactions mirror those used for comparable companies (e.g., enterprise value-to-EBITDA and equity value to-net income). As with comparable companies, certain sectors may also rely on other metrics to derive valuation (see Chapter 1, Exhibit 1.33). The notable difference is that multiples for precedent transactions often reflect a premium paid by the acquirer for control and potential synergies. In addition, multiples for precedent transactions are typically calculated on the basis of actual LTM financial statistics (available at the time of deal announcement).
- Step IV. Benchmark the Comparable Acquisitions. As with trading comps, the next level of analysis involves an in-depth study of the selected comparable acquisitions so as to identify those most relevant for valuing the target. As part of this benchmarking analysis, the banker examines key financial statistics and ratios for the acquired companies, with an eye toward those most comparable to the target. Output pages, such as those shown in Exhibits 1.53 and 1.54 in Chapter 1, facilitate this analysis. Other relevant deal circumstances and dynamics are also examined.
The transaction multiples for each selected acquisition are linked to an output sheet where they can be easily benchmarked against one another and the broader universe (see Exhibit 2.2). Each precedent transaction is closely examined as part of the final refining of the universe, with the best comparable transactions identified and obvious outliers eliminated. Ultimately, an experienced sector banker is consulted to help determine the final universe.
- Step V. Determine Valuation. In precedent transactions, the multiples of the selected comparable acquisitions universe are used to derive an implied valuation range for the target. The banker typically uses the mean and median multiples from the universe as a guide to establish a preliminary valuation range for the target, with the high and low ends also serving as reference points. These calculations often serve as the precursor for a deeper level of analysis whereby the banker uses the multiples from the most relevant transactions to anchor the ultimate valuation range. Often, the banker focuses on as few as two or three of the most similar transactions. Once the chosen multiples range is finalized, the endpoints are multiplied by the target’s appropriate LTM financial statistics to produce an implied valuation range. As with trading comps, the target’s implied valuation range is then given a sanity check and compared to the output from other valuation methodologies.
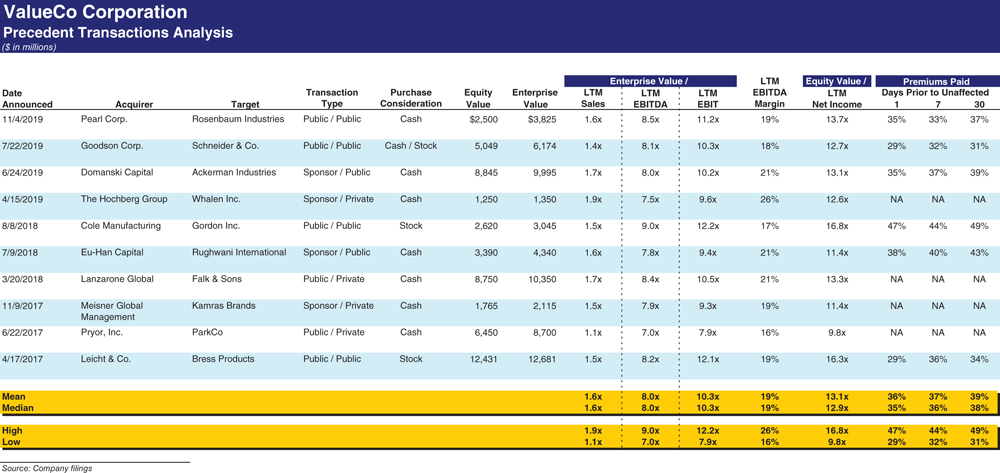
EXHIBIT 2.2 Precedent Transactions Analysis Output Page
STEP I. SELECT THE UNIVERSE OF COMPARABLE ACQUISITIONS
The identification of a universe of comparable acquisitions is the first step in performing precedents. This exercise, like determining a universe of comparable companies for trading comps, can often be challenging and requires a strong understanding of the target and its sector. Investment banks generally have internal M&A transaction databases containing relevant multiples and other financial data for focus sectors, which are updated as appropriate for newly announced deals. Often, however, the banker needs to start from scratch.
When practical, the banker consults with peers or senior colleagues with first-hand knowledge of relevant transactions. Senior bankers can be helpful in establishing the basic landscape by identifying the key transactions in a given sector. Toward the end of the screening process, an experienced banker’s guidance is beneficial for the final refining of the universe.
Screen for Comparable Acquisitions
The initial goal when screening for comparable acquisitions is to locate as many potential transactions as possible for a relevant, recent time period and then further refine the universe. Below are several suggestions for creating an initial list.
- Search M&A databases using a financial information service, which allows for the screening of M&A transactions through multiple search criteria, including industry, transaction size, form of consideration, time period, and geography, among others
- Examine the target’s M&A history and determine the multiples it has paid and received for the purchase and sale, respectively, of its businesses
- Revisit the target’s universe of comparable companies (as determined in Chapter 1) and examine the M&A history of each comparable company
- Search merger proxies for comparable acquisitions, as they typically contain excerpts from fairness opinion(s) that cite a list of selected transactions analyzed by the financial advisor(s)
- Review equity and fixed income research reports for the target (if public), its comparable companies, and sector as they may provide lists of comparable acquisitions, including relevant financial data (for reference purposes only)
Examine Other Considerations
Once an initial set of comparable acquisitions is selected, it is important to gain a better understanding of the specific circumstances and context for each transaction. Although these factors generally do not change the list of comparable acquisitions to be examined, understanding the “story” behind each transaction helps to better interpret the multiple paid, as well as its relevance to the target being valued. This next level of analysis involves examining factors such as market conditions and deal dynamics.
Market Conditions Market conditions refer to the business and economic environment, as well as the prevailing state of the capital markets, at the time of a given transaction. They must be viewed within the context of specific sectors and cycles (e.g., housing, steel, and technology). These conditions directly affect availability and cost of acquisition financing and, therefore, influence the price an acquirer is willing, or able, to pay. They also affect buyer confidence with respect to the target’s growth prospects, as well as its own ability to undertake a transaction.
For example, at the height of the technology bubble in the late 1990s and early 2000s, many technology and telecommunications companies were acquired at unprecedented multiples. Equity financing was prevalent during this period as companies used their stock, which was valued at record levels, as acquisition currency. Boardroom confidence was also high—growth prospects appeared unlimited—which lent support to contemplated M&A activity. After the bubble burst and market conditions adjusted, M&A activity slowed dramatically, and companies changed hands for fractions of the valuations seen just a couple of years earlier. The multiples paid for companies during this period quickly became irrelevant for assessing value in the following era.
Similarly, during the low-rate debt financing environment of the mid-2000s, acquirers (financial sponsors, in particular) were able to support higher than historical purchase prices due to the market’s willingness to supply abundant and inexpensive debt with favorable terms. In the ensuing credit crunch that began during the second half of 2007, however, debt financing became scarce and expensive, thereby dramatically changing value perceptions. Over the subsequent couple of years, the entire M&A landscape changed, with the LBO market grinding to a halt and overall deal volume and valuations falling dramatically.
Deal Dynamics Deal dynamics refer to the specific circumstances surrounding a given transaction. For example:
- Was the acquirer a strategic buyer or a financial sponsor?
- What were the buyer’s and seller’s motivations for the transaction?
- Was the target sold through an auction process or negotiated sale? Was the nature of the deal friendly or hostile?
- What was the purchase consideration (i.e., mix of cash and stock)?
This information often provides valuable insight into factors that may have impacted the price paid by the acquirer.
Strategic Buyer vs. Financial Sponsor Traditionally, strategic buyers have been able to pay higher purchase prices than financial sponsors due to their ability to realize synergies from the transaction, among other factors, including lower cost of capital and return thresholds. During periods of robust credit markets, such as the mid-2000s and mid-2010s, however, sponsors were able to place higher leverage on targets and, therefore, compete more effectively with strategic buyers on purchase price. In the credit crunch of 2008/2009, the advantage shifted back to strategic buyers as only the strongest and most creditworthy companies were able to source acquisition financing.
Motivations Buyer and seller motivations may also play an important role in interpreting purchase price. For example, a strategic buyer may “stretch” to pay a higher price for an asset if there are substantial synergies to be realized and/or the asset is critical to its strategic plan (“scarcity value”). Similarly, a financial sponsor may be more aggressive on price if synergies can be realized by combining the target with an existing portfolio company. Or, if the target fits particularly well with the sponsor’s investment priorities in terms of sector or situation (e.g., carve-outs, operational turnarounds, or family-owned). From the seller’s perspective, motivations may also influence purchase price. A corporation in need of cash that is selling a non-core business, for example, may prioritize speed of execution, certainty of completion, and other structural considerations, which may result in a lower valuation than a pure value maximization strategy.
Sale Process and Nature of the Deal The type of sale process and nature of the deal should also be examined. For example, auctions, whereby the target is shopped to multiple prospective buyers, are designed to maximize competitive dynamics with the goal of producing the best offer at the highest possible price. Hostile situations, whereby the target actively seeks alternatives to a proposed takeover by a particular buyer, may also produce higher purchase prices. A merger of equals (MOE) transaction, on the other hand, is premised on partnership with the target, thereby foregoing a typical takeover premium as both sides collectively participate in the upside (e.g., growth and synergies) over time.
Purchase Consideration The use of stock as a meaningful portion of the purchase consideration tends to result in a lower valuation (measured by multiples and premiums paid) than for an all-cash transaction. This is largely due to the fact that the receipt of stock means that target shareholders retain an equity interest in the combined entity and the ability to share in the upside (driven by growth and realizing synergies). Target shareholders also maintain the opportunity to obtain a control premium at a later date through a future sale of the company. As a result, target shareholders may require less upfront compensation than for an all-cash transaction in which they are unable to participate in value creation opportunities that result from combining the two companies.
STEP II. LOCATE THE NECESSARY DEAL-RELATED AND FINANCIAL INFORMATION
This section focuses on the sourcing of key deal-related and financial information for M&A transactions involving both public and private targets. Locating information on comparable acquisitions is invariably easier for transactions involving public targets (including private companies with publicly registered debt securities) due to SEC disclosure requirements.
For M&A transactions involving private targets, the availability of sufficient information typically depends on whether public securities were used as the acquisition financing. In many cases, it is often challenging and sometimes impossible to obtain complete (or any) financial information necessary to determine the transaction multiples in such deals. For competitive reasons, even public acquirers may safeguard these details and only disclose information that is required by law or regulation. Nonetheless, the resourceful banker conducts searches for information on private transactions via news runs and various databases. In some cases, these searches yield enough data to determine purchase price and key target financial statistics; in other cases, there simply may not be enough relevant information available.
Below, we grouped the primary sources for locating the necessary deal-related and financial information for spreading comparable acquisitions into separate categories for public and private targets.
Public Targets
Proxy Statement In a one-step merger transaction,1 the target obtains approval from its shareholders through a vote at a shareholder meeting. Prior to the vote, the target provides appropriate disclosure to the shareholders via a proxy statement. The proxy statement contains a summary of the background and terms of the transaction, a description of the financial analysis underlying the fairness opinion(s) of the financial advisor(s), a copy of the definitive purchase/sale agreement (“definitive agreement”), and summary and pro forma financial data (if applicable, depending on the form of consideration). As such, it is a primary source for locating key information used to spread a precedent transaction. The proxy statement is filed with the SEC under the codes PREM14A (preliminary) and DEFM14A (definitive).
In the event that a public acquirer is issuing new shares equal to or greater than 20% of its pre-deal shares outstanding to fund the purchase consideration,2 it will also need to file a proxy statement for its shareholders to vote on the proposed transaction. In addition, a registration statement to register the offer and sale of shares must be filed with the SEC if no exemption from the registration requirements is available.3
Schedule TO/Schedule 14D-9 In a tender offer, the acquirer offers to buy shares directly from the target’s shareholders.4 As part of this process, the acquirer mails an Offer to Purchase to the target’s shareholders and files a Schedule TO. In response to the tender offer, the target files a Schedule 14D-9 within ten business days of commencement. The Schedule 14D-9 contains a recommendation from the target’s board of directors to the target’s shareholders on how to respond to the tender offer, typically including a fairness opinion. The Schedule TO and the Schedule 14D-9 include the same type of information with respect to the terms of the transaction as set forth in a proxy statement.
Registration Statement/Prospectus (S-4, 424B) When a public acquirer issues shares as part of the purchase consideration for a public target, the acquirer is typically required to file a registration statement/prospectus in order for those shares to be freely tradeable by the target’s shareholders. Similarly, if the acquirer is issuing public debt securities (or debt securities intended to be registered)5 to fund the purchase, it must also file a registration statement/prospectus. The registration statement/prospectus contains the terms of the issuance, material terms of the transaction, and purchase price detail. It may also contain acquirer and target financial information, including on a pro forma basis to reflect the consummation of the transaction (if applicable, depending on the materiality of the transaction).6
Schedule 13E-3 Depending on the nature of the transaction, a “going private”7 deal may require enhanced disclosure. For example, in an LBO of a public company where an “affiliate” (such as a senior company executive or significant shareholder) is part of the buyout group, the SEC requires broader disclosure of information used in the decision-making process on a Schedule 13E-3. Disclosure items on Schedule 13E-3 include materials such as presentations to the target’s board of directors by its financial advisor(s) in support of the actual fairness opinion(s).
8-K In addition to the SEC filings mentioned above, key deal information can be obtained from the 8-K that is filed upon announcement of the transaction. Generally, a public target is required to file an 8-K within four business days of the transaction announcement. In the event a public company is selling a subsidiary or division that is significant in size, the parent company typically files an 8-K upon announcement of the transaction. Public acquirers are also required to file an 8-K upon announcement of material transactions.8 A private acquirer does not need to file an 8-K as it is not subject to the SEC’s disclosure requirements. When filed in the context of an M&A transaction, the 8-K contains a brief description of the transaction, as well as the corresponding press release and definitive agreement as exhibits.
The press release filed upon announcement typically contains a summary of the deal terms, transaction rationale, and a description of the target and acquirer. In the event there are substantial changes to the terms of the transaction following the original announcement, the banker uses the 8-K for the final announced deal (and enclosed press release) as the basis for calculating the deal’s transaction multiples. This is a relatively common occurrence in competitive situations where two or more parties enter into a bidding war for a target.
10-K and 10-Q The target’s 10-K and 10-Q are the primary sources for locating the information necessary to calculate its relevant LTM financial statistics, including adjustments for non-recurring items and significant recent events. The most recent 10-K and 10-Q for the period ending prior to the announcement date typically serve as the source for the necessary information to calculate the target’s LTM financial statistics and balance sheet data. In some cases, the banker may use a filing after announcement if the financial information is deemed more relevant. The 10-K and 10-Q are also relied upon to provide information on the target’s shares outstanding and options/warrants.9
Equity and Fixed Income Research Equity and fixed income research reports often provide helpful deal insight, including information on pro forma adjustments and expected synergies. Furthermore, research reports typically provide color on deal dynamics and other circumstances.
Private Targets
A private target (i.e., a non-public filer) is not required to publicly file documentation in an M&A transaction as long as it is not subject to SEC disclosure requirements. Therefore, the sourcing of relevant information on private targets depends on the type of acquirer and/or acquisition financing.
When a public acquirer buys a private target (or a division/subsidiary of a public company), it may be required to file certain disclosure documents. For example, in the event the acquirer is using public securities as part of the purchase consideration for a private target, it is required to file a registration statement/prospectus. Furthermore, if the acquirer is issuing shares in excess of 20% of its pre-deal shares, a proxy statement is filed with the SEC and mailed to its shareholders so they can evaluate the proposed transaction and vote. As previously discussed, regardless of the type of financing, the acquirer files an 8-K upon announcement and completion of material transactions.
For LBOs of private targets, the availability of necessary information depends on whether public debt securities (typically high yield bonds) are issued as part of the financing. In this case, the S-4 contains the relevant data on purchase price and target financials to spread the precedent transaction.
Private acquirer/private target transactions (including LBOs) involving nonpublic financing are the most difficult transactions for which to obtain information because there are no SEC disclosure requirements. In these situations, the banker must rely on less formal sources for deal information, such as press releases and news articles. These news pieces can be found by searching a company’s corporate website as well as through information services such as Bloomberg, Factiva, and Thomson Reuters. The banker should also search relevant sector-specific trade journals for potential disclosures. Any information provided on these all-private transactions, however, relies on discretionary disclosure by the parties involved. As a result, in many cases it is impossible to obtain even basic deal information that can be relied upon, thus precluding these transactions from being used in precedents.
Summary of Primary SEC Filings in M&A Transactions
Exhibit 2.3 provides a list of key SEC filings that can be used to source relevant deal related data and target financial information for performing precedent transactions. If applicable, the definitive proxy statement or tender offer document should serve as the primary source for deal-related data.
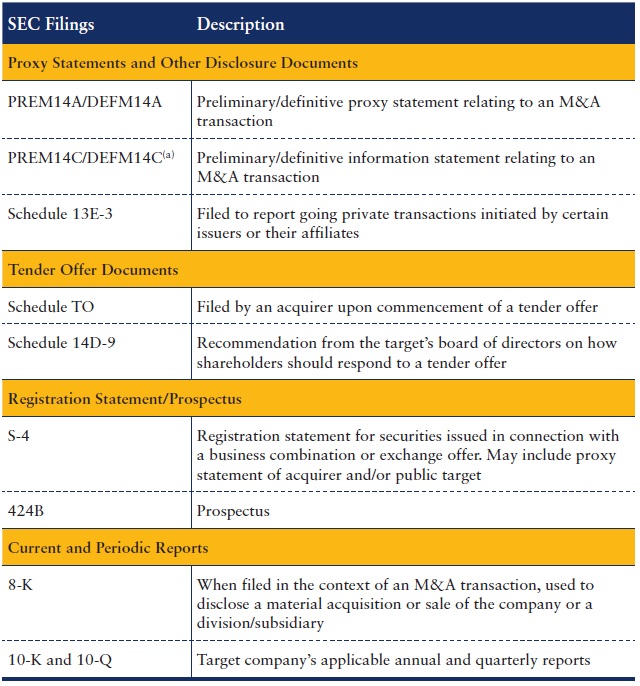
(a)In certain circumstances, an information statement is sent to shareholders instead of a proxy statement. This occurs if one or more shareholders comprise a majority and can approve the transaction via a written consent, in which case a shareholder vote is not required. An information statement generally contains the same information as a proxy statement.
EXHIBIT 2.3 Primary SEC Filings in M&A Transaction—U.S. Issuers
Exhibit 2.4 provides an overview of the sources for transaction information in public and private company transactions.

(a)Should be updated for amendments to the definitive agreement or a new definitive agreement for a new buyer.
EXHIBIT 2.4 Transaction Information by Target Type
STEP III. SPREAD KEY STATISTICS, RATIOS, AND TRANSACTION MULTIPLES
Once the relevant deal-related and financial information has been located, the banker is prepared to spread each selected transaction. This involves entering the key transaction data relating to purchase price, form of consideration, and target financial statistics into an input page, such as that shown in Exhibit 2.5, where the relevant multiples for each transaction are calculated. An input sheet is created for each comparable acquisition, which, in turn, feeds into summary output sheets used for the benchmarking analysis. In the pages that follow, we explain the financial data on the input page and the calculations behind them.
Calculation of Key Financial Statistics and Ratios
The process for spreading the key financial statistics and ratios for precedent transactions is similar to that outlined in Chapter 1 for comparable companies (see Exhibits 1.53 and 1.54). Our focus for this section, therefore, is on certain nuances for calculating equity value and enterprise value in precedent transactions, including under different purchase consideration scenarios. We also discuss the analysis of premiums paid and synergies.
Equity Value Equity value (“equity purchase price” or “offer value”) for public targets in precedent transactions is calculated in a similar manner as that for comparable companies. However, it is based on the announced offer price per share as opposed to the closing share price on a given day. To calculate equity value for public M&A targets, the offer price per share is multiplied by the target’s fully diluted shares outstanding at the given offer price. For example, if the acquirer offers the target’s shareholders $20.00 per share and the target has 50 million fully diluted shares outstanding (based on the treasury stock method at that price), the equity purchase price would be $1,000 million ($20.00 × 50 million). In those cases where the acquirer purchases less than 100% of the target’s outstanding shares, equity value must be grossed up to calculate the implied equity value for the entire company.
In calculating fully diluted shares for precedent transactions, all outstanding in-the-money options and warrants are converted at their weighted average strike prices regardless of whether they are exercisable or not.10 As with the calculation of fully diluted shares outstanding for comparable companies, out-of-the money options and warrants are not assumed to be converted. For convertible and equity-linked securities, the banker must determine whether they are in-the-money and perform conversion in accordance with the terms and change of control provisions as detailed in the registration statement/prospectus.
For M&A transactions in which the target is private, equity value is simply enterprise value less any assumed/refinanced net debt.
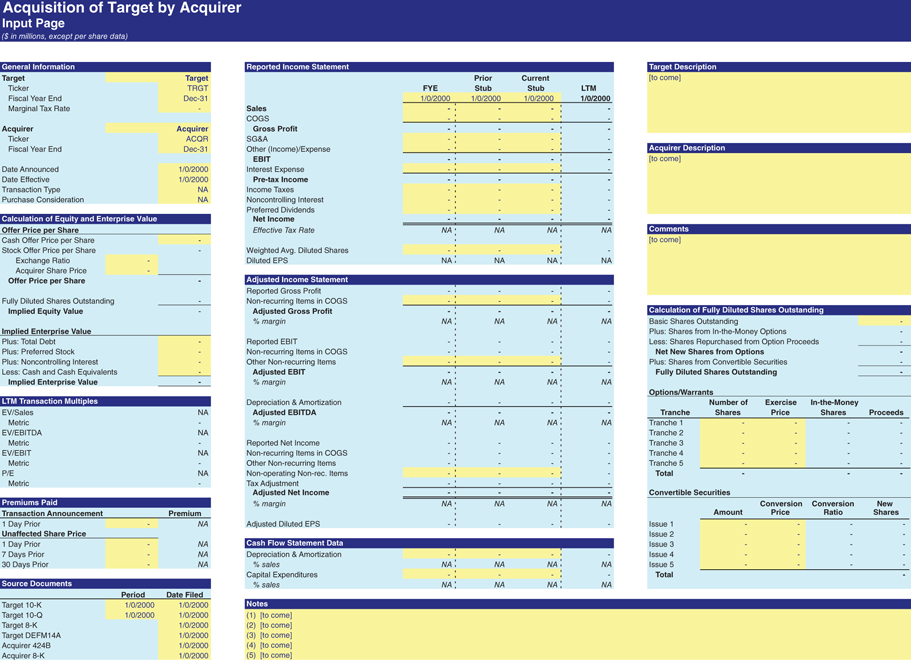
EXHIBIT 2.5 Precedent Transactions Input Page Template
Purchase Consideration Purchase consideration refers to the mix of cash, stock, and/or other securities that the acquirer offers to the target’s shareholders. In some cases, the form of consideration can affect the target shareholders’ perception of the value embedded in the offer. For example, some shareholders may prefer cash over stock as payment due to its guaranteed value. On the other hand, some shareholders may prefer stock compensation in order to participate in the upside potential of the combined companies. Tax consequences and other issues may also play a decisive role in guiding shareholder preferences.
The three primary types of consideration for a target’s equity are all-cash, stock-for-stock, and cash/stock mix.
All-Cash Transaction As the term implies, in an all-cash transaction, the acquirer makes an offer to purchase all or a portion of the target’s shares outstanding for cash (see Exhibit 2.6). This makes for a simple equity value calculation by multiplying the cash offer price per share by the number of fully diluted shares outstanding. Cash represents the cleanest form of currency and certainty of value for all shareholders. However, it also typically triggers a taxable event as opposed to the exchange or receipt of shares of stock, which, if structured properly, is not taxable until the shares are eventually sold.
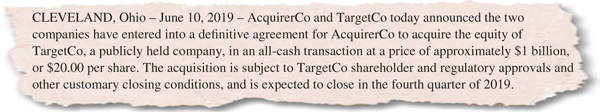
EXHIBIT 2.6 Press Release Excerpt for All-Cash Transaction
Stock-for-Stock Transaction In a stock-for-stock transaction, the calculation of equity value is based on either a fixed exchange ratio or a floating exchange ratio (“fixed price”). The exchange ratio is calculated as offer price per share divided by the acquirer’s share price. A fixed exchange ratio, which is more common than a fixed price structure, is a ratio of how many shares of the acquirer’s stock are exchanged for each share of the target’s stock. In a floating exchange ratio, the number of acquirer shares exchanged for target shares fluctuates so as to ensure a fixed value for the target’s shareholders.
Fixed Exchange Ratio A fixed exchange ratio defines the number of shares of the acquirer’s stock to be exchanged for each share of the target’s stock. As per Exhibit 2.7, if AcquirerCo agrees to exchange one half share of its stock for every one share of TargetCo stock, the exchange ratio is 0.5.
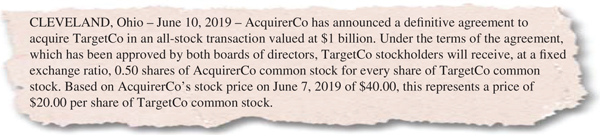
EXHIBIT 2.7 Press Release Excerpt for Fixed Exchange Ratio Structure
For precedent transactions, offer price per share is calculated by multiplying the exchange ratio by the share price of the acquirer, typically one day prior to announcement (see Exhibit 2.8).
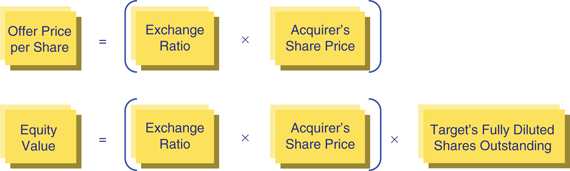
EXHIBIT 2.8 Calculation of Offer Price per Share & Equity Value in a Fixed Exchange Ratio Structure
In a fixed exchange ratio structure, the offer price per share (value to target) moves in line with the underlying share price of the acquirer. The amount of the acquirer’s shares received, however, is constant (see Exhibit 2.9). For example, assuming TargetCo has 50 million fully diluted shares outstanding, it will receive 25 million shares of AcquirerCo stock. The shares received by the target and the respective ownership percentages for the acquirer and target remain fixed regardless of share price movement between execution of the definitive agreement (“signing”) and transaction close (assuming no structural protections for either the acquirer or target, such as a collar).11
Following a deal’s announcement, the market immediately starts to assimilate the publicly disclosed information. In response, the target’s and acquirer’s share prices begin to trade in line with the market’s perception of the transaction.12 Therefore, the target assumes the risk of a decline in the acquirer’s share price, but preserves the potential to share in the upside, both immediately and over time. The fixed exchange ratio is more commonly used than the floating exchange ratio as it “links” both parties’ share prices, thereby enabling them to share the risk (or opportunity) from movements post-announcement.

EXHIBIT 2.9 Fixed Exchange Ratio – Value to Target and Shares Received
Floating Exchange Ratio A floating exchange ratio represents the set dollar amount per share that the acquirer has agreed to pay for each share of the target’s stock in the form of shares of the acquirer’s stock. As per Exhibit 2.10, TargetCo shareholders will receive $20.00 worth of AcquirerCo shares for each share of TargetCo stock they own.
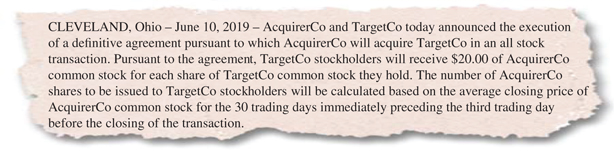
EXHIBIT 2.10 Press Release Excerpt for Floating Exchange Ratio Structure
In a floating exchange ratio structure, as opposed to a fixed exchange ratio, the dollar offer price per share (value to target) is set, and the number of shares exchanged fluctuates in accordance with the movement of the acquirer’s share price (see Exhibit 2.11).
The number of shares to be exchanged is typically based on an average of the acquirer’s share price for a specified time period prior to transaction close. This structure presents target shareholders with greater certainty in terms of value received as the acquirer assumes the full risk of a decline in its share price (assuming no structural protections for the acquirer). In general, a floating exchange ratio is used when the acquirer is significantly larger than the target. A larger acquirer can absorb potential downside from the acquisition of a much smaller target while providing certainty to the seller.
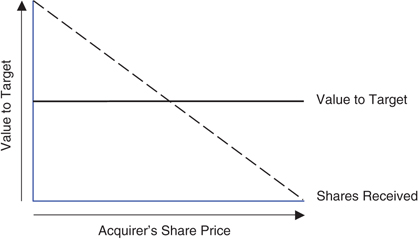
EXHIBIT 2.11 Floating Exchange Ratio – Value to Target and Shares Received
Cash and Stock Transaction In a cash and stock transaction, the acquirer offers a combination of cash and stock as purchase consideration (see Exhibit 2.12).
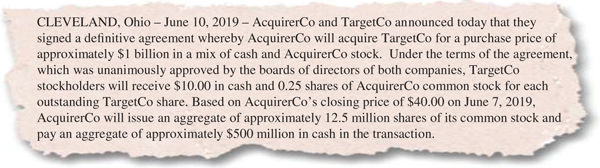
EXHIBIT 2.12 Press Release Excerpt for Cash and Stock Transaction
The cash portion of the offer represents a fixed value per share for target shareholders. The stock portion of the offer can be set according to either a fixed or floating exchange ratio. The calculation of offer price per share and equity value in a cash and stock transaction (assuming a fixed exchange ratio) is shown in Exhibit 2.13.
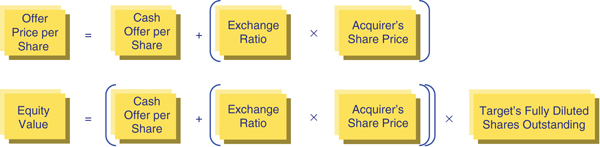
EXHIBIT 2.13 Calculation of Offer Price per Share and Equity Value in a Cash and Stock
Enterprise Value Enterprise value is often referred to as “transaction value” in an M&A context. It is the total value offered by the acquirer for the target’s equity interests, as well as the assumption or refinancing of the target’s net debt. It is calculated for precedent transactions in the same manner as for comparable companies, comprising the sum of equity, net debt, preferred stock, and noncontrolling interest. Exhibit 2.14 illustrates the calculation of enterprise value, with equity value calculated as offer price per share (the sum of the target’s “unaffected” share price and premium paid, see “Premiums Paid”) multiplied by the target’s fully diluted shares outstanding.
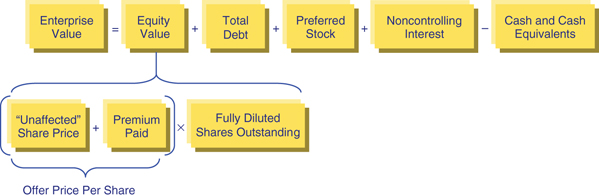
EXHIBIT 2.14 Calculation of Enterprise Value
Calculation of Key Transaction Multiples
The key transaction multiples used in precedents mirror those used for trading comps. Equity value, as represented by the offer price for the target’s equity, is used as a multiple of net income (or offer price per share as a multiple of diluted EPS) and enterprise value (or transaction value) is used as a multiple of EBITDA, EBIT, and, to a lesser extent, sales. In precedent transactions, these multiples are typically higher than those in trading comps due to the premium paid for control and/or synergies.
Multiples for precedent transactions are typically calculated on the basis of actual LTM financial statistics available at the time of announcement. The full projections that an acquirer uses to frame its purchase price decision are generally not public and subject to a confidentiality agreement.13 Therefore, while equity research may offer insights into future performance for a public target, identifying the actual projections that an acquirer used when making its acquisition decision is typically not feasible. Furthermore, buyers are often hesitant to give sellers full credit for projected financial performance as they assume the risk for realization.
As previously discussed, whenever possible, the banker sources the information necessary to calculate the target’s LTM financials directly from SEC filings and other public primary sources. As with trading comps, the LTM financial data needs to be adjusted for non-recurring items and recent events in order to calculate clean multiples that reflect the target’s normalized performance.
Equity Value Multiples
Offer Price per Share-to-LTM EPS / Equity Value-to-LTM Net Income The most broadly used equity value multiple is the P/E ratio, namely offer price per share divided by LTM diluted earnings per share (or equity value divided by LTM net income, see Exhibit 2.15).

EXHIBIT 2.15 Equity Value Multiples
Enterprise Value Multiples
Enterprise Value-to-LTM EBITDA, EBIT, and Sales As in trading comps, enterprise value is used in the numerator when calculating multiples for financial statistics that apply to both debt and equity holders. The most common enterprise value multiples are shown in Exhibit 2.16, with EV/LTM EBITDA being the most prevalent. As discussed in Chapter 1, however, certain sectors may rely on additional or other metrics to drive valuation (see Exhibit 1.33).
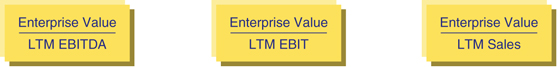
EXHIBIT 2.16 Enterprise Value Multiples
Premiums Paid The premium paid refers to the incremental dollar amount per share that the acquirer offers relative to the target’s unaffected share price, expressed as a percentage. As such, it is only relevant for public target companies. In calculating the premium paid relative to a given date, it is important to use the target’s unaffected share price so as to isolate the true effect of the purchase offer.
The closing share price on the day prior to the official transaction announcement typically serves as a good proxy for the unaffected share price. However, to isolate for the effects of market gyrations and potential share price “creep” due to rumors or information leakage regarding the deal, the banker examines the offer price per share relative to the target’s share price at multiple time intervals prior to transaction announcement (e.g., one trading day, seven calendar days, and 30 calendar days or more).14
In the event the seller has publicly announced its intention to pursue “strategic alternatives” or there is a major leak prior to announcement, the target’s share price may increase in anticipation of a potential takeover. In this case, the target’s share price on the day(s) prior to the official transaction announcement is not truly unaffected. Instead, look at premiums paid relative to the target’s share price at various intervals prior to such an announcement or leak in addition to the actual transaction announcement.
The formula for calculating the percentage premium paid, as well as an illustrative example, is shown in Exhibit 2.17. In this example, we calculate a 35% premium assuming that the target’s shareholders are being offered $67.50 per share for a stock that was trading at an unaffected share price of $50.00.
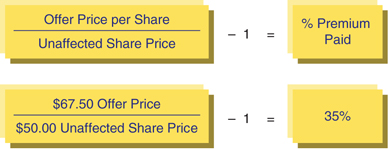
EXHIBIT 2.17 Calculation of Premium Paid
Synergies Synergies refer to the expected cost savings, growth opportunities, and other financial benefits that occur as a result of the combination of two businesses. Consequently, the assessment of synergies is most relevant for transactions where a strategic buyer is purchasing a target in a related business.
Synergies represent tangible value to the acquirer in the form of future cash flow and earnings above and beyond what can be achieved by the target on a stand-alone basis. Therefore, the size and degree of likelihood for realizing potential synergies play an important role for the acquirer in framing the purchase price for a particular target. Theoretically, higher synergies translate into a higher potential price that the acquirer can pay. In analyzing a given comparable acquisition, the amount of announced synergies provides important perspective on the purchase price and multiple paid.
Upon announcement of a material acquisition, public acquirers often provide guidance on the nature and amount of expected synergies. This information is typically communicated via the press release announcing the transaction (see illustrative press release excerpt in Exhibit 2.18) and potentially an investor presentation.
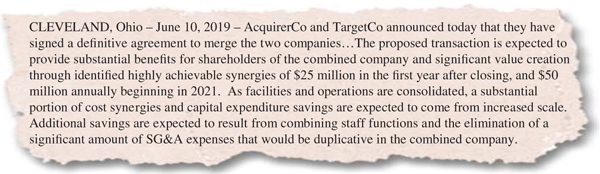
EXHIBIT 2.18 Press Release Excerpt Discussing Synergies in a Strategic Acquisition
Equity research reports also may provide helpful commentary on the value of expected synergies, including the likelihood of realization. Depending on the situation, investors afford varying degrees of credit for announced synergies, as reflected in the acquirer’s post-announcement share price. In precedent transactions, it is helpful to note the announced expected synergies for each transaction where such information is available. However, the transaction multiples are typically shown on the basis of the target’s reported LTM financial information (i.e., without adjusting for synergies). To better understand the multiple paid, it is common practice to also calculate adjusted multiples that reflect expected synergies. This typically involves adding the full effect of expected annual run-rate cost savings synergies (excluding costs to achieve) to an earnings metric in the denominator (e.g., EBITDA and EPS).
Exhibit 2.19 shows the calculation of an EV/LTM EBITDA transaction multiple before and after the consideration of expected synergies, assuming a purchase price of $1,200 million, LTM EBITDA of $150 million, and synergies of $25 million.
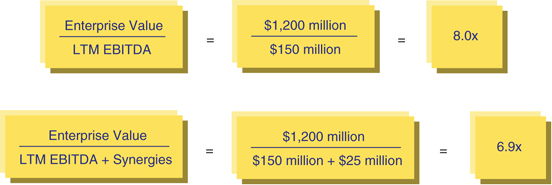
EXHIBIT 2.19 Synergies-Adjusted Multiple
STEP IV. BENCHMARK THE COMPARABLE ACQUISITIONS
As with trading comps, the next level of analysis involves an in-depth study of the selected comparable acquisitions so as to determine those most relevant for valuing the target. The business profile is re-examined and key financial statistics and ratios for each of the acquired companies are benchmarked, with an eye toward identifying those most comparable to the target. Output sheets, such as those shown in Exhibits 1.53 and 1.54 in Chapter 1, facilitate this analysis.
The transaction multiples and deal information for each selected acquisition are also linked to an output sheet where they can be easily benchmarked against one another and the broader universe (see Exhibit 2.35). Each comparable acquisition is closely examined as part of the final refining of the universe, with the best comparable transactions identified and obvious outliers eliminated. As would be expected, a recently consummated deal involving a direct competitor with a similar financial profile is typically more relevant than, for example, an older transaction from a different point in the business or credit cycle, or for a marginal player in the sector. A thoughtful analysis weighs other considerations such as market conditions and deal dynamics in conjunction with the target’s business and financial profile.
STEP V. DETERMINE VALUATION
In precedent transactions, the multiples of the selected comparable acquisitions universe are used to derive an implied valuation range for the target. While standards vary by sector, the key multiples driving valuation in precedent transactions tend to be enterprise value-to-LTM EBITDA and equity value-to-net income (or offer price per share-to-LTM diluted EPS, if public). Therefore, the banker typically uses the means and medians of these multiples from the universe to establish a preliminary valuation range for the target, with the highs and lows also serving as reference points.
As noted earlier, valuation requires a significant amount of art in addition to science. Therefore, while the mean and median multiples provide meaningful valuation guideposts, often the banker focuses on as few as two or three of the best transactions (as identified in Step IV) to establish valuation. For example, if the banker calculates a mean 7.5x EV/LTM EBITDA multiple for the comparable acquisitions universe, but the most relevant transactions were consummated in the 8.0x to 8.5x area, a 7.5x to 8.5x range might be more appropriate. This would place greater emphasis on the best transactions. The chosen multiple range would then be applied to the target’s LTM financial statistics to derive an implied valuation range for the target, using the methodology described in Chapter 1 (see Exhibits 1.35, 1.36, and 1.37).
As with other valuation methodologies, once a valuation range for the target has been established, it is necessary to analyze the output and test conclusions. A common red flag for precedent transactions is when the implied valuation range is lower than the range derived using comparable companies. In this instance, revisit the assumptions underlying the selection of both the universes of comparable acquisitions and comparable companies, as well as the calculations behind the multiples. However, it is important to note that this may not always represent a flawed analysis. If a particular sector is “in play” or benefiting from a cyclical high, for example, the implied valuation range from comparable companies might be higher than that from precedent transactions. The results should be examined in isolation, using best judgment as well as guidance from senior colleagues to determine whether the results make sense.
KEY PROS AND CONS
Pros
- Market-based – analysis is based on actual acquisition multiples and premiums paid for similar companies
- Current – recent transactions tend to reflect prevailing M&A, capital markets, and general economic conditions
- Relativity – multiples approach provides straightforward reference points across sectors and time periods
- Simplicity – key multiples for a few selected transactions can anchor valuation
- Objectivity – precedent-based and avoids making assumptions about a company’s future performance
Cons
- Market-based – multiples may be skewed depending on capital markets and/or economic environment at the time of the transaction
- Time lag – precedent transactions, by definition, have occurred in the past and, therefore, may not be truly reflective of prevailing market conditions (e.g., the LBO boom in the mid-2000s versus the 2008/2009 credit crunch)
- Existence of comparable acquisitions – in some cases it may be difficult to find a robust universe of precedent transactions
- Availability of information – information may be insufficient to determine transaction multiples for many comparable acquisitions
- Acquirer’s basis for valuation – multiple paid by the buyer may be based on expectations governing the target’s future financial performance (which is typically not publicly disclosed) rather than on reported LTM financial information
ILLUSTRATIVE PRECEDENT TRANSACTION ANALYSIS FOR VALUECO
The following section provides a detailed, step-by-step example of how precedent transactions analysis is applied to establish a valuation range for our illustrative target company, ValueCo.
Step I. Select the Universe of Comparable Acquisitions
Screen for Comparable Acquisitions Our screen for comparable acquisitions began by searching M&A databases for past transactions involving companies similar to ValueCo in terms of sector and size. We focused on transactions that occurred over the past three years with enterprise value between approximately $1 billion and $15 billion. At the same time, we examined the acquisition history of ValueCo’s comparable companies (as determined in Chapter 1) for relevant transactions.
The comparable companies’ public filings (including merger proxies) were helpful for identifying and analyzing past acquisitions and sales of relevant businesses. Research reports for individual companies as well as sector reports also provided valuable information. In total, these resources produced a sizable list of potential precedent transactions. Upon further scrutiny, we eliminated several transactions where the target’s size or business model differed significantly from that of ValueCo.
Examine Other Considerations For each of the selected transactions, we examined the specific deal circumstances, including market conditions and deal dynamics. For example, we discerned whether the acquisition took place during a cyclical high or low in the target’s sector as well as the prevailing capital markets conditions. We also determined whether the acquirer was a strategic buyer or a financial sponsor and noted whether the target was sold through an auction process or a negotiated/friendly transaction, and if it was contested. The form of consideration (i.e., cash versus stock) was also analyzed. While these deal considerations did not change the list of comparable acquisitions, the context helped us better interpret and compare the acquisition multiples and premiums paid.
By the end of Step I, we established a solid initial list of comparable acquisitions to be further analyzed. Exhibit 2.20 displays basic data about the selected transactions and target companies for easy comparison.
Step II. Locate the Necessary Deal-Related and Financial Information
In Step II, we set out to locate the relevant deal-related and financial information necessary to spread each comparable acquisition. To illustrate this task, we highlighted Pearl Corp.’s (“Pearl”) acquisition of Rosenbaum Industries (“Rosenbaum”), the most recent transaction on our list.15 As this transaction involved a public acquirer and a public target, the necessary information was readily accessible via the relevant SEC filings.
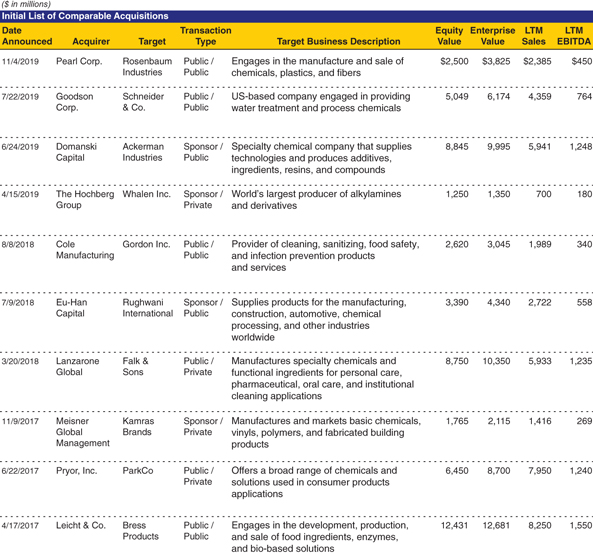
EXHIBIT 2.20 Initial List of Comparable Acquisitions
8-K/Press Release Our search for relevant deal information began by locating the 8-K filed upon announcement of the transaction. The 8-K contained the press release announcing the transaction as well as a copy of the definitive agreement as an exhibit. The press release provided an overview of the basic terms of the deal, including the offer price per share, enterprise value, and purchase consideration, as well as a description of both the acquirer and target and a brief description of the transaction rationale (see Exhibit 2.21). The definitive agreement contained the detailed terms and conditions of the transaction.
We also checked to see whether the original transaction changed for any new announced terms. As previously discussed, this is a relatively common occurrence in competitive situations where two or more parties enter into a bidding war for a given target.

EXHIBIT 2.21 Press Release Excerpt from Announcement of Pearl/Rosenbaum Deal
Proxy Statement (DEFM14A) As Rosenbaum is a public company, its board of directors sought approval for the transaction from Rosenbaum’s shareholders via a proxy statement. The proxy statement contained Rosenbaum’s most recent basic share count, a detailed background of the merger, discussion of the premium paid, and an excerpt from the fairness opinion, among other items. The background described key events leading up to the transaction announcement and provided us with helpful insight into other deal considerations useful for interpreting purchase price, including buyer/seller dynamics (see excerpt in Exhibit 2.22).

EXHIBIT 2.22 Excerpt from Rosenbaum’s Proxy Statement
This background highlights the competitive dynamics involved in the process, which helped explain why the multiple paid for Rosenbaum is above the mean of the selected comparable acquisitions (see Exhibit 2.35).
Rosenbaum’s 10-K and 10-Q Rosenbaum’s 10-K and 10-Q for the period prior to the transaction announcement provided us with the financial data necessary to calculate its LTM financial statistics as well as equity value and enterprise value (based on the offer price per share). We also read through the MD&A and notes to the financials for further insight into Rosenbaum’s financial performance as well as for information on potential non-recurring items and recent events. These public filings provided us with the remaining information necessary to calculate the transaction multiples.
Research Reports We read through equity research reports for Pearl and Rosenbaum following the transaction announcement for further color on the circumstances of the deal, including Pearl’s strategic rationale and expected synergies.
Investor Presentation In addition, Pearl posted an investor presentation to its corporate website under an “Investor Relations” link, which confirmed the financial information and multiples calculated in Exhibit 2.23.
Financial Information Service We used a financial information service to source key historical share price information for Rosenbaum. These data points included the share price on the day prior to the actual transaction announcement, the unaffected share price (i.e., on the day prior to Rosenbaum’s announcement of the exploration of strategic alternatives), and the share price at various intervals prior to the unaffected share price. This share price information served as the basis for the premiums paid calculations in Exhibit 2.33.
Step III. Spread Key Statistics, Ratios, and Transaction Multiples
After locating the necessary deal-related and financial information for the selected comparable acquisitions, we created input pages for each transaction, as shown in Exhibit 2.23 for the Pearl/Rosenbaum transaction.

EXHIBIT 2.23 Input Page for the Acquisition of Rosenbaum by Pearl
Below, we walk through each section of the input sheet in Exhibit 2.23.
General Information In the “General Information” section, we entered basic company and transaction information, such as the target’s and acquirer’s names and fiscal year ends, as well as the transaction announcement and closing dates, transaction type, and purchase consideration. As shown in Exhibit 2.24, Rosenbaum Industries (Nasdaq:JNR) was acquired by Pearl Corp. (Nasdaq:PRL) in an all-cash transaction. Both companies have a fiscal year ending December 31. The transaction was announced on November 4, 2019.
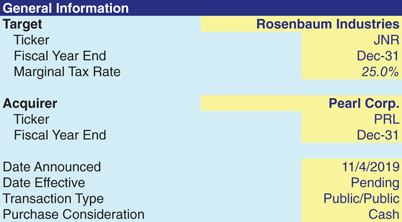
EXHIBIT 2.24 General Information Section
Calculation of Equity and Enterprise Value Under “Calculation of Equity and Enterprise Value”, we first entered Pearl’s offer price per share of $20.00 in cash to Rosenbaum’s shareholders, as disclosed in the 8-K and accompanying press release announcing the transaction (see Exhibit 2.25).
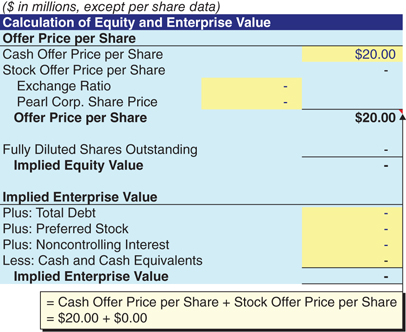
EXHIBIT 2.25 Calculation of Equity and Enterprise Value Section
Calculation of Fully Diluted Shares Outstanding As sourced from the most recent proxy statement, Rosenbaum had basic shares outstanding of 123 million. Rosenbaum also had three “tranches” of options, as detailed in its most recent 10-K (see “Options/Warrants” heading in Exhibit 2.26). At the $20.00 offer price, the three tranches of options are all in-the-money. In calculating fully diluted shares outstanding for precedent transactions, all outstanding in-the-money options and warrants are converted at their weighted average strike prices regardless of whether they are exercisable or not. These three tranches represent 3.75 million shares, which generate total proceeds of $35 million at their respective exercise prices. In accordance with the TSM, these proceeds are assumed to repurchase 1.75 million shares at the $20.00 offer price ($35 million/$20.00), thereby providing net new shares of 2 million. These incremental shares are added to Rosenbaum’s basic shares to calculate fully diluted shares outstanding of 125 million.
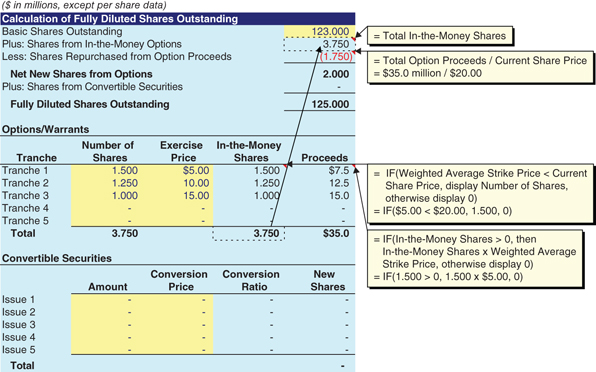
EXHIBIT 2.26 Calculation of Fully Diluted Shares Outstanding Section
Equity Value The 125 million fully diluted shares outstanding feeds into the “Calculation of Equity and Enterprise Value” section. It is then multiplied by the $20.00 offer price per share to produce an equity value of $2,500 million (see Exhibit 2.27).
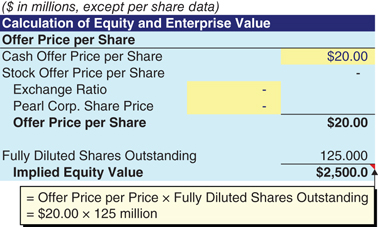
EXHIBIT 2.27 Equity Value
Enterprise Value Rosenbaum’s enterprise value was determined by adding net debt to the calculated equity value. We calculated net debt of $1,325 million by subtracting cash and cash equivalents of $50 million from total debt of $1,375 million, as sourced from Rosenbaum’s 10-Q for the period ending September 30, 2019. The $1,325 million was then added to the calculated equity value of $2,500 million to derive an enterprise value of $3,825 million (see Exhibit 2.28).
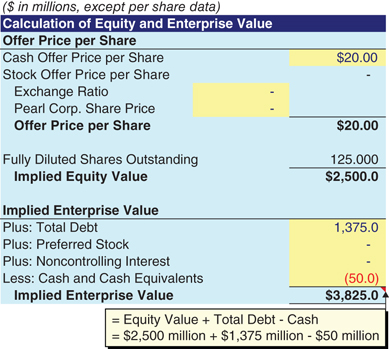
EXHIBIT 2.28 Enterprise Value
Reported Income Statement
Next, we entered Rosenbaum’s income statement information for the prior full year 2018 and YTD 2018 and 2019 periods directly from its most recent 10-K and 10-Q, respectively (see Exhibit 2.29). We also made adjustments for non-recurring items, as appropriate (see Exhibit 2.30).
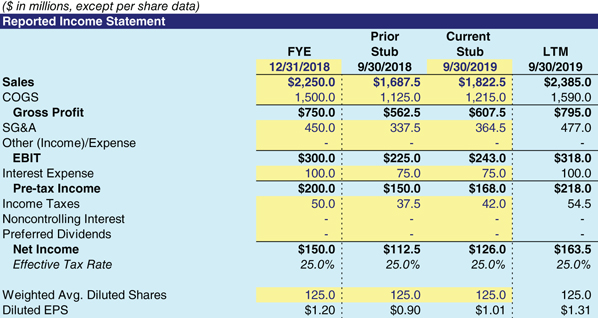
EXHIBIT 2.29 Rosenbaum’s Reported Income Statement Section

EXHIBIT 2.30 Rosenbaum’s Adjusted Income Statement Section
Adjusted Income Statement A review of Rosenbaum’s financial statements and MD&A revealed that it made a $25 million pre-tax payment regarding a litigation settlement in Q4 2018, which we construed as non-recurring. Therefore, we added this charge back to Rosenbaum’s reported financials, resulting in adjusted EBITDA, EBIT, and EPS of $450 million, $343 million and $1.46, respectively, on an LTM basis. These adjusted financials served as the basis for calculating Rosenbaum’s transaction multiples in Exhibit 2.32.
Cash Flow Statement Data Rosenbaum’s D&A and capex information was sourced directly from its cash flow statement, as it appeared in the 10-K and 10-Q (see Exhibit 2.31).
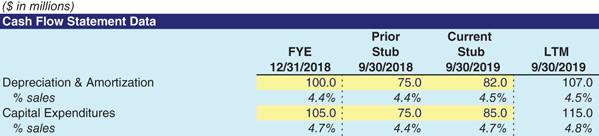
EXHIBIT 2.31 Cash Flow Statement Data Section
LTM Transaction Multiples For the calculation of Rosenbaum’s transaction multiples, we applied enterprise value and offer price per share to the corresponding adjusted LTM financial data (see Exhibit 2.32). These multiples were then linked to the precedent transactions output sheet (see Exhibit 2.35) where the multiples for the entire universe are displayed.
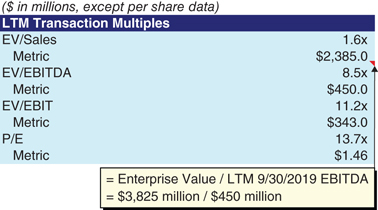
EXHIBIT 2.32 LTM Transaction Multiples Section
Adjusted for $100 million of expected synergies, the LTM EV/EBITDA multiple would be approximately 7.0x ($3,825 million / $550 million).
Enterprise Value-to-LTM EBITDA For EV/LTM EBITDA, we divided Rosenbaum’s enterprise value of $3,825 million by its LTM 9/30/2019 adjusted EBITDA of $450 million to provide a multiple of 8.5x. We used the same approach to calculate the LTM EV/sales and EV/EBIT multiples.
Offer Price per Share-to-LTM Diluted Earnings per Share For P/E, we divided the offer price per share of $20.00 by Rosenbaum’s LTM diluted EPS of $1.46 to provide a multiple of 13.7x.
Premiums Paid The premiums paid analysis for precedent transactions does not apply when valuing private companies such as ValueCo. However, as Rosenbaum was a public company, we performed this analysis for illustrative purposes (see Exhibit 2.33).
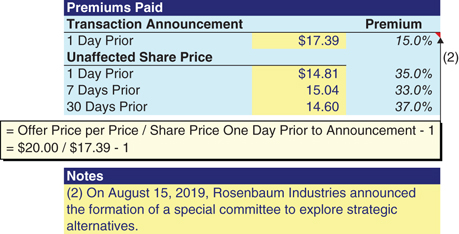
EXHIBIT 2.33 Premiums Paid Section
The $20.00 offer price per share served as the basis for performing the premiums paid analysis, representing a 15% premium to Rosenbaum’s share price of $17.39 on the day prior to transaction announcement. However, as shown in Exhibit 2.34, Rosenbaum’s share price was directly affected by the announcement that it was exploring strategic alternatives on August 15, 2019 (even though the actual deal wasn’t announced until November 4, 2019). Therefore, we also analyzed the unaffected premiums paid on the basis of Rosenbaum’s closing share prices of $14.81, $15.04, and $14.60, for the one-, seven-, and 30-calendar-day periods prior to August 15, 2019. This provided us with premiums paid of 35%, 33%, and 37%, respectively, which are more in line with traditional public M&A premiums.
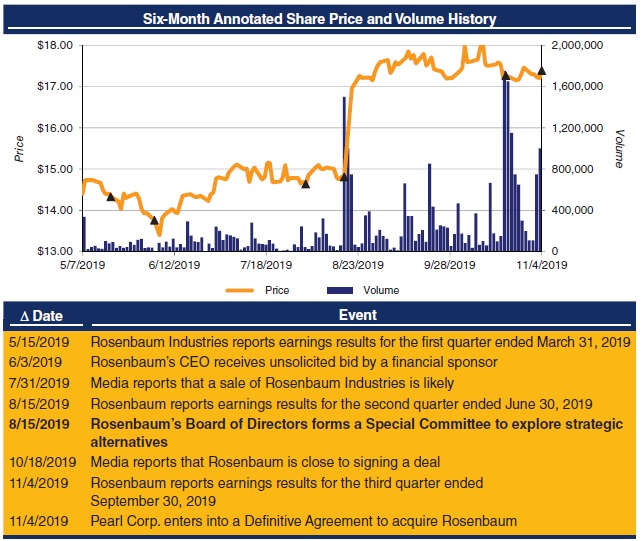
EXHIBIT 2.34 Rosenbaum’s Annotated Price/Volume Graph
Step IV. Benchmark the Comparable Acquisitions
In Step IV, we linked the key financial statistics and ratios for the target companies (calculated in Step III) to output sheets used for benchmarking purposes (see Chapter 1, Exhibits 1.53 and 1.54, for general templates). The benchmarking sheets helped us determine those targets most comparable to ValueCo from a financial perspective, namely Rosenbaum Industries, Schneider & Co., and Rughwani International. At the same time, our analysis in Step I provided us with sufficient information to confirm that these companies were highly comparable to ValueCo from a business perspective.
The relevant transaction multiples and deal information for each of the individual comparable acquisitions were also linked to an output sheet. As shown in Exhibit 2.35, ValueCo’s sector experienced robust M&A activity during the 2017 to 2019 period, which provided us with sufficient relevant data points for our analysis. Consideration of the market conditions and other deal dynamics for each of these transactions further supported our selection of Pearl Corp./Rosenbaum Industries, Goodson Corp./Schneider & Co., and Eu-Han Capital/Rughwani International as the best comparable acquisitions. These multiples formed the primary basis for our selection of the appropriate multiple range for ValueCo.

EXHIBIT 2.35 Precedent Transactions Analysis Output Page
Step V. Determine Valuation
In ValueCo’s sector, companies are typically valued on the basis of EV/EBITDA multiples. Therefore, we employed an LTM EV/EBITDA multiple approach in valuing ValueCo using precedent transactions. We placed particular emphasis on those transactions deemed most comparable, namely the acquisitions of Rosenbaum Industries, Schneider & Co., and Rughwani International to frame the range (as discussed in Step IV).
This approach led us to establish a multiple range of 7.5x to 8.5x LTM EBITDA. We then multiplied the endpoints of this range by ValueCo’s LTM 9/30/2019 EBITDA of $700 million to calculate an implied enterprise value range of approximately $5,250 million to $5,950 million (see Exhibit 2.36).
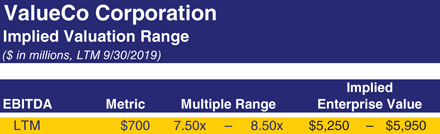
EXHIBIT 2.36 ValueCo’s Implied Valuation Range
As a final step, we analyzed the valuation range derived from precedent transactions versus that derived from comparable companies. As shown in the football field in Exhibit 2.37, this range is at a slight premium to comparable companies, which is attributable to premiums paid in M&A transactions.
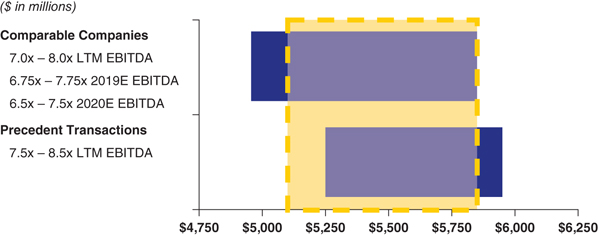
EXHIBIT 2.37 ValueCo Football Field Displaying Comps & Precedents
Notes
- 1 An M&A transaction for public targets where shareholders approve the deal at a formal shareholder meeting pursuant to relevant state law. See Chapter 6 for additional information.
- 2 The requirement for a shareholder vote in this situation arises from the listing rules of the Nasdaq Stock Market and the New York Stock Exchange. If the amount of shares being issued is less than 20% of pre-deal levels, or if the merger consideration consists entirely of cash or debt, the acquirer’s shareholders are typically not entitled to vote on the transaction.
- 3 When both the acquirer and target are required to prepare proxy and/or registration statements, they typically combine the statements in a joint disclosure document.
- 4 A tender offer is an offer to purchase shares for cash. An acquirer can also effect an exchange offer, pursuant to which the target’s shares are exchanged for shares of the acquirer.
- 5 Debt securities are typically sold to qualified institutional buyers (QIBs) through a private placement under Rule 144A of the Securities Act of 1933 initially, and then registered with the SEC within one year after issuance so that they can be traded on an open exchange. This is done to expedite the sale of the debt securities as SEC registration, which involves review of the registration statement by the SEC, can take several weeks or months. Once the SEC review of the documentation is complete, the issuer conducts an exchange offer pursuant to which investors exchange the unregistered bonds for registered bonds.
- 6 A joint proxy/registration statement typically incorporates the acquirer’s and target’s applicable 10-K and 10-Q by reference as the source for financial information.
- 7 A company “goes private” when it engages in certain transactions that have the effect of delisting its shares from a public stock exchange. In addition, depending on the circumstances, a publicly held company may no longer be required to file reports with the SEC when it reduces the number of its shareholders to fewer than 300.
- 8 Generally, an acquisition is required to be reported in an 8-K if the assets, income, or value of the target comprise 10% or greater of the acquirer’s. Furthermore, for larger transactions where assets, income, or value of the target comprise 20% or greater of the acquirer’s, the acquirer must file an 8-K containing historical financial information on the target and pro forma financial information within 75 days of the completion of the acquisition.
- 9 The proxy statement may contain more recent share count information than the 10-K or 10-Q.
- 10 Assumes that all unvested options and warrants vest upon a change of control (which typically reflects actual circumstances) and that no better detail exists for strike prices than that mentioned in the 10-K or 10-Q.
- 11 In a fixed exchange ratio deal, a collar can be used to guarantee a certain range of prices to the target’s shareholders. For example, a target may agree to a $20.00 offer price per share based on an exchange ratio of 1:2, with a collar guaranteeing that the shareholders will receive no less than $18.00 and no more than $22.00, regardless of how the acquirer’s shares trade between signing and closing.
- 12 Factors considered by the market when evaluating a proposed transaction include strategic merit, economics of the deal, synergies, and likelihood of closing.
- 13 Legal contract between a buyer and seller that governs the sharing of confidential company information (see Chapter 6). In the event the banker performing precedents is privy to non-public information regarding one of the selected comparable acquisitions, the banker must refrain from using that information in order to maintain client confidentiality.
- 14 60, 90, 180, or an average of a set number of calendar days prior, as well as the 52-week high and low, may also be reviewed.
- 15 Pearl is also a comparable company to ValueCo (see Chapter 1, Exhibits 1.53, 1.54, and 1.55).