10
The Atmosphere at Home
Just as weather isn’t climate, so too it isn’t phenology. But the two are so closely related that, to understand one, you do well to better understand the other.
Meteorology and phenology, as scientific pursuits, have certain commonalities. Both rely on data collected from a broad area, which can be modeled in order to provide predictions. Meteorology has been pursued by many more people (its usefulness for commerce, from aviation to knowing when to get out and plow winter roads, is undeniable), with more access to resources, and for a longer period of time than phenology, so that the models for meteorological prediction are far better developed than are those for phenological prediction. In time, this may change. While data collection for weather forecasting and reporting is a long-established form of citizen science, with similarities to burgeoning citizen phenology, the importance of phenological studies and models, developed with access to data from citizen phenologists, is likely to grow.
The weather in your dooryard and the weather as reported by the National Weather Service, or by a private source like Accuweather or the Weather Channel, have a rather close family resemblance but they are not the same. True, they don’t vary a great deal from each other—a cold winter day for the National Weather Service is likely to be a cold day in your dooryard—but they aren’t clones of each other, either. In a sense, everyone knows this. Complaints about weather forecasts gone awry—forecasts for snowstorms that don’t quite materialize, sunny days that bring rain to carefully planned picnics—are legion. But the differences between forecast or reported weather and the weather you experience are more curious than this. The weather in your dooryard is many times more complex—and interesting—than the weather you hear about when you turn on the television to the Weather Channel.
Let’s begin by thinking about temperature, which is not just the central data point for anthropogenic climate change but also (as we’ve seen) a well-known cue card for phenological events. I’ve long since forgotten where I read it, but some wise writer once claimed this: the organism that experiences the air temperature that gets reported on a bank sign, along with the current time, is a spider, the spider that lives in the little shelter shading that particular temperature sensor from direct rays of the sun. The temperature you experience is almost always different from this, for a variety of reasons.
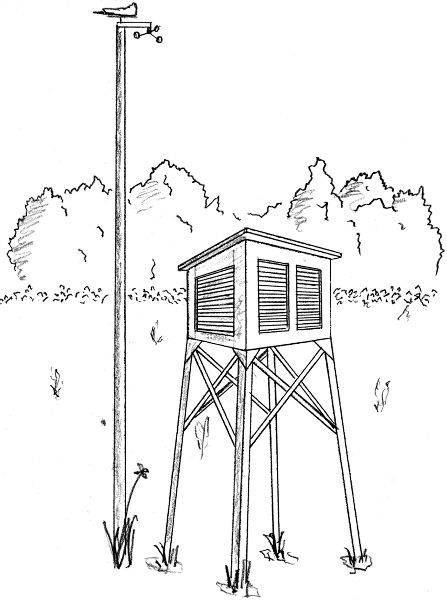
The National Weather Service, as a rule, shelters its temperature sensors (thermometers) from direct sunlight. A reported temperature is a temperature in shade, and it’s the temperature of air that is circulating, at least to some degree, in and out of the shelter. It is not the temperature at ground level but, rather, somewhere above the ground, usually five feet aboveground, plus or minus one foot. In other words, it is a standard temperature reading (and the thermometer has been calibrated so as to be standardized with other standard temperatures). Such a fact, this standard temperature, has many uses, particularly for feeding data to those models that help forecasters make predictions of weather in the future.
But instead of predicting it, let’s take a contemplative view of weather. Weather is as much a part of our natural world as the rocks, soils, water bodies, plants, and animals it touches. And yet we are tempted by custom to think of weather as a thing apart. We often have good reason to do this. Tomorrow’s picnic or hike need not be canceled because of today’s drizzle. Monday’s commute need not be made more dangerous by Saturday morning snow. Weather transpires and passes away.
That’s one way to see it. Snow melts, the ground dries and is wetted again, the sun shines, all in present time. Seeing weather as we see a bloom or a bird on the wing, seeing it as nature, is worth our while. Indeed, looking at weather, rather than through it or past it, is attentiveness at its best. No one knew this better than did the nature photographer Ansel Adams. The crystal clarity of one of his photographs, in which a cutting sharpness extends from the very distant through the very close at hand, complements visible signs of weather in some of his finest work. The signs of weather are themselves clear too, as crisp as the rocks and the trees; despite their clarity, we know these visible signs of weather in our minds to be in motion, fleeting and transitory. They are wisps of time and in time. There is no better example of this than Clearing Winter Storm, Yosemite Valley, 1944, in which Adams captured the valley as few tourists had then seen it. Clouds choked the eastern end of the valley, obscuring Half Dome, Adams’s “monolith,” and the bottom half of El Capitan is veiled in a mist of ice.
We can take a contemplative view of weather. We can watch with interest when weather draws its ears back, gets up on its toes, and grows nasty, presenting itself as nor’easters, Santa Anas, hurricanes, and thunderstorms with threats of tornadoes. Under such conditions, what was tame and civilized a day before quickly becomes wilderness—a sort of temporal wilderness, a wild time more than a wild place. Things that were known and taken for granted suddenly are not.
As I write this, I look over the top of my computer screen, through a window to a pine tree whose branches flex in a strong late-winter breeze. I see the tree, and from its movement I infer the breeze (I’m inside, so I do not feel it directly). But even more, I see the end product of natural selection. I see branches of a tree with physical characteristics that do more than turn the trees’ photosynthesizing needles to the sun and promote passage of nutrients from the trunk and back to it again. I also see a structure neither too rigid nor two easily flexed, a structure adapted to breezes such as this one.
As I watch the branch bob in the breeze, I care little about tomorrow’s weather, or even about weather later today (although I shall care about it soon, for I hope to ride my bicycle into town, and it may rain). For now, I think less of these than I do about the weather in my dooryard at this very moment.
But let’s leave my dooryard and look to yours. Begin with temperature. Think of that as a measure of heat, rather than a measure of comfort. To simplify, let’s talk about a day in springtime, a day when the forecast calls for a high temperature of seventy-one degrees Fahrenheit. Will your dooryard reach seventy-one degrees? It may or may not, and if you have a thermometer, you can check. This is your local equivalent of global temperature. Some parts of your dooryard may never get close to that forecast high and others might surpass it by quite a bit.
It’s easy to see why. Begin by looking at anything in direct sunlight—the bark of a tree, soil you’ve tilled for planting, your bare arm. Each of these may, at any given moment, exceed seventy-one degrees (your skin has a higher starting temperature, since you are warm-blooded). By how much? The answer depends on dozens of factors—the aspect of the surface (whether it is pointed toward or away from the sun, and at what angle), the color of the surface (your skin will absorb more heat if it is black and reflect more if it is pinkish-white), the movement of air (a breeze may prevent the accumulation of heat), and other factors.
When you stand on the ground in sunlight, the surface of your body (if you could measure it everywhere) reveals an almost unimaginably complex gradient of temperatures. And we know that intuitively, don’t we? We know, even if we don’t think of it in quite this way. We learn from childhood to accommodate this gradient in the way we clothe ourselves and in the many subtle movements and adjustments we make whenever we are outdoors. (As a redhead with very light skin I may possibly be more aware of this than others.) My point here is not to dwell on the obvious but to use your experience, and mine, as a reference point for understanding the complex array of temperature gradients in your dooryard on a sunny day, for understanding the physical environment and the biological in contrasting conditions of sun and shade. If, somehow, every discrete temperature in your dooryard could be colored by dyes, one color tone to each degree of temperature, the result would make a Jackson Pollock pale by comparison. And not only that: anything that absorbs heat from the sun will radiate that heat to cooler air and cooler things close by, causing complex convection currents. Every once in a while, you may actually witness a shimmer in the air or in a shadow, refractions of this serenely energetic tableau.
For the most part, though, all of this is subtle, and a wind gust on the order of a few miles per hour can overwhelm much or most of it. But not all of it. In the Sonoran Desert, where saguaro cactuses grow to heights of more than fifty feet, most of the very young saguaros, the recruits, are unseen. This is because the seeds that germinate and take root do so in the shade of a “nurse plant,” such as a small paloverde tree, which provides shade and shelter to the tiny cactus as it grows. Later in life, the cactus will overwhelm the nurse and displace it altogether. But for a time, it needs a certain kind of weather, and the nurse plant provides it. In your dooryard, there are countless pairings of organisms at this very moment. Experienced gardeners understand all of this, and plan their plantings accordingly.
As a way of getting a sense of this weather, this microscale weather, it might be worth spending a day making some measurements. (I call this “microscale weather” to distinguish it from the more familiar notion of microclimate, which is a somewhat different concept.) What is the temperature on the south-facing bark of the oak in your yard, and what’s the temperature on the north side? How do the east- and west-facing surfaces differ? What is the ground temperature where there is bare soil? What is it underneath a cover of grass? Perhaps you might invite a local science teacher, or elementary teacher, to bring his class to your dooryard in order to collect dozens of temperature readings over a short period of time (schools may have enough thermometers to provide one per student). On a day when the air is fairly still, what is the air temperature over a piece of open ground at one foot aboveground, two feet, three feet, and so forth? What happens when puffy, cumulous clouds pass overhead? And what happens to all of this at night, after the sun goes down?
You can go beyond temperature to examine other variable weather measures, such as relative humidity or precipitation. Understanding weather at this microscale, the dooryard scale, will enrich your understanding of the phenological symphony in your dooryard. But, as I’ve conceded, the microscale is easily displaced by something larger.
Also, learn to see weather trends that are reflected in the ecology of your dooryard. There is a range of folklore attached to weather, and much of it is related in some way to phenology, whether the relation is empirically verifiable or entirely mythical. A good source of weather lore is the work of the artist Eric Sloane, whose several books on weather are a delight to those of us who learn efficiently when knowledge is presented pictorially.
I remember perusing my father’s copies of Eric Sloane, learning weather lore, close to the time that he (my father, that is) presented me with a used copy of Alone by Rear Admiral Richard E. Byrd. I was probably about eight years old at the time. I’ve never known quite why he gave it to me, whether he was sending a message of some sort. Certainly, there were messages in the transfer of such a text, from father to son, realized or not. I read it, absorbed it, and in some ways have endeavored to live it. It is a book about solitary commitment to scientific knowledge and to self-knowledge, a necessary if unintended commentary on Walden.
On a dark winter night during the Antarctic winter of 1934, Byrd climbed the ladder from his cabin buried in the Ross Ice Shelf and made his way out the hatch into the long winter night, where he cleared the snow that choked the cups of his anemometer. He admired the aurora australis and went for a walk, taking care to make his way from flag to flag along a walkway he established for this purpose—to get exercise without getting lost in the polar darkness. He called his temporary home Advance Base, and he kept careful, daily records. Alas, carbon monoxide in his cabin would nearly poison him, and he would be rescued from certain death by the men he had left at Little America, miles to the north, who had been under orders not to organize such a rescue attempt, whatever the cause might be.
Today, weather data collected by Byrd and by thousands of people like him are essential for studying changing climate. The data are not phenological, but they are seasonal. Byrd was only one among hundreds of explorers and scientists who risked life and limb to collect weather data and impressions at remote points on the surface of the earth in an effort to understand our planet. Did weather cause malaria? Some thought as much, until the vector proved to be mosquitoes. Would it be possible to make passage across oceans, whether by ship or later by plane, safe from weather calamities? In time, over the early part of the twentieth century, the weather at sea far from shores became knowable and known.
Byrd was part of that growth in what was knowable. An aviator—he was a contender for the prize that Lindbergh won by crossing the Atlantic in The Spirit of St. Louis, as well as the leader of crews aboard the first flights over the North and South Poles—Byrd was accustomed to using weather data and forecasting as a means for assuring safe flying conditions. Although it predated aviation by several decades, the National Weather Service had begun, by 1926, to establish weather stations at airports across the United States, supplemented by a network of amateur weather observers who collected weather data on farms and in backyards.
But on that dark winter night in 1933, Byrd was making observations about weather where he was temporarily living, his frozen dooryard. He knew it would be cold, but otherwise he had few presuppositions about the links between his weather that day and the weather in the weeks and months to come. This is a good frame of mind in which to make weather observations. You can make the same kinds of observations that Byrd made, and with something like the spirit of adventure, since we do not, in fact, know what novelties the weather in the advancing years of anthropogenic climate change will bring. Your dooryard is probably not as uncomfortably situated as Byrd’s Advance Base, but it is very much on the leading edge of discovery.
Much like phenological observations, so too weather observations and record keeping are very much a matter of what you wish to do. The most basic phenological data you collect should be accompanied by simple weather data, such as temperature and conditions (raining, sunny, light fog). But careful phenological observations, such as budbursts or flowering, or first appearances of birds or insect hatches, are made richer by including specifics about weather, not just temperature, but what kind of cloud cover, if any, barometric pressure, wind speed and direction, and precipitation.
You can get much of these data from currently available weather instruments, some of which are designed to record to a computer. Or, if you want to keep things analog, there are instruments that have been around for tens of years and are still serviceable. Other observations can be made with eyes and ears, such as cloud type and percentage of cloud cover.
As in the case of phenological observations, there are opportunities to participate in citizen science as a weather observer. If this interests you, there are standards for calibrating and siting equipment and protocols for reporting. But if you want to ease into making and recording weather observations, you can begin by measuring or observing the aforementioned characteristics of weather (temperature over the course of the day, barometric pressure, wind speed and direction, precipitation, percentage and kind of cloud cover, and relative humidity).
Wind. Whether a breeze or a gust, I tend to think that wind at ground level is about me, a narrow stream of air like the focused breath one expels to blow out candles on a birthday cake. Wind seems personal in a way that clouds, snow, rain, and sunshine do not. But I’m wrong when I think this way, sometimes profoundly so. Winds are often movements of large masses of air, sometimes vast in scale, with pockets of local turbulence.
My problem is that I can’t see this unless there are clear signals, such as trees responding to variations in wind speeds, or—if I’m sailing—the ripples across the water that show me where there’s wind. You see it in the first few minutes of a sailplane flight, when the tow plane rises and falls ahead of you as it encounters a thermal. There are other clues, but they are harder to pick out, and they are counterintuitive. One of these clues is clear air. The Grand Canyon, which is often filled with grubby air (due to coal-fired power-generation plants nearby), has a crystal clarity and wonderful visibility on days with high wind, the kind that can flatten a tent.
But one doesn’t see the wind directly, so you need an instrument or two, which can be either simple and intuitive or pricey (but not all that complex). The standard instruments are an indicator and an anemometer with spinning cups or a propeller. These were once connected to switches and lights or counters but now tend to have sensors that send a digital signal to software. They should be placed so as to get an unobstructed “view” of local winds, away from sources of turbulence. But to start, a simple length of yarn (sailors call this a “telltale”) will reveal direction and a sense of wind speed. A decorative weathervane also indicates wind direction but not a sense of wind speed. Weathervanes point toward the direction that wind is coming from, and it is recorded this way. A telltale points the other direction, and the recorded observation must be reversed.
Climate change will bring alterations in the directions and velocities of local winds, the winds you’ll experience in your dooryard, but it is difficult to say what those changes will be. In an overly simplistic sense, a sort of hunch, the rise in global temperature should slightly decrease the gradients between air masses on a planetary scale. This should mean winds of lower velocity, even if hurricanes become stronger (with higher wind speeds) or more frequent. But such hunches are only that. Changes in the characteristics of winds—velocities, directions, frequency—are something to be observed so that we learn what to expect.
Winds aloft are another matter, and they move in a couple of ways, one obvious, one not. The obvious movement can be seen whenever there are clouds, passing and changing across the sky and casting shadows that race across the landscape. But there are also vertical movements of rising air, and these show up as cumulus clouds and thunderheads.
Clouds. There should be more thunderheads in the future, because increased temperature should bring with it more evaporation and more precipitation. And not just thunderheads, but clouds of all kinds. How clouds fit into the global climate picture is one of the great unknowns of climate science and is another instance of science and understanding that is still unfolding. Local observations of cloud types, reported through existing weather networks, will help provide greater understanding.
Unlike winds, clouds are observable without the use of instruments and delightful for being so (although the direction in which they are moving requires an instrument, about which I will say something shortly). Meteorologists have devised a classification of cloud types, sorted primarily by where in the vertical layers of the atmosphere they form, accumulate, and move. From the lowest to the highest, the primary classifications are nimbostratus, stratocumulus, stratus, altocumulus, altostratus, cirrocumulus, cirrostratus, and cirrus clouds (fig. 10.2). Will some clouds appear more frequently, while others become rarer? This is what cannot be predicted with confidence. The first order of business is to make observations and, then, to explain them.
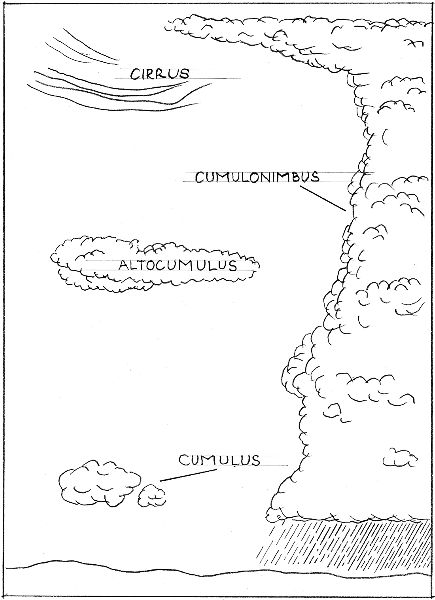
Figure 10.2. Some cloud types.
But let’s sort them out, first. Clouds aren’t merely water vapor, the gaseous state that water can take. Water vapor is often transparent. It is also a significant greenhouse gas. It is present in the air we breathe, is measured as relative humidity, and is a necessary precondition for clouds. Clouds form when water vapor, carried aloft by convection, cools and condenses on solid particles of some kind, microscopic bits of dust. Winds then transport the condensed water in clouds (in liquid/droplet form or in solid/ice form) to locations where the water falls back to Earth as precipitation. Because the atmosphere is generally warmest near the surface of the earth and coolest at altitudes, low clouds tend to be wet clouds and high clouds are icy.
The roles that clouds play in anthropogenic climate change have yet to be sorted out. Climatologists tend to talk about them as a balancing act of positive and negative feedbacks, but let’s set that terminology aside and think about various roles they play in the overall energy balance.
First, as soon as a cloud forms in daytime, it begins to absorb some solar radiation, to let some radiation pass through, and to reflect solar radiation back out into space. How much of each of these it does depends on myriad details. At night, when solar energy isn’t there, clouds absorb energy radiated from the surface and radiate some of it back to Earth. This is the reason that, all other things being equal, a cloudy night tends to be warmer than a starry night. But some of the absorbed heat is radiated out into space. So the cloud is a kind of waystation for energy before the energy is redirected—back to Earth or out into space. This is where the science is at the edge of discovery. What are clouds doing? What does their activity depend on? What is the overall role of clouds in changing climate?
The National Aeronautics and Space Administration is currently involved in studying clouds by using satellites, some in stationary geosynchronous orbits and some that pass over points on the surface of the earth at regular intervals. Through their SCOOL program (Students’ Cloud Observations On-Line), NASA also gathers ground-based observations from school-aged citizen scientists who time their cloud watching to coincide with the passage of a satellite overhead.
But your own observations of clouds will enrich your phenological observations, perhaps someday providing clues to you or to someone else for understanding climatic changes. Sometimes, more than one kind of cloud is visible at a given time, sometimes two or three levels maybe be active with clouds.
In addition to observing and recording cloud types, you may also want to observe their motion, recording the direction they are headed. You can make approximations or make a simple device with a circular mirror, oriented toward the compass directions (N, NNE, NE, ENE, E, for instance). A mirror also makes it simpler to estimate percentage of cloud cover.
Precipitation. Some clouds produce rain. Meteorologists use tipping bucket rain gauges to measure rainfall (in inches), but you can make a simple gauge using a funnel and a collecting tube, calibrated to provide an accurate measurement. Snowfall can be measured simply, with rulers in a few places, and averaged. The Community Collaborative Rain, Hail and Snow Network, is a citizen science network that collects precipitation data.
Temperature. The ideal instrument for recording outdoor temperature is a sensor, placed in ventilated shade about five feet aboveground. This might be a fairly inexpensive indoor/outdoor thermometer, which you can read from inside your home and from which you can record daily highs or lows. Or it can be a more expensive devise that transmits data to a digital recording device, giving you a full picture of temperatures throughout the day or night. Given the importance of temperature for some phenological events, this more thorough treatment of temperature recording may be warranted.
Barometric pressure. There is no better quantitative measure for indicating weather than barometric pressure, and no better predictor of the coming trend. Rising pressure usually means the weather will be fair in due course; falling pressure warns of instability. Members of the Royal Society of London spoke of the weight and spring of air as early as the 1660s and devised elaborate experiments using an air pump (that is, a vacuum pump) to change barometric pressures. In the United States, barometric pressure is reported in inches of mercury, in parallel with degrees Fahrenheit for temperature.
A simple, calibrated barometer is sufficient for reading barometric pressure, but a device that records pressures continuously is more fun.
Relative humidity. There are inexpensive, digital devices for recording relative humidity. But there is nothing like using a sling psychrometer for feeling like a true citizen scientist. A sling psychrometer is a device with two thermometers, a wet bulb and a dry bulb, that is whirled (on a leash) to encourage evaporation on the wet-bulb thermometer. You compare the measured temperatures on the two bulbs to get relative humidity.
Snow cover and snowpack. Snowpack is a major climate consideration in the Western states, and anthropogenic climate change will have an effect on it. All of the water sources in urban California, as well as the highly productive agricultural regions of the Central and Imperial Valleys depend on runoff from snowpack in the Sierra Nevada, the Rocky Mountains, and lesser ranges such as the Wasatch and the Panamints. Snowpack is an important reservoir for storing water for parts of the year, and this fact was one of the justifications for turning over vast areas to the public domain for stewardship by the U.S. Forest Service. Changes in snowpack will have major, not gradual, consequences for many Western cities and for our national food supply.
But in any place where precipitation is held in reserve in frozen form for part of the year, you may see ecological changes in response to climatic changes. The areas and numbers aren’t as vast in some places, in the east for instance. But lakes, ponds, rivers, streams, springs, and groundwater may hold reduced volumes of water during several months in some years, relative to what was once normal, transferring that effect to plants and animals. If you live in a place that gets snow every year, or most years, a record of snow cover in your dooryard is worth keeping. Make a note of the date when snow falls, then track the percentage of snow cover as it diminishes to 50 percent and to nothing. If subsequent snow falls, measure the total snowpack about once a week until it is gone. Measure in three places and get an average to record.
Snow cover isn’t only a reservoir for water. It is also important for the earth’s energy balance, as the high albedo of snow (or ice)—its reflectivity—sends solar energy back into space. When there is diminished snow or ice cover, whether on land or at sea, the earth absorbs more heat. This is a significant positive feedback in the energy budget process. Important as this is, it is a side issue in your dooryard, where the ecological consequences of reduced snowpack is of more concern.
But what about increased snowpacks, such as the “polar vortex” in northeastern states during the winters of 2014 and 2015? It remains to be seen whether these winters, with major snows and thick snowpacks, were anomalous or are an emerging climate feature. Certainly it’s the case that both of these winters were warmer and dryer for the whole of the United States. A colder and snowier Northeast in years to come would not be inconsistent with warming on a continental or global scale, but it would certainly be counterintuitive and hard on New Englanders and New Yorkers. And, should that be the new normal, people living in this region will want to be alert to phenological changes that lead to ecological change.
Variability and volatility. One aspect of weather that I like to notice, and for which there is no regular category recognized by the National Weather Service, the Weather Channel, or elsewhere, is daily variability or volatility. How much did the weather change, and how often? There are days that include blue skies and thunderstorms; rain, hail, and sunburn; shirtsleeves and snow. Meteorologists do pay attention to variability in weather—and climate—but it is not generally reported, and there is no widely recognized metric for expressing it. For this reason, on a day that includes a wide variety of weather types, there is some value in capturing this in a simple prose description.
Also deserving of descriptions in prose: extreme weather. Why not start with memories of extreme weather to establish a baseline in your experience? I experienced the outbreak of tornadoes in and around Xenia, Ohio, in 1974, for which I was close enough nearby to have felt unsettled but not close enough to really know what it means to experience a tornado. More about that in due course. My other extreme stories are of the blizzard in Boston in 1978 and Hurricane Gloria in 1985. I experienced both of these as larks, really, although the latter is more clearly drawn in my mind. As it passed through my town, with bands of rain alternating with merely moist, warm air, I wanted to be outside experiencing it. But I was home with my then two-year-old son, who wanted nothing to do with a father who attended to the weather rather than to him in such a crisis I kept the doors and windows closed. The power went out and stayed out for five days. We cooked on a wood stove and in the evenings enjoyed lighting from candles and a Coleman lantern, dubbed “the cheery light.”
So, my extreme weather stories aren’t so extreme. As if that weren’t enough, I don’t seem to get the full benefit of notorious inclement or even unpleasant weather. I’ve never been cold in summer in San Francisco, and I basked in the sun at a sidewalk café in London in early autumn.
From the earliest days of concern about anthropogenic climate change, which was usually, in those bygone days, called the greenhouse effect, activists, climate scientists, and the public have showed concern about an increase in extreme weather events—hurricanes, droughts, and very hot days and nights—as likely consequences of increased carbon dioxide in the atmosphere. But in an instance of frustrating rigor, climate scientists have cautioned that no single weather event should be attributed to anthropogenic climate change alone. Activists, like Bill McKibben, eventually lost patience with this caution, arguing that it too easily served the aims of those who seed doubt about climate change. Climate scientists, for their part, are working on models that may let them say something about the role of anthropogenic climate change in fostering extreme weather events. In the meantime, the attitude among most climate scientists has been to expect extreme weather events in greater frequency and of greater magnitude.
In keeping with the aims of this book, I will talk about extreme weather that you might experience in your dooryard and about how to add such experiences to your understanding of all that will be happening there.
Extreme weather includes hurricanes, droughts, wildfires, extreme heat and extreme cold, extreme snow and ice storms, other storms, and extreme rainfall. The National Academy of Sciences recently ranked these events according to the confidence that climate scientists have in attributing them to human-caused climate changed.7 From greatest to least confidence, the rankings are as follows:
- Extreme cold (decreasing frequency and magnitude)
- Extreme heat (increasing frequency and magnitude)
- Drought
- Extreme snow and ice, extreme rainfall
- Hurricanes
- Severe convection storms, wildfires
To say that science has low confidence in attributing wildfires to anthropogenic climate change, to take one example, does not mean that wildfires are unexplainable or that they lack a human fingerprint. Wildfires are (1) often caused by humans, (2) exacerbated by human action over decades (primarily through fire suppression), and (3) are made more dangerous and costly by ever-lengthening interfaces between wildlands and our built environment. Climate is but a single factor in all this and difficult to separate from others.
In events of extreme heat, both the maximum and minimum daily temperatures have increased. Heat waves have become more common now in the United States than they were in the period before 1950 and will become more common still, with higher maximum and minimum temperatures.
One might guess that warming would lead to fewer and less severe occurrences of extreme cold, and the records over the past sixty years bear this out, although “fewer” does not mean “never.”
Droughts can be expected to be more common in future years, but attributing any particular drought to climate change is difficult for a long list of reasons. Droughts vary in length and in the seasons in which they occur. (There are, for instance, snow droughts affecting snowpack.) Like wildfires, droughts are sometimes caused by multiple factors. The Dust Bowl might well be called the “great American drought,” a record drought that added a second and devastating layer of tragedy for many Americans who were already overcome by the Great Depression. In some ways, it is the best example before anthropogenic climate change of the consequences that human action can have on environment. Individual farmers and policy makers alike learned that climate, combined with settlement and farming practices unsuited to the landscape, can lead to economic displacement and environmental degradation of the highest order. They also learned that warnings of catastrophe are sometimes well-informed.
In the early decades of westward settlement in the United States, pioneers bypassed the Great Plains for fields and pastures farther west. Beginning with the Homestead Act of 1862, the federal government began to promote settlement in the Great Plains. In retrospect, this seems ill-advised, but there were elements within the government that could have prevented disaster. John Wesley Powell, the second director of the U.S. Geological Survey, warned that the Homestead Act was flawed in that it treated all land as though each 160-acre parcel had roughly the same access to water, either from rains or through irrigation. Powell was ignored, in part because the Plains states were unusually well-watered from the late 1870s through the early 1890s.
To gain deed to the 160 acres they claimed, settlers had to live in place for five years and improve the land. This they did by bringing Eastern farming practices, such as deep plowing, to a more arid landscape. The unsuitability of such practice became evident when drought struck the region in the 1930s. Without the presettlement root structures of native plants, and without moisture to substitute for the natural condition, the topsoil simply blew away in windstorms. Most of the homesteaders or their children moved on. But enlightened farm policies helped in the recovery of the landscape.
Comparable consequences of drought in California did not fully materialize recently because of the El Niño of 2015–16, and this underlines the difficulty of attributing drought to any single factor.
One might expect extremes of precipitation to be easily attributed to climate change, and indeed, there is some confidence that heavy downpours and snowstorms (and blizzards) can be associated with anthropogenic climate change, particularly in North America. As for hurricanes, there is a correlation between warming seas and increases in the sizes and number of hurricanes, but there are other factors that limit the number of hurricanes in a given season.
Finally, there are tornadoes, about which climate scientists feel the least confidence in linking a weather event to anthropogenic climate change. The wail of sirens during the Xenia outbreak of April 1974, also known as the Super Outbreak, is a sound I’ll never forget. I lived in nearby Cincinnati at the time, and tornadoes touched down near my home there; but the devastation close to me was nothing like what hit Xenia, Ohio, about fifty miles to the northeast.
On April 3 and 4, 148 tornadoes appeared in twelve states plus Canada. In Ohio, tornadoes followed a path from Cincinnati through Xenia, where an F5 tornado, the most powerful in the Fujita scale of zero to five, destroyed a wide swath of structures in the town, injuring more than a thousand people and killing thirty-two. While I heard sirens in Cincinnati, none were heard in Xenia. The town had not installed sirens.
Individual tornadoes are major calamities for those who get caught in their paths. But large outbreaks, such as the Xenia outbreak and the outbreak of April 2011, can also tax regionally shared resources.
Whether a weather event can be clearly attributed to anthropogenic climate chance is of interest to climate scientists and to policy makers but has little bearing on anyone who recognizes that human action in the environment plays a role in climate, through weather events or through phenological change. There is value in taking time to describe all extreme weather events, including the period of time leading up to each event (if forewarned) and the period following it. Phenological observations of all kinds are especially of interest in the aftermath of an event.