10
Case Studies
In this chapter, we present case studies to demonstrate the methods and ideas described in the book. Any company, institution or business can benefit from monetising their data, so the case studies cover a range of different applications. We do not include the more common examples, which are readily available on the internet. Note also that many of the ideas are widely applicable and the aim of the book is to enable the reader to make use of them in their specific business.
The case studies illustrate how the ideas in Chapters 7– 9 pan out in real life. They show different ways of uplifting the business. In some of the case studies the benefit from monetising data is obvious; in others it is more hidden and the benefits will arise from improved processes, such as algorithms replacing manual work or greater streamlining because more use is made of forecasts. Examples of this are found in planning, purchasing accuracy and in all aspects of supply chain management. The benefits can also arise from reduction of time and costs, especially by replacing the more routine work carried out by experts with algorithms, thereby freeing up the experts for more creative thinking and innovation.
The case studies cover different types of data and different sectors and sizes of business. One of the main barriers to successful monetisation is poor data readiness. Data preparation can absorb a lot of time and be very frustrating. All of the case studies have arisen in our practice and each emphasises key learning points.
Each case study has the following sections:
- Background and Content
- Methods
- Monetisation
- Key Learning Points and Caveats
- Skills and Knowledge Needed
- Cascading, wider relevance
The case studies are summarised in Table 10.1.
Table 10.1 Summary of case studies.
| Number | Case study | Sector | Monetisation opportunity | Exchange | Further comments |
| 1 | Job scheduling in utilities | Utilities | Efficiency | Own use data | |
| 2 | Shipping | Shipping | New services | Own use data | |
| 3 | On line sales or mail order | Retail: mail order, over the counter, health products | Predictive targeting | B2C selling goods and services | Online |
| 4 | Intelligent profiling with loyalty card schemes | Retail: mail order, over the counter, health products | Segmentation, individual offers | B2C selling goods and services | Online |
| 5 | Social media | All | Connected world | Social network | Using public data with a subtle theme |
| 6 | Making a business out of boring statistics | All | Increase market intelligence | Advisors selling knowledge | |
| 7 | Social media and web intelligence services | All | Business improvement and selling information | Advisors selling knowledge | Using official statistics and public data |
| 8 | Service provider example | All | Emailing newsletters | Service providers | Public and provider’s own data |
| 9 | Data source | All | Providing addresses | Service providers | Public and customer’s own data |
| 10 | Industry 4.0: metamodelling | Manufacturing | Mass customisation | Advisors selling knowledge | |
| 11 | Industry 4.0: modelling | Manufacturing | Supply chain management | Own use data | |
| 12 | Monetising in an SME | Health and well being | Data analytics to generate insight | Own use data | Selling insight |
| 13 | Making sense of public finance and other data | Finance | Business improvement and selling information | Open data | Using privately owned data and integrating it with public data |
| 14 | Benchmarking | Brands | Learn to decide how good or bad company performs | Market research data enriched with public data | |
| 15 | Shopping habits | Retail | Improved customer relations, efficient and product handling | B2C selling goods and services | |
| 16 | Shopping habits | Retail | Improved customer relations, efficient and product handling | B2C selling goods and services | |
| 17 | Shopping habits | Retail | Improved customer relations, efficient and product handling | B2C selling goods and services | |
| 18 | Monetising data arising from IoT | Service providers, households and facility management | Business improvement, better targeting and selling information | ||
| 19 | Monetising data arising from IoT | Insurance, healthcare and risk management | Business improvement, better targeting and selling information | ||
| 20 | Monetising data arising from IoT | Mobility and connected cars | Business improvement, better targeting and selling information | ||
| 21 | Monetising data arising from IoT | Production and automation | Business improvement, better targeting and selling information |
Case studies 15–17 and 18–21 encapsulate distinctly different aspects of shopping habits and the internet of things. As these application areas are of great importance they are given as separate case studies. Most of the text in these case studies is specific to the specific aspect being described, but some of the text is repeated for the sake of completeness. Therefore, these case studies can be read as complete entities.
The case studies are introductions to the fields rather than prescriptive. They are not complete solutions but give an overview and indication of how to deal with the main issues. This is a necessary way to approach the case studies because each could merit a whole book in its own right.
10.1 Job Scheduling in Utilities
10.1.1 Background and Content
The utilities sector is highly regulated and there are strict guidelines as to response rates to be achieved by service providers when attending to faults and failures. Customers with problems contact the company and expect solutions. For example, if your phone or internet, electricity, water or gas are not working, you expect the utility company to come and repair your system. Although from the customer point of view all jobs are important, from the company point of view some jobs are more important, urgent or risky than others and need a higher priority.
Service‐level agreements are usually set to ensure that the company gives an agreed level of service. In utilities, jobs with a higher level of risk are prioritised. Risk is determined by a combination of likelihood and consequence and usually a risk‐based points score is applied. There is a time consideration, in that the highest‐risk jobs must be completed immediately, or at least within 24 hours, and others can be dealt with at a later date.
Consider a service‐level agreement that states all highest‐risk jobs must be attended immediately and overall at least 60% of jobs arising in a month must be completed within 24 hours. The difficult issue is that jobs of different risk levels arise in a random manner and the timing and seriousness of the problems varies with the seasons. As the month progresses, which jobs should be tackled so that 60% is achieved over the whole year but is not exceeded by too much? For example, if all the jobs in one month are tackled, this will be an excessive response rate from the company point of view if only 20% were at the highest risk level. If only the highest‐risk jobs are tackled, only 20% of jobs will be carried out and there is a shortfall under the 60% service‐level agreement.
The business issue is to conform to the service‐level agreement in the face of the random arrival of problems. The company needs to avoid excessive overwork that can arise from a fear of missing the target. This situation is reminiscent of the classic manufacturing dilemma of having to fill containers to a certain level or weight, with regulatory penalties for underfill and financial implications for overfill. In the case of weights and measures, filling may be expected to be subject to natural variation following an approximate normal distribution, so that reasonable estimates can be made of the percentage over‐ and underfilled. In the utilities jobs scenario, the important measure is risk score rather than fill level, and the distribution of risk scores is likely to be highly non‐linear.
Companies hold details of all the jobs that arise and are attended; a periodic review of risk and response rates will help to address the scheduling problem and bring financial gains in terms of improved scheduling.
It is interesting that data analytics has evolved from its early applications in manufacturing and retail, and now extends to all spheres of work including workforce planning and performance management. A summary of this evolution is shown in Figure 10.1.
Figure 10.1 The evolution of data analytics
The company needs to predict the risk cutoff score that they can apply throughout the month to ensure they meet their obligations but do not excessively overrun. The current position is to adopt a conservative cutoff but this can be improved upon by analysing the data in greater detail. More sensitive application of cutoffs leads to savings in job scheduling, increased efficiency and potentially a reduction in costs, which can be passed on to customers.
10.1.2 Methods
The distribution of risk scores tends to be non‐linear because it is ‘man‐made’ and has lumps of risk allocated to jobs on an ad‐hoc basis. For example, the risk associated with a job to fix a fault affecting a small area may be 1 and for a fault affecting a large area it may be 10. This risk component is then multiplied by the risk raised by the usage of the faulty component. Low usage has a value of 1 and high usage has a value of 5. Hence, it can be seen that in this simple case, the possible outcomes are 1, 5, 10, 50. This is shown in Table 10.2.
Table 10.2 Risk scores in a simple case.
| Risk scores | Usage | |
| Affected people | Low | High |
| Low risk (few) | 1 | 5 |
| High risk (many) | 10 | 50 |
The arrival time of jobs is random and the distribution of jobs with risk scores 1, 5, 10 and 50 is not normal. In addition, the distribution of risk scores varies in different seasons and in different locations. For example, certain problems may be more common in summer than in winter; some types of property may need jobs more often than others. An example of a distribution of risk scores is shown in Table 10.3.
Table 10.3 Distribution of risk scores in different seasons.
| Risk score (RS) | 1 | 5 | 10 | 50 |
| Percentage in summer | 55 | 10 | 30 | 5 |
| Cumulative percentage of jobs with risk score less than or equal to RS in summer | 55 | 65 | 95 | 100 |
| Percentage of jobs with risk score greater than or equal to RS in summer | 100 | 45 | 35 | 5 |
| Percentage in winter | 25 | 30 | 20 | 25 |
| Cumulative percentage of jobs with risk score less than or equal to RS in winter | 25 | 55 | 75 | 100 |
| Percentage of jobs with RS greater than or equal to RS in winter | 100 | 75 | 45 | 25 |
In this simple example, suppose that the service‐level agreement is that all jobs with risk score greater than 10 must be tackled immediately, and that even if there are fewer than 60% of jobs with risk score over 10, an overall level of 60% of jobs must be dealt with in 24 hours. So the question is how to set the cutoff risk score for action.
The cumulative distribution functions (CDFs) are shown in Figure 10.2. Deciding to prioritise the most risky 60% of jobs requires a risk score cutoff corresponding to 40%. This is 1 in summer and 5 in winter, to ensure that at least the worst 60% of jobs are tackled. Because of the low granulation of the risk scores, these cutoffs lead to wastage because 100% of summer jobs will be dealt with and 75% of winter jobs, whereas only 60% of jobs need to be completed. However, it also shows that if a cutoff of 1 is chosen for both summer and winter, there is a lost opportunity because actually the cutoff could be 5 in winter and still meet the service level requirements.
Figure 10.2 Cumulative distribution of risk scores.
In the real‐life situation, the percentage cutoff each month depends on the job mix and the CDFs differ each month. This presents an opportunity for setting a more finely tuned cutoff.
Data from even a small number of years, for example five years, may be enough to identify a pattern in the data if it is a strong, well‐defined pattern, but a weaker pattern will require more data before we can be sure enough to make recommendations.
Simulation can be used to explore the stability of the patterns and any rules based on the data distributions. Repeated random samples of data from the dataset can be examined and the variation in the CDF, percentile cutoff risk scores and percentage above a specified risk score can be observed, leading to 95% tolerance intervals.
In addition to proposing a solution to the scheduling problem it is important to set up a method of ongoing assessment. The differences between observed and expected results should be examined on a monthly basis and if the discrepancy is too large then action should be taken. The natural control limits for the discrepancies can be estimated from data in a set‐up period, and then as time goes on, any discrepancy that exceeds the control limits will trigger an action.
10.1.3 Monetisation
It is important to keep strategic goals in mind and realise that even a small discovery can be beneficial. For example, merely identifying that the risk score distributions are different in different months gives an advantage. If this leads to a saving of 10% of a month’s jobs, the extra cost of dealing with prioritised jobs enables the savings to be calculated. For example, if the extra cost is £1,000 per job and there are 10,000 jobs per month, the savings are 10% × 10,000 × £1,000 which is £1 million per month. These savings can be used for other actions within the company, such as increased customer‐focussed activities with the potential to raise customer satisfaction and loyalty.
Unfortunately, establishing the veracity of the differences between the monthly cumulative risk score distributions is not easy, because we need to have replication to be confident. Several years’ worth of data are required to determine if the pattern is an enduring feature of the risk scores or whether it is just a random fluctuation. The replication data needs to be similar in salient features and this is difficult to ensure because there may be changes in the business, the evaluation of risk scores or in the range of properties within the catchment area. Even with satisfactory replication, it is not easy to be confident about the similarity of patterns, which may themselves be rather vague and subtle.
10.1.4 Key Learning Points and Caveats
Collating the dataset ready for analysis can be a major undertaking. Operational data is often not in a format suitable for analysis for a different purpose. It is a key learning point for a company to be aware that their data is valuable and that it may have to underpin all sorts of what‐if scenarios; for each investigation, the data needs to be readily accessible and reliable.
Data investigation is likely to raise issues and queries with the data, for example the exact operational definitions and lists of quality checks undertaken. Good effective communication channels need to be established early on in the project so that there can be fast exchange of information and explanations throughout the investigation.
The importance of the investigation needs to be clear to all stakeholders to ensure their commitment to the project. There needs to be clarification of aims, timescales and communication channels. Official statistics can be used as a back‐up to the operational data. This will provide evidence of the distribution of properties and population characteristics in the catchment area and also the trends taking place over time.
The balance of penalties and savings needs to be examined. The uplift compared to doing nothing needs to be noted and also the potential cost of faulty guidance due to failed assumptions.
It may be impossible to establish a reliable pattern. In this case it is a business decision whether to act on the suggestions evident from the historic data or to retain current practice. Patterns, even if established, may change over time and there must be ongoing checks and balances to ensure that targets are still being met and regulations are being followed.
The analytical skills needed for this sort of investigation are significant. It is important to provide support to the analyst so that they do not have to spend all their time on the technical‐administrative tasks associated with accessing and rationalising the data.
10.1.5 Skills and Knowledge Needed
An investigation of the sort described in this case study is a classic application of data science. The analyst needs to understand the business need, have excellent communication skills and ability to keep on task to deliver a viable solution. In addition, there is likely to be considerable data manipulation and so IT skills are vital. The statistical skills needed include an understanding of natural and systematic variation, CDFs, percentiles and pattern recognition techniques. There needs to be an awareness of the possibilities and consequences of errors arising from underestimating and overestimating the levels of risk likely to be encountered in the next accounting period. Statistical process control methods are needed to ensure that the process stays on track and that control limits will alert to the need for actions, such as re‐analysis, in good time.
10.1.6 Cascading, Wider Relevance
The scenario in this case study applies to any situation where there are competing demands dictating how things are done. The competing forces can be financial, regulatory, health and safety or customer‐related. Utility companies and IT or infrastructure service providers must look after their expenditure and demonstrate value for money as well as reaching well‐defined service‐level agreements. Due to restrictions in expenditure, such institutions are limited in the number of experts they can employ, hence the importance of learning from each investigation and embedding data monetisation skills in the company ready for the next opportunity to use them.
10.2 Shipping
10.2.1 Background and Content
The shipping industry is extremely important. It deals with 90% of global trade and is responsible for around 3% of global carbon emissions. There has been rapid expansion of the use of sensors and a massive amount of shipping data is now collected routinely. Shipping data arises from different sources and in different formats (see Figure 10.3); big data is a topical issue. Big data analytics can help to determine hidden patterns and trends that can be very useful for performance management, maintenance planning and emissions monitoring, thus providing decision support for the ship operator.

Figure 10.3 Data sources in the shipping industry.
However, as in many industry sectors, less use is made of the data beyond its immediate operational value. The different sources of data are often owned by different stakeholders, making it difficult to get the full benefit. Ships’ logs contain valuable details of sailing conditions, sea states, routes and time taken, as well as cargo and staffing information. These are company owned data, are confidential, guarded from competitors and not usually accessible. However, in conjunction with publicly available data on weather and tidal conditions, this data can give great insight into the efficient running of the business. Producing case studies showing the benefits of analysing shipping data will encourage a greater sharing of data, take‐up of the methods and nurturing of the skills needed.
If appropriate equipment is fitted, sensors return minute‐by‐minute fuel consumption figures and GPS locations. The data is used for navigation, timing and fuelling purposes. The data can also help to compare ship management strategies, including economic speed of travel (see Figure 10.4) and maintenance planning. Case studies listed in the bibliography show how ships’ data is analysed to give valuable insights and monitor shipping performance.
Figure 10.4 Optimum speed recommendation.
Shipping is a cost‐effective mode of transportation for global trade. With increases in fuel prices and increasing environmental legislation, fleet operators are keen to save fuel and keep a tight control on emissions. Increasing shipping efficiency, reducing emissions and operational costs is environmentally sound and brings competitive advantage to the ship operators.
Analysis of data on a ship’s location and fuel consumption is the main focus of this case study. Three additional facilities were developed for use by shipping management: automatic mode detection, identification of an economic speed and a methodology for calculating emissions. Further work is underway on monitoring ship performance.
10.2.2 Methods
The data need to be time stamped, amalgamated and interpreted ready for analysis. One of the first realisations when studying shipping data is the need to identify different modes of operation for the voyage. Offshore vessels will spend periods of time in port, in transit and holding their position at a site; tugs will spend time in port, in transit and in action; ferries will spend time in port and in transit, often having to modify their speed and course to negotiate other vessels in busy shipping lanes. Before fuel consumption data can be interpreted each journey needs to be separated into its separate modes of operation.
Identifying modes of operation involves a thorough analysis of historical measures of fuel consumption, speed and location with known modes so that mode thresholds can be set. On some vessels, the crew set the mode manually, but this can be inaccurate due to operational distractions. The automatic detection of different modes is more reliable.
Fuel consumption and speed are related by a power law. A statistically designed experiment was used to generate comparable data from which to establish the relationship between power and fuel consumption for a specific vessel travelling under calm conditions. Replicated journeys were carried out at different power levels according to a statistical design. The data for power and speed are analysed by fitting a regression model based on a cubic curve. Using this model, the fuel consumption for a journey of a set number of nautical miles was calculated for different speeds. The speed giving the minimum cost was identified and recommended as the eco‐speed. Using this relationship, a dashboard display shows the time for the journey, the expected fuel consumption and the expected excess cost if a different speed is used. The expected emissions are also calculated based on the specified type of fuel being used. Thus the economic speed recommendation is explained and justified.
Sensors to detect emissions are expensive. An alternative is to use statistical calculations to estimate emissions from the speed, fuel consumption and fuel type. These estimates are added to the eco speed dashboard to provide a sound management tool.
Data for successive journeys can be analysed to produce a regression model predicting fuel consumption under specified conditions. The predicted fuel consumption can be compared with observed fuel consumption and the discrepancy monitored using statistical process control. Large discrepancies alert the ship’s management to possible issues of equipment malfunction, wear or damage.
10.2.3 Monetisation
Analysing data beyond its immediate operational use gives information on the estimated fuel consumption, duration and harmful gas emissions for the upcoming journey. There are monetary savings in terms of optimised fuel consumption and better prediction of shipping times. Current and upcoming regulations regarding emissions can be accommodated. Automatic mode detection is fundamental to managing performance and reduces costs caused by errors introduced by manual recording of mode information. These uses of available data give a competitive advantage and increase revenue.
10.2.4 Key Learning Points and Caveats
Shipping sensor data can be used to optimise economic factors and increase business. It requires use of sensor equipment, familiarity with open data sources and access to operational data. There has to be documentation and strict management to ensure that the agreed recommendations are adhered to.
There are a wide range of influences on fuel consumption in shipping. Experiments on active ships are more appropriate than carrying out tests in a workshop or using simulations. They need to cover a wide range of weather conditions, which is clearly difficult to achieve; the costs of experiments are considerable as the vessel has to be taken temporarily out of service with the resultant cost in fuel, lost trading and staff time. Although this is an important limitation, the experimental results are nevertheless valuable as a first guideline and further refinement can be carried out according to the likely benefits. Insight can be obtained from observational data that covers a wide range of conditions but this data includes a lot of noise so that a large quantity is needed to detect the signals within.
10.2.5 Skills and Knowledge Needed
Sensor data from ships needs to be captured and analysed. Data needs to be cleaned and verified. There needs to be knowledge of relationships between the many factors influencing shipping costs. Baseline data also needs to be analysed to detect patterns and trends and determine thresholds. Experiments are required to set up baseline measurements upon which to build models. The experiments must be designed to maximise information for minimum cost. Engineering knowledge of emissions calculations is needed. Statistical skills are required to analyse correlations and construct regression models for prediction. Business knowledge is vital to determine the key areas for improvement and ensure that data analysis is focussed on providing competitive advantage.
10.2.6 Cascading, Wider Relevance
Similar use of sensor data can be made in all industries to save energy and costs, and conserve essential raw materials. Other industries such as production and manufacturing already use their data in quality improvement projects, but there is less emphasis on energy saving. These industries are starting from a strong base by having statisticians employed and knowledge of how to use data. Such usage is less well developed in shipping so there are a lot of opportunities.
10.3 Online Sales or Mail Order
10.3.1 Background and Content
Examples from online sales and mail order houses are well known for data monetisation and are the most commonly cited cases in this area. Mail order businesses are not new, having been in existence long before the digital age. They are distinguished in that they do not have face‐to‐face contact with their customers. However, from the beginning, they have made good use of their data to generate profit and to compensate for having no salesperson who can read the expression of the customer.
Because they do not meet the customer in person, all the decisions to do with pricing, offers and products depend on the information gathered from customers. This information is not just from sales data but also the way customers navigate the website, the way they pay, their response to advertisements and so on.
Mail order houses and online shops use the full range of data mining methods. These include predictive modelling, forecasting and targeting, behavioural pricing, credit risk forecasting, testing sensitivity to prices and intelligent segments. In addition, association and sequence analysis lead to cross‐ and upselling and planned product placement. Forecasting on the level of prices leads to profit optimisation and cash flow management. Forecasting on the level of advertising leads to cost savings by using just as much advertising as is needed to meet given goals. Most of the time, these dimensions are linked, for example in targeting and advertising optimisation.
Even though they have been in existence for a long time, they are often ahead of the curve in using their data because it is the only way to improve the business. They are also interesting because their methods need to be opaque, so as not to deter customers or make them aware that their behaviour is being observed and analysed.
This case study is based on a mail order house selling over‐the‐counter products. They want to individualise their offers to the health needs of each customer. Currently they are targeting their customers in gross segments, but they intend to refine these segments so that their advertising can be more precise. Everything has to be handled to minimise the cost and avoid extra expense through the individualised offerings.
10.3.2 Methods
Out of the universe of methods that these companies use as part of their business culture, this case study focuses only on monetisation by behavioural‐based offerings. The first step focuses on gathering the customer data from past interaction with the company, including dates of sales, timing and location of touchpoints with the company, complaints, advertising received and responded to, products bought, returned and commented upon. The data needs to be collated by customer ID and typically will have many variables; there might be several thousand variables of different types, including binary, continuous and ordinal. It is important to realise that demographics form only a small part of this set and most of the variables relate to individual behaviour.
A predictive model is generated for each product. For product A, the target variable might be whether or not the customer bought product A in the last 14 days. The potential explanatory variables are all the other variables, with their values as they were before the 14‐day period. Decision tree analysis is used to identify important explanatory variables and create a model that makes it possible to determine the individual buying likelihood, a value between 0 and 1. The model creation must follow the data mining process. It is created with a learning dataset extracted from the whole dataset, a test procedure and validation to make sure that the model is reliable. So, for example, there might be several hundred important explanatory variables. A decision tree may have many layers (around 50 is not uncommon) and a logistic regression model may have many coefficients (around 200 is not uncommon). A pruned example of a decision tree is given in Figure 10.5.
Figure 10.5 Pruned decision tree.
An important explanatory variable might be whether the individual bought product A two orders before. Reading the decision tree in Figure 10.6 from bottom to top, an individual who bought product A two orders before is likely to buy with likelihood of 22.7%, whereas an individual who did not buy product A two orders before is likely to buy with likelihood of 32.1%. Results are listed for training and validation samples. Likelihood of purchase depends on which leaf of the decision tree the customer fits.
Figure 10.6 Detail from decision tree
Models are built for all of the products of interest and each model may have a different collection of explanatory variables. Each model gives a likelihood of purchase for each customer. For each customer, we compare the likelihoods to determine which products are the most likely to be bought. We choose the top few and include these products in individualised advertising.
The next step is to decide on the channel for the marketing for each customer. This time the predictive models have as their target variable whether or not the product that the person bought in the last 14 days was as a result of each type of marketing campaign. Each product purchase has a different identifying code depending on the type of marketing in which it was featured. A model is generated for each potential channel. In this case, the channels are phone, mail, catalogue, email and website banners. Again, the channel with the highest likelihood is chosen. The result is presented in a customised communication with the customer. Each customer has their own version; an example is given in Figure 10.7.
Figure 10.7 Customised communication.
If the number of products and channels is large, creating a model for each product/channel combination runs the risk of rather small datasets and a large number of models. In this case, it makes sense that the products are treated together rather than separately by each channel. Thus the number of models is one for each product plus one for each channel.
An associated issue is that we need to be creative to think of ways to combine advertising for different sets of products. For example, Dirk may be most likely to buy products B, A and D in that order of likelihood whereas the ordering for Chris may be products E, B and C. These products need to be presented in an appealing and appropriate manner. For example, the opening sentence may need to differ depending on which product is the most likely purchase. One solution is to create a modular framework for the advertising which can be filled automatically corresponding to the model. The diverse communications give an example of the subtle differences generated by behavioural targeting.
10.3.3 Monetisation
Using predictive modelling is expected to produce better responses without spending more money on marketing. There is also a reduced amount of marketing effort, which could include saving on printing and posting, which can be considerable. For example, a coloured two‐page letter featuring the chosen products and postage can be as much as €0.80 and may be sent to 250,000 customers. If you can reduce the number of recipients to 180,000 because 70,000 are likely to respond better to an email, then the saving is €56,000 in one campaign without reducing revenue.
Behavioural targeting also reduces potential annoyance due to over contact with the customer with the wrong product. The cost is in gathering the data and carrying out the analysis. However, the data is generally available and can be used for multiple purposes. The company has to invest in IT infrastructure and experts. The models have to be reassessed periodically. The payback is that with every marketing activity the company saves costs; every outgoing action is carefully tuned and only used when there is evidence of it being useful and the return on investment is expected to be good.
As well as identifying products and channels, predictive models can also be created around pricing strategies, thereby avoiding offering unnecessarily low prices. This has potential to increase revenue. Figure 10.8 shows different versions of individualised communications with different products and prices offered.

Figure 10.8 Individualised communication.
10.3.4 Key Learning Points and Caveats
The value of the behavioural marketing depends on the reliability of the models and the stability of the population. A bad model could be worse than doing nothing. The data mining process has to be followed carefully to ensure reliable models are created. Data must be of high quality. The briefing from the business side must be clear and understood so that all agree which are the products of interest and which are the potential channels, to avoid having to repeat the analysis. The models should be built so that they can be developed and used again and/or used in an automated environment. This is particularly important when real‐time prediction is required to offer behaviour based offers on the website or customised phone calls.
Figure 10.9 shows a cut‐down version of the complexity of the steps carried out in this case study in an automated environment. In this environment, there are also metadata relating to the application of the models, such as date of applying the model and the group of customers on which the models are applied.

Figure 10.9 Complexity of data mining steps.
The lines spreading into the bottom node represent the passage of possible errors from the data preparation steps, for example summarising sales data for each consumer in terms of variables such as whether product A was bought in the last 14 days. The data preparation is typically carried out every week. Note that the values of the variables change each week as the time window changes.
The lines starting top centre span out from the control node and represent the flow of prepared data into 103 different models, one for each product and type of communication channel. The mid‐central span represents metadata for each model. The lower right‐hand‐side node represents the flow of information into the recommendation algorithm that receives and sorts the likelihoods and formulates the recommendation.
It may be that a suitable model cannot be found for one or more products. In this case, the product can be ignored or a random choice made. This situation may occur with newer products, where there is less data and no comparable products. It can also occur with products that are less easily predicted because they occur more randomly, for example different types of presents. For these products, the model is unlikely to produce a high likelihood of purchasing the product based on the explanatory variables.
Even if the problem seems to be very complex, it can be seen that the problem can be tackled in pieces. An alternative is to use association rules or cluster analysis to see which products go together, but this does not include the people aspect and is less precise and less useful for re‐use. The predictive modelling procedure has the advantage that the models can be used in different ways, which saves time and money.
10.3.5 Skills and Knowledge Needed
Communication skills are necessary to ensure that the business briefing is effective. Knowledge to translate a business case into an analytical task is important, for example in identifying that optimum product combinations are needed. Clear ability in data mining is a fundamental requirement, as is creativity to set up the data environment, building on the data available in the data warehouse and additional sources of data if required. There also needs to be data awareness to create a range of variables that could be good explanatory variables, for example whether product A was purchased two orders ago, or whether the customer complained or whether they only purchase when there is a ‘buy one get one free’ offer, and so on.
10.3.6 Cascading, Wider Relevance
The ideas in this case study are widely applicable to all kinds of businesses dealing directly with customers. It is vital to be able to identify each customer and to capture their purchasing behaviour and all interactions with the company. The ideas can be used by companies having loyalty cards, or for on line portals for travel and other sales opportunities. We just need to be able to identify customers and track their behaviour.
10.4 Intelligent Profiling with Loyalty Card Schemes
10.4.1 Background and Content
This case study focuses on loyalty card schemes and their enormous benefits for companies in the travel sector. In contrast to online or mail order houses, most companies, including those in retail, travel, hotels and car rental, have the disadvantage that customer interactions may not include customer details so that it is difficult, if not impossible, to link purchases and monitor reactions to advertising. Even if customer details are available, without a proper scheme the details may not be shared between different branches, so a complete picture is not available. Loyalty cards have advantages in addition to a straightforward gathering of data because they facilitate a focus on marketing activities and enhancing customer loyalty by giving bespoke gifts and advantages to their members. Customers are also given special coupons and benefits in other business areas that have teamed up with the scheme, giving added value. For example, airline and hotel loyalty schemes are commonly linked, providing a start‐to‐finish potential for better service. Nearly all loyalty schemes include a benefit around extra comfort, such as entry to airline lounges, and extra advantages that come with the scheme but are not easy to buy as stand‐alone benefits, such as invitations to special launches.
Loyalty card schemes provide the underlying structure to develop promotional strategies and guide customers through their customer journey, ensuring that the customer stays loyal, comes back and hopefully becomes an advocate.
10.4.2 Methods
We focus in this case study on using the data arising from the loyalty cards for intelligent profiling. The data from the customer journey gives us more or less complete profiles. Not all parts of the data will be available so the methods have to cope with incomplete data.
There has never been so much data from prospective customers and actual customers, from so many possible sources, as today. In addition to the inventory data that every company stores in its customer database (name, gender, address, customer ID number, orders, purchases, requests, customer service inquiries, payment history, and so on) we can, and do, amass much more information. For example, we collect data about the online activities of customers and prospects in social media, their registrations in online forms, their usage data from websites and apps, their click behaviour and interactions, their completed or aborted purchase transactions and their preferred devices and browsers.
Offline data also arise from visits to the retail location, from responses to offline campaigns, and from regional peculiarities and market environments, to name just a few. Offline campaigns are marked with codes. Most point‐of‐sale systems measure activities there, while mobile devices provide other geo‐location data. Online and social media marketing activities get unique URLs or cookies to help track the origin of user actions. Information about consumers’ preferred communication and information channels are obtained. It does make a difference whether visitors have found their way to the company’s website via the Facebook fan page, the company’s profile on Xing or LinkedIn, a specific mobile ad, the company’s e‐newsletter, the corporate video on YouTube or the QR code in a magazine display ad.
Through monitoring tools and services, as well as application interfaces (API interfaces to web or social services, which can be used to read personal data), we can gain other valuable information about consumers’ education, lifestyle, peer group information, preferred brands, exposure to areas of interest and more.
So data is collected at various stages of interaction with the company. The loyalty card is a convenient way to summarise all this information. Typical data is shown in Figure 10.10.
Figure 10.10 Data in the customer journey.
Two crucial points should be kept in mind:
- Legal requirements A company has to respect national laws. In many countries an active declaration of agreement by consumers – both prospects and customers – is required for storage and usage of their data for marketing and targeting purposes. This can be a communication challenge, but it seems to be getting easier. People have become more willing to pay for information or entertainment with their data.
- Data matching The more sophisticated point is the issue of data matching and how to add data from different sources to a single person’s record. As a rule of thumb, in early stages of the consumer lifecycle, matching points are sparse and may not lead back to a single person. But they may lead back to a group of people who have something in common. As the relationship grows, more contact data and behavioural data become available for identification and matching. The goal is to try to collect these data as soon as possible. A loyalty scheme is an excellent assistance in this.
10.4.2.1 Creating profiles
Using descriptive, exploratory analysis, unsupervised learning techniques and predictive modelling, we can create individual, precise and informative profiles from consumer data. These profiles consist of social, self‐reported and observed behaviours, blended with classical CRM database information, which allow insights into how individuals act and connect in real life.
A profile, as we use it, is a single record (which may include thousands of variables) for an individual or an artificial representative of a small group of similar people. Such a profile is the result of a complex compiling process where data from different levels of individualisation and sources are brought together to give a good view of the individual or small group. A profile should be updated at regular intervals, with the timing based on how often changes happen. This individual information (raw data) must be stored in a big data solution or at least in a data warehouse. Ideally the raw data is kept for a certain time period, depending on the kind of information, so that it is possible to calculate the profiles for past periods as well. This allows learning from past campaigns and simulations of potential behaviour using earlier data to forecast planned campaigns.
10.4.2.2 Identifying segments
Segments are the dynamic aggregation of homogeneous profiles. Among other things, cluster analysis and predictive models are used to calculate segments. K‐means cluster analysis is preferable due to the size of the data. The number of clusters is taken as 15 in this case study, based on domain pre‐knowledge reinforced by hierarchical clustering on a sample of data. A problem with cluster analysis is that cluster sizes vary enormously. In this case study, there are a number of rather small but very homogeneous clusters, a couple of middle‐sized clusters and one large cluster containing nearly a third of the customer profiles. The small clusters contain customers with particular behaviours; often they are very active with special interests or habits. If there are clusters that contain very few people, it may be better to note these customers and their special needs but leave them out of the cluster analysis.
There is a choice of ways of evaluating the distances between customers based on their data as discussed in the theory chapters above. In this case study, Ward’s distance is used because it gives a reliable and stable clustering.
Segments help to operationalise communication and interaction, taking into account data from various available sources, such as social network data, existing master data management and CRM system data, behavioural data, transactional data and so on. This makes personalized mass communication more flexible, without being overly complex. One communication extreme is mass communication, where everyone in the selection gets the same communication. The other extreme is completely customised, individual communication, for example based on individual profiles. Segments provide an in‐between strategy. Several profiles can belong to a single segment or, if no specific profiles are built, all customers may be divided into several segments. So you might have all 15 segments in a campaign, with segment‐specific creative or tonality for each one. It is especially important that the segments are actionable and customised, and are always kept up to date.
10.4.2.3 Imputation
The next step is to use the segments and profiles to help enhance and update customer data records using information that is found in the records of other profile members, but missing from a particular customer belonging to the same profile.
No database is perfectly accurate and we will always have bad data in our files, whether imputed or not. There is a risk involved in imputing data, but there is also a risk when we do not try to repair the data. The advantage of estimation based on segments or profiles is that the risk of error is lower than with estimates based on the full population.
10.4.2.4 How Profiles and Segments become Intelligent
Profiling and segmentation are not new, although the quantity of data we can use has grown exponentially, so our accuracy has improved. But these practices become really exciting when they are combined with predictive analytics and other techniques as a basis for further analysis. Used in this way, they help in identifying the potential for cross‐selling and upselling, better exhausting geographic opportunities, finding multipliers, influencers and brand ambassadors, optimising communication channels’ mix and content, discovering trends early, reducing waste, counteracting churn risk and more.
Figure 10.11 illustrates how an intelligent profile represents a group of real people (with sparse datasets indicated by empty circles) and how several profiles will build a segment (with more complete data indicated by filled‐in circles). If you decide that each customer will have their own profile, you will need layers. The decision ultimately depends on the type of business, the data collected and the number of customers in the database.

Figure 10.11 Intelligent profiles and segments in B2C.
Cluster analysis results in a segment membership variable being added to each customer in the database. However, new customers are added all the time and existing customers may change their behaviour (and hence their segment). Therefore it is important to generate rules for segment membership. This can be done by predictive modelling. For each segment, the target variable is binary, indicating membership or not of that segment. In this case study, logistic regression is used to establish a model that gives a likelihood for each customer of belonging to that segment. Almost as a by‐product, logistic regression modelling identifies variables that are important in distinguishing segment memberships. These variables are of interest to marketing to help them understand the different segments and to create customised activities.
10.4.3 Monetisation
All the loyalty card information attached to a person is like any other resource; until it is filtered, cleaned, analysed and aggregated, it cannot provide its full effect as a driver for business. Technologies and analyses are therefore not ends in themselves. They are used to provide the best added‐value for customers and businesses.
Customers rightly expect businesses to communicate and interact with them as individually as possible. They expect relevant offers and quickly become irritated by irrelevant advertising that offers no particular benefit. Only those organisations that know their customers and prospects well can build and maintain a mutually profitable relationship.
Individual profiles allow marketing and sales to communicate to customers and prospects one‐to‐one at several touchpoints (see Figure 10.12). Every part of the campaign can be completely personalised to what the customer wants, to where they are in the buying cycle, and more. This, of course, requires an automated framework to compile a modular campaign or the installation of an alert system for trigger‐based campaigns. This level of individualisation can be difficult and expensive, so most companies decide to use segments.

Figure 10.12 Personalised journey.
10.4.4 Key Learning Points and Caveats
Data protection issues need to be understood when working on data‐focused activities such as behavioural profiling. Data protection laws may be more or less restrictive in different countries; some industries function under tight regulations, and some clients are very sensitive about privacy issues. It is true that the world of accessible data has changed and grown to a universe, but usage of parts of that universe is restricted. In particular, whilst it may be acceptable to use personalised data after an agreement has been signed, data collected before such agreement may be restricted.
Regardless of whether customers are addressed individually or in segments, they will be happier and stay longer and the business can reap the benefits in terms of optimised marketing costs. The company invests effort appropriately depending on the customer segments. Note that the segmentation discussed in this case study is about behaviour and interests and the segments will not necessarily align to customer value as defined by customer lifetime analysis or easier concepts such as RFM (recency, frequency and monetary value). The aim is always to lift people to the next loyalty level or avoid them dropping down a level; appropriate behavioural profiling will help.
It is useful to name the segments to help communicate their meaning to management and marketing and the predictive modelling of segment membership yields important variables for this purpose. Note that important segment‐defining variables are also often identified during the cluster analysis process. These variables could differ from those given by predictive modelling and may not be easy to extract from the results given by the data mining software. Important variables can also be explored by observation. For example, if the histograms of age for each segment differ markedly, age is a defining variable.
In this travel case study, the main segments found and the numbers in each segment are:
- active and trendy (12,564)
- gourmet (9, 472)
- one‐time customers (942,909)
- loyal business (1,260)
- regular business (13,209)
- potential business (1,105,325)
- high‐earning regulars (16,338).
Segments could perhaps be recognised by the intelligent observer, but our statistical analysis is able to detect less obvious but nevertheless important segments, such as the gourmet segment and the high‐earning regulars. It also gives much greater detail. For example, regular business customers are characterised by arriving alone, spending one or two days, reserving less than a day before arrival, disproportionately on a Monday, staying for only 80% of the reservations, averaging four stays per year, paying regular rather than discount rates for the room, not spending much at the front desk and spending additionally on food and drinks at about 25% of room rate. This contrasts with loyal business customers who have some similar characteristics but who differ, for example in that they stay eleven days instead of four days per year but only spend 20% of room rate on food and drink.
10.4.5 Skills and Knowledge Needed
Data gathering from many sources requires skills in cleaning, reshaping and storing data and dealing with data ownership issues. Good communication with workers in different parts of the business is needed to access data and then to explain the meaning of the segments. There need to be clear strategic aims for the work, and skill in identifying and defining these is paramount. Knowledge of cluster analysis techniques is needed, as are marketing skills.
10.4.6 Cascading, Wider Relevance
The learning from this case study can cascade to any business that has a loyalty scheme and plans to adapt it for behavioural profiling, with all its benefits.
10.5 Social Media: a Mechanism to Collect and Use Contributor Data
10.5.1 Background and Content
Social media emerged in the early 2000s and more and more players are entering the market every day. It is a highly volatile market with many players also exiting the market. Social media is a generic concept, which is characterised by exchange of self‐created content via the web, including text, music and images in such a way that the social media provider is concerned with creating a platform rather than creating content. The content is sometimes shared between a defined audience, and sometimes spread throughout a wider audience. In most social media, the user decides what personal information is contained in their profile and what parts of their profile are shared by which subsets of the whole community. Creating networks is a major feature, with the implication that the wider your network the more influential you are. Large networks give greater access because they attract more people and so your chances of meeting people you know are higher.
Figure 10.13 illustrates that this kind of network reaches across the world.

Figure 10.13 The reach of social media.
Social media differs from traditional media in terms of its connectivity. Whereas traditional media is broadcast from one point to many people, social media has ‘n to m’ exchange; that is, many people communicating with many people, so that everyone has the opportunity to be both broadcaster and receiver. The advantage of these mobile and web applications is that things happen in near real time. The disadvantage is that there is vigorous feedback both in terms of instant response and lack of quality control. In principle, anyone can say or share anything, although this possibility is limited by state and provider censorship. In addition, the fear of repercussions is an issue.
The time people spend on social media, both reading and interacting, is enormous and is increasing enormously. Most of the social media providers offer a basic free membership and the payback for the provider is obtained through mechanisms such as advertising and selling insight. The user stands to gain in terms of career, reputation and esteem. Company users also gain from reputation as well as brand awareness, recruitment and in some cases from selling products.
This case study concentrates on the social media provider and how they use the data to generate profit.
10.5.2 Methods
In general, the methods are quite straightforward. The social media provider has legal access to all the data generated by the consenting membership. Personal data, such as gender, age, affiliation, education, and contact details, is collected from user profiles. Further data is obtained by tracking users’ activities and learning from their connections and behaviour in subgroups from their user logs. The data needs to be cleaned and standardised. Missing data has to be handled carefully, and most providers will impute additional data based on a combination of the user’s activities and the profiles and activities of their networks. This imputed information is not shown to the user; most users are unaware that this imputation is done. The implications of the imputation are that more detailed profiles of the user are created and can be shared and monetised, for example in advertising.
The captured and imputed information needs to be summarised, categorised and interpreted. Methods for doing this include cluster analysis, which can highlight groupings, and predictive analytics, which enables targeted actions that have a good chance of being successful.
There is a high potential for false information or non‐human followers (robots) and providers must have algorithms in place to predict potential fraud and fakes. These algorithms may include basic checks such as comparing the country of residence of followers to the expected distribution of the item of interest. For example, a local politician would be expected to have followers nearby or related in some way to the locality. So if a politician from the north‐eastern UK has a majority of followers in Asia, the provider should check why this is and if it is reasonable. If there is no obvious connection there will be a suspicion of paid followers and data analysis of these people may give misleading predictions. More complex fraud detection algorithms may also be necessary.
10.5.3 Monetisation
For social media providers there are real financial gains to be made from advertising, especially targeted advertising, and selling insight. Social media users have the opportunity to develop their networks and create business prospects and further their careers, as well as having free entertainment in exchange for their privacy (see Figure 10.14).
Figure 10.14 The power of social media.
Compared to the traditional methods of word of mouth and family and peer group recommendations, social media tries to simulate this function in the digital world using the fact that the social media persona, often in the form of a ‘blog’, takes the place of the real person. The blog clearly cannot give the full picture and may be out of date, incorrect or exaggerated. People writing the blogs often make a living out of promoting products and this is not always obvious to their readers or followers.
The extraordinary reach of social media makes its influence extremely powerful. The power arises from the fabulous combination of extensive range and precise targeting. This precision is only possible because the social media provider can capitalise on the personal data from the user profile as well as the details of their activities and those of their networks. Even if a person does not complete their personal profile, the social network provider will use information from their peer group to estimate values to fill in those that are missing. This is visualised in Figure 10.15.
Figure 10.15 Using peer group behaviour.
Social media providers are some of the few who realised very early on that ‘data is the new oil’, a basic money‐making material. They have great opportunities to capitalise on their data and to develop new products out of it. Their knowledge about their audience enables them to develop a more or less comfortable, all‐encompassing and entertaining environment that keeps the user on their platforms. It also allows them to track their behaviour outside the network by offering a single sign‐on technology, where their social media login works as a key to access other websites and services. Previously the biggest marketing budget went to classic methods of advertisement such TV, billboards and newspapers. Social media data and the subsequent targeting opportunities have a major influence and are instrumental in the shift from taking advertising (and the associated money) from these wider‐reaching but less precise media to the more targeted advertisements possible with social media, which still have the benefit of wide reach. These targeted advertisements are typically customised in terms of content and style, with particular colours, words, and images used that have been identified as appropriate, influential or meaningful for particular individuals. For example, someone classified as homely may be sent images that have been analysed (predicted) to be attractive and to fit the mindset of homely people, for example beautiful garden furniture. The targeted advertisement need not be used exclusively and is usually combined with all other types of marketing.
Another opportunity is for social media to be a starting point for viral marketing campaigns. In these ways, analysing social media data with statistics methods shifts millions of advertising money from classical broadcast and billboard owners to the social media providers who are the owners of the social media networks.
10.5.4 Key Learning Points and Caveats
Social media providers have a self‐selected user base. They have to be aware that their user base is not representative of the whole population. The user profile data may not be up to date; employment, education and interests may change over time and not all users regularly refresh their profiles. It is well known that there is a major potential for fake identities and fake followers: people who are paid to follow particular users. There can also be fake recommendations, criticisms and reviews. Serious social media providers must take account of these issues and have algorithms in place to predict potential fraud and fakes. For example, if 100,000 followers of a certain person join one day, but they are all from a location without any obvious relationship to the person, then this might merit suspicion. The social media providers are very vulnerable to changes in this fast moving market and are well advised to keep a good lookout for impending changes and disruptive advances ahead.
Too much targeting can inhibit innovation. Targeting is essentially based on old data (even if it is only a millisecond old) and can therefore only build on the current situation. It cannot include upcoming ideas or new users with new patterns of behaviour. One way to counteract this problem and to enhance innovation is to send out non‐targeted advertising to a random selection of users from time to time and see what the response is. This can also be used to recalibrate predictive models periodically as appropriate for the application.
10.5.5 Skills and Knowledge Needed
Skills in data handling, including data preparation, are necessary. There also needs to be good communication with business experts to decide on the best ways to detect fraud. Social media providers have to be aware of the limitations of their data and carry out validity checks: for incompleteness, non‐representativeness and bias. Advanced predictive analytics can be carried out on the data but the analysis is only as effective as the quality of the data upon which it is based.
10.5.6 Cascading, Wider Relevance
Other industries can learn from social media how valuable it is to collect and track customer data and the importance of caring about the quality and accuracy of the data. They can also learn from the sea change of advertising focus that has happened in this area and that solid business rules can change in a decade.
10.6 Making a Business out of Boring Statistics
10.6.1 Background and Content
Data visualisation, including infographics, intelligent maps and responsive data manipulation, is one of the great explosions of data usage in recent times and a means of drawing more people into the world of data science. Companies providing these services are satisfying the need for fast, accessible information. They help people navigate through the mass of options for reporting structured data. Data from official statistics, company reports and research are assembled and regrouped for wider purposes. The company typically accesses available data, uses their business acumen to perceive a need and identifies an application. They rearrange the data, annotate it, add associated interesting information, and construct a versatile, accessible and presentable resource from which insight is readily available.
This case study is aimed at showcasing how a business can be formed around published data. There is clearly an opportunity to create a business and make money. Some companies are a more general data access site, and others focus on a particular area such as house purchases and real estate, or job vacancies and the labour market, or the stock exchange. More are emerging all the time. The common key drivers are: saving time, selling insight, taking in data and giving the user a comfortable ride.
10.6.2 Methods
The business opportunity needs to be clearly thought through as it affects not only the data required but also the level of detail required. Once the business opportunity has been identified, the main components of this type of activity are:
- accessible, open, high‐quality, up‐to‐date data from reliable sources
- web‐based platforms where people can interact with the data
- a monetisation mechanism.
After deciding whether to be general or specialised, you need to search for data sources, note their frequency, detail level and reliability, and establish the data‐transfer mechanism. For example, oil prices data can be accessed through national statistics institutes (NSIs) such as Office for National Statistics in the UK, DeStatis – Statistiches Bundesamt in Germany, or Eurostat, which collates statistics from NSIs across the whole of Europe. Figure 10.16 shows the six‐monthly oil prices from January 2000 to July 2017 for petrol, diesel, heating oil and crude oil, prepared by DeStatis – Statistiches Bundesamt.
Figure 10.16 National statistics oil prices.
Other sources are well known private companies with which one has to form partnerships and which one must pay for the information. Published business reports from big companies can also be used. These sources are very reliable and the producers spend a lot of money ensuring high quality. A web search for data related to the specific business area of interest yields a wide variety of information providers.
Businesses make use of these publicly available data and customise them for different purposes in the form of interactive graphics, annotated tables and reports. For example, a search for oil prices reveals amongst others, a company called Statista. A search within Statista shows the list of reports available, some of which are shown in Figure 10.17. Added usability is included by allowing different download options and formats.

Figure 10.17 Example of reports portal
The accessibility of each data source at a suitably detailed level needs to be checked and negotiated. Most official statistics sources release data in aggregated format, for example, mean values for different age groups. This may not be sufficient, but access to the individualised data is usually protected for all but well specified, approved research purposes. This is the reason why people often need to collect their own primary data rather than using secondary sources.
It is vital that the data is easily accessible for clients. As illustrated in Figure 10.18 the data needs to be combined and presented in a meaningful way that is immediately understandable and appealing.
Figure 10.18 Making a business out of boring statistics.
Normally the access would be web‐based and could be in the form of apps or interactive services. The method of monetisation must be decided before devising the platform and its technical specification. For example, if the information is free then it must be possible to lodge advertisements and to capture their effectiveness to earn money from them, for example by click through. If the information is to be paid for this could be by subscription models to different levels of access for corporate or individual users. Alternatively, it could be set up as a bespoke research payment.
10.6.3 Monetisation
Money‐paying customers have to be attracted somehow. Some companies offer a free taster or start off for free to persuade people of the value of the product and create a pool of potential customers who see the comfort and advantages of using the business system. Later these companies start charging. Companies must be creative and innovative to attract customers. Marketing ideas and a sound budget are vital to generate the necessary penetration and reach.
The service provider has the opportunity to collect information from the users to offer targeted advertising to third parties.
10.6.4 Key Learning Points and Caveats
Data and statistical analysis give added value if they are combined and summarised and transferred to a level of complexity that is valuable to users. This added value is the key success factor. The service provider has to be careful because different sources of data and information might have different quality levels in terms of coverage, completeness, currency, the way the data is gathered and how they deal with outliers; unlike official statistics sources, many data sources do not proclaim a level of quality or spend resources to ensure quality.
10.6.5 Skills and Knowledge Needed
The service provider needs IT skills to manipulate and store data and ensure it is current. They need business awareness to know what is likely to be of interest. They need to know how to reach the right people and what level of complexity is appropriate for the presentation of the digested content. Marketing and advertising skills are needed to show why it is worth paying for something the customer can also get for free (albeit with some extra work).
10.6.6 Cascading, Wider Relevance
Offering a summarising service using any kind of official statistics and reports is clearly highly relevant in any sector. Providing graphs, tables and information in a flexible format that is easy to use and can be readily incorporated into further reports will encourage greater use of data.
10.7 Social Media and Web Intelligence Services
10.7.1 Background and Content
The concept explored in this case study is that of generating revenue from publicly available web data, especially social media data. There are two points of view:
- that of businesses obtaining social media information and using it to improve their business, for example by learning what kind of customers are interested in their products and what the customers think of them
- that of a business based on using the information in social media, summarising it into usable statistics and selling it on to customers.
The first viewpoint represents commonsense, to use all possible ways of gaining insight about prospects and customers; the second viewpoint aligns with what has been called ‘web mining’ services. The case study focuses on the second viewpoint, of creating revenue by providing services, as this is part of the new world of big data. The concept of the first viewpoint is a continuation of database marketing and market research and is fundamental to sound business practice.
Note that there are free, open‐source solutions to web scraping and related activities and that SMEs and companies less willing to pay for services are likely to use these. Therefore, any service you develop must have a unique selling point so that third parties are willing to pay for it. They must be confident of getting extra value over and above what they can do themselves.
Generally, there are three main service areas that your web mining based business needs to offer:
- measuring and understanding performance
- providing tools to measure and manage advertising content
- providing tools to measure and manage audiences.
All these areas aim towards enabling your customers to monetise and optimise their return on investment in social media engagement and their web based presence. This includes them being able to monitor and benchmark themselves against their competitors, and detect market opportunities and identify obstacles to their well‐being.
The requirements of your business therefore include:
- delivering up‐to‐date, near real‐time results
- providing early warnings of trends and challenges in the marketplace, including detecting up‐coming issues and crises
- being flexible enough to incorporate customer feedback and new findings and ideas (see Figure 10.19).
Figure 10.19 Right place, right time.
A public health example, is a web based mining service to help understand teenage pregnancy and thereby reduce its prevalence. It does this by capturing social media output including certain words in a local area. It was found that there was a good association between key words ‘pregnancy’ and the names of various music bands. The public health body could try to access teenagers through their attraction to this specific music and disseminate information that would be helpful to them.
10.7.2 Methods
Setting up the business, we need to decide what areas we are interested in and the depth required, so that we know how we are going to handle and obtain permissions. Accessing limited detail from social media feeds is possible through an ordinary personal social media account. We can use R or other programming languages to capture comments being made in real time. You have to use specific application interfaces (APIs), such as those made available by the social media company. These APIs are typically described in developer and service provider guidelines. Different social media sites are more appropriate for different subjects.
It requires considerable effort to extract meaning from comments. The first step is a thematic analysis of what information is important. A business appraisal needs to be carried out, for example to determine key words and sentiments of interest. The comments then need to be dismantled so that the thematic words can be identified. The relevance and effectiveness of the capture mechanism needs to be regularly validated using an agreed set of example comments. This ensures that the right information is being extracted. Buyers of the information will only be impressed if they feel that the current mood and trends of their customers are being successfully secured.
To access more detail of the user profiles, including their demographics and social connectivity, an application has to be made to the social media provider. For example, if we want to know ages and gender of users, we must apply to the social media provider for access to the profiles. Only those users who have indicated willingness to be known will appear and rules and access differ between social networks.
You can also study your customer’s surfing behaviour if you have been able to use cookies to track their behaviour, or access their log files if you have been given permission. Another opportunity is to use robots. These are programs that read through all kinds of websites, including social media, personal and company websites and blogs. Simple robots search for key words or search terms; complex robots use more developed text mining technologies to look, for example, for sentiments.
The social media data has to be summarised and clearly presented, and made available in an accessible way and be easily interrogated. Dashboards are a convenient way of presenting diverse summary data. An example is shown in Figure 10.20. The bars illustrate the different numbers of interactions (postings, likes, shares, and so on) relating to two specific alternative brands on a particular social media platform in five consecutive weeks. It can be seen the number of interactions for the left‐hand column is increasing compared with the right‐hand column. However, the scaled numbers per thousand followers is greater for the right‐hand side showing that these followers are more active and engaged. So both the graphic and the numbers are informative. Such a dashboard should not only give gross numbers but also standardised numbers.
Figure 10.20 Social media information summarised.
It must be possible to generate reports tailored to the customer and in the customer’s corporate style. As well as gathering information about chosen keywords, the system should be capable of detecting emerging associated words and changes in known correlations between terms. More advanced services include dealing with ambiguous terms and enriching data with product and/or location details, creating networks of users, brands and products, and carrying out data analytics.
10.7.3 Monetisation
Social media data is freely available provided software is developed to access and utilise it and arrangements are made to access as much information about users as relevant.
The value of the service and the summarised data depends on how well it is marketed and what additional services are provided, for example user forums. Value is accrued by you providing a comfortable service that is easy to use and flexible to changes in the business scene.
The target customer is more likely to be a large company who is willing to pay for the information. SMEs are more likely to look for free services. These tend to be transient and often morph into paid services. Subscription technology is mostly used.
10.7.4 Key Learning Points and Caveats
Market knowledge and observation are the key issues. Convenience and usability for your customers are the only reasons why they would pay instead of trying to do it themselves. Therefore your service must be well explained and easy to use and flexible. If your architecture is not as open as possible then you might run the risk of missing new, upcoming, rising social media providers or concepts.
10.7.5 Skills and Knowledge Needed
Business analysis, some programming skills, statistical analysis and graphics skills are all necessary. The ability to simplify, get to the point and communicate well are also needed.
10.7.6 Cascading, Wider Relevance
Clearly there are opportunities in all sorts of areas. The main development is that you can become broad or drill down into industry‐specific areas.
10.8 Service Provider
10.8.1 Background and Content
With more and more data available, all companies need to think about monetisation. However, some companies choose not to undertake the analysis themselves but prefer to use a service provider. Here we consider the monetary exchange involved with providers of external data storage solutions, management technologies and analytical services. There are many reasons for choosing to outsource big data analytics, including:
- lack of skilled staff
- concerns about security risks – data losses or confidentiality breaches when having data analysed on site
- wanting to use the best, most up‐to‐date facilities and techniques.
Outsourcing IT, such as data storage and analytics, has been done for many years. The new issue here is the omnipresence of big data, which makes it necessary for companies to expand on their usual way of doing things. Here we include cloud storage and software as a service.
It is important to visualise data. In the example, Figure 10.21, the vertical axis shows the percentage of people who started looking at an email or document or engaged in some other way who are still engaged after the number of seconds shown on the horizontal axis. The figure shows a lot of people glancing for only a few seconds, some skimming and others spending longer. This demonstrates how people lose interest over time. It is important that content providers understand this drop‐off and make an effort to quantify the rate and nature of the drop‐off so that they can design their content to maximise the engagement.
Figure 10.21 Visualisation of user engagement.
In this case study, we consider a company offering complex CRM systems for hire and, for simplicity, we focus on the service of managing emailed newsletters for clients. This sort of service is popular for all companies who use emailed newsletters as part of their pre‐sales and loyalty strategies and want to build new business or influence.
10.8.2 Methods
The most relevant business analytics are those that aim to determine and interpret clients’ needs and establish baselines regarding their current costs and benefits. Necessary methods relate to knowledge of how to store, maintain and manipulate the service, in this case email addresses and newsletter content, landing pages and hyperlinks (see Figure 10.22). There needs to be good access to testing facilities, experience of charging mechanisms and ability to track and analyse responses. Altogether this means utilising all the statistical analysis and data mining techniques discussed in this book.
Figure 10.22 Concept of newsletter tracking.
10.8.3 Monetisation
Offering a service such as handling newsletters has value because it enables the client to follow all the data protection standards (anonymity and separation between players in the process). It also brings in money from analysing responses, testing different versions and different contents, and enabling the choice of which is the most appropriate. For example, see Figure 10.23.
Figure 10.23 Example report on testing different versions.
The monetisation comes in from the businesses that use the service. There are different models, including pay on demand, but most often the business signs a contract and pays a monthly fee. The level of the monthly fee may relate to the amount of data or traffic or number of customers handled.
10.8.4 Key Learning Points and Caveats
This kind of service is a relatively new development and will increase in popularity, as more companies want to make use of their big data but do not want to invest enormously, at least at the start of their journey. Such services can take the role of providing proof of concept but also have a role to play in providing a service for companies who always want to have the best, auditable options.
Customers can be flighty and change providers freely, so your customer base may churn. Service provision is a highly competitive business, especially as most of it is web based and can be conducted from anywhere in the world where costs (and regulations) may be lighter. From the user point of view, handing over your data to a service provider carries the risk that you become remote from it and lose control over it. This means that there might be the risk of suspicion from the clients that there is some misuse of their data, for example that their data is used to enrich other people’s data or to provide email lists for unrelated promotions.
10.8.5 Skills and Knowledge Needed
As well as the data handling and statistical skills necessary for maximising the potential from an administrative task, we need to know about security and legal aspects. For most clients, a major requirement is that the system is secure, both in the direction of retaining data in good form and also in the sense of unauthorised access. It is also important to adhere to and be able to give guidance on national data protection laws and laws around use of different communication options and the ability to track and analyse on a personal level. In fact, understanding global regulations can be a unique selling point for the service provider.
10.8.6 Cascading, Wider Relevance
Such a service provision can be extended to all sorts of situations in all business and industry sectors. It can also be drilled down to fine detail in a specialist area. Examples would be text mining people’s own archives, phone conversations, records or public sources of documents.
10.9 Data Source
10.9.1 Background and Content
A successful company model, established long before computers became the essential instrument of business, is to collect data on one or more themes from several sources and monetise it by offering insight as a service (IAAS). Much of this data can be obtained from open, public sources and can be enriched by private data arising from commissioned surveys or by other means. The success of this business model lies in the adept tuning of the exchange with customers, ensuring easy access, flexible analysis and clear interpretation.
The unit of observation can be personal, household or local area. Increased granulation brings with it the need for sensitivity to privacy and confidentiality issues and strict consideration of data protection laws. Such companies often support their customers by offering analytics and associated segmentation. From this fundamental analysis, the provider offers targeted addresses for campaigns. These providers differ from social media in two important ways: firstly they give the customers the addresses and the customers can communicate with the chosen sample by post, email, call centres or whatever method they choose rather than being restricted to using the specific social media channels. Secondly, the addresses or observations represent a wider tranche of the population because their data has come from a range of different databases including official sources. This is different to social media sites, which may only represent their niche population; even if this seems to be a large niche it is still restricted to their unique selling point. Social media is inherently biased because the participants are self‐selected; these providers aim for unbiased knowledge.
The service provider of the data sources has a very full picture of buildings, streets, areas and cities but they do not necessarily have all the details of the makeup of the household and may not know everyone who lives on the street. Similarly, they know about companies but may not be up to date, may not have full coverage and may not know all the finer details. Therefore, their knowledge is significant but not complete.
The advantage of this business model for the customer is that they are able to access a wide range of data, request summary information – such as the number of people aged between 20 and 29 – and they can draw samples from it for further analysis. The customer can use the results to decide on whether and where to use diverse methods of advertisement such as the classical billboards to reach customers in an area with a vast customer base from which they expect to draw new customers, or send out ordinary mail shots where there is currently sparse coverage.
The range of data available in the data source model is wide. An example on the customer level is shown in Figure 10.24.
Figure 10.24 Customer profile details.
The kind of profile data relevant for companies includes the number of employees, industry sectors and business age; an example is given in Figure 10.25.
Figure 10.25 Company profile details.
In the data source model the providers aim to have knowledge of everyone in their chosen area, for example a country or a continent. If customers are willing to give feedback, the provider increases their knowledge from the records of all who responded to the customer’s action. If the customer also provides details of who they did and did not contact then the provider also has basic knowledge of all those who did not respond to that specific activity.
The business can be driven by the customer who already has a comprehensive database but wishes to enrich it with other information, such as buying habits, education, interests and estimated income.
10.9.2 Methods
Data must be refreshed to be kept up‐to‐date. If possible, providers should have technical arrangements in place to be informed of changes of address, for example. They should design and deliver surveys to gather additional information to enrich their data. They should have the ability to integrate data from more than one source, matching it over different identifying keys and carrying out de‐duplication. This is very important, as even a well maintained dataset can have up to 3% duplicates. Care must be taken to recognise duplications but also not to delete real cases. There is always a danger of both overkill and underkill.
An additional service is to analyse the data, and this requires predictive analytics and models to find lookalikes for existing customer data. This is invaluable for helping your customers find new customers for themselves.
10.9.3 Monetisation
The whole business is about monetising data. Specifically, it comes from renting addresses for campaigns, providing the service of enriching customer data with extra associated information that either the customer chooses not to invest the effort in acquiring or to which they do not have access. Predictive analytical models are sold to customers to identify potential new and likely contacts.
10.9.4 Key Learning Points and Caveats
Knowing about privacy and data protection laws is a pivotal issue for a successful business. De‐duplication technologies that facilitate integration are never completely perfect and the mismatches that may occur need to be dealt with.
10.9.5 Skills and Knowledge Needed
The provider must be constantly aware of the evolving trends in the market and of innovative step changes. The provider must be adept at data storage and manipulation and competent at communication with customers.
10.9.6 Cascading, Wider Relevance
Although this type of business has been in existence for many years, it is still relevant and can be profitable. It is appropriate in any industry sector and area of interest.
10.10 Industry 4.0: Metamodelling using Simulated Data
10.10.1 Background and Content
In this case study we look at how to use predictive analytics in construction, as an example of a situation where multiple alternatives need to be evaluated by a non‐expert but the evaluation is very complex. Metamodels can provide a workable solution to evaluate risks. The method encapsulates complex expert knowledge, using statistical techniques to build and validate a simpler model.
In most cases, a human expert is needed to run simulation tools, which may be problematic as simulation is often very time‐consuming. An alternative approach is to use metamodels. Metamodels are ‘simplified models based on a model’, where the results come from algebraic equations. They are commonly used to replace time‐consuming complex simulations. The metamodel technique can be used to provide algorithms for simple engineering tools that are easy to use with a small amount of knowledge. Statistical tools to build metamodels are well known. The metamodel approach can be used with a new data stream or a constant database.
Metamodels in the context of computer experiments represent a simplified model of the complex computer analysis, which is based on statistical methods. The aim of the metamodel is to predict the future behaviour of a process without doing the complex computer analysis. The results of the metamodel are an approximation of the output variables defined by a functional relation found statistically. This means the calculated results of the metamodel normally have an error or residual compared to the exact values. The metamodel will not be used to predict exact values, but it can be used to make decisions such as whether the product design fulfills the safety rules or not.
The aim of the case study is to show how the theoretical framework discussed above can be used in the context of construction. A very simple well researched area of construction is chosen because in this case it is easier to get real validation data and compare the results with other findings. As proof of concept, we choose the task of selecting glass panels in facades or doors (see Figure 10.26).

Figure 10.26 Example of glass facades in buildings.
The main research concentrates on the resistance of the glass against soft‐body impact and its safety properties after fracture. The test scenario is generally determined experimentally by an impact test, for example as defined in the European standard EN 12600. In the last 10 years, calculation methods using transient, implicit or explicit finite‐element methods have been developed. These simulate the results of the experiment very well. These methods are now part of the German standard DIN 18008‐4 for facade design. To use this calculation method, complex software tools and detailed expert knowledge is required: knowledge on how to use the program, knowledge about material parameters, element sizes, drop heights and so on.
To get a rough overview of whether the chosen glass panel might fulfil the required safety standard, apart from a physical trial, two simulation methods are given in the standard. The first is the more reliable calculation using finite‐element methods; the second uses analytical equations and substitutes input values taken from charts. This case study describes a third way that combines the advantages of both methods, being reliable, fast and able to be used without expert knowledge.
The question is therefore, whether it is possible to find a metamodel with whose assistance the decision – whether a proposed glass panel is resistant against soft body impact or not – can be made by people with very little expert knowledge or by an automated ordering process via the Internet.
10.10.2 Methods
10.10.2.1 Design of Computer Simulation Experiments
The design of experiments indicates how to do physical tests systematically. Computer simulation experiments differ from physical experiments in that repeated runs of a computer simulation with an identical set of inputs yield identical outputs. A single observation at a given set of inputs gives perfect information about the response at that set of inputs.
10.10.2.2 Statistical Modelling
First we have to decide which input parameters are necessary to create the metamodel. Important parameters in our case study are the glass panel geometry: the height, the width and the thickness of the glass. The strength of the glass is also a very important parameter. There are three different glass types with different strengths as shown in Table 10.4.
Table 10.4 Allowable stress for soft impact.
Source: DIN 18008.
| Glass type | Allowable stress (MPa) |
| Float | 81 |
| Heat‐strengthened glass (HST) | 119 |
| Fully toughened glass (FT) | 168 |
Because the user of the metamodel needs little expert knowledge, ‘glass type’ should replace the ‘allowable stress’ as input for the glass strength. The main input parameters that present the minimum knowledge for designing the glass are shown in Table 10.5
Table 10.5 Parameters used to describe a four‐sided glass panel.
| Parameter | Symbol | Value | Type |
| Glass height | h | 500–3000 mm | Continuous |
| Glass width | b | 500–2500 mm | Continuous |
| Inclination | α | 0–90° | Continuous |
| Glass thickness | d | 6–24 mm | Continuous |
| Glass type | gt | Float, HST, FT | Categorical |
The output results should be the answer: whether or not the clear four‐sided glass panel is able to resist a given soft impact according to the DIN 18008 standard.
After the input parameters are fixed, the designed experiment is created using bespoke software for a space‐filling design that allows the use of categorical input variables.
Note that the metamodel is built from datasets that arise from the computer simulation, and can use any values within the parameter range. However, not all parameter value options are available on the market, but intermediate values can be mapped into the categories available on the market. This is done to make the model flexible in case market categories change with time or application.
The computer program used for the simulation of the transient soft impact is called SJ‐Mepla. It has been created by experts and the results were verified by tests; it is considered reliable. The computer simulation is used to calculate the stresses on the glass for all our input parameters. To get the decision whether the glass panel resists the load from the soft‐body impact, we have to build an output value of a yes/no event. Therefore, the resistance factor, which is the relation between the stresses in the glass coming from the calculation and the allowable stresses for a given glass type, can be used. If the resistance factor FR ≰ 1 the design is sufficiently resistant against soft impact. If FR > 1 the stresses in the glass are higher than the allowable stresses, so it is likely to break and a safety issue might occur.
Bringing all the input parameters and the output results from the simulation using the resistance factor into one data sheet, it is now possible to build a statistical metamodel. The first step is a screening analysis. The results are shown in the half normal plot in Figure 10.27. The glass type and the glass thickness, especially the glass type ‘float’, have the major influences on the result.
![A half normal plot of a screening experiment displaying 2 positive slope lines labeled “Slope 1” and “Slope equal length PSE,” and various markers labeled “Height,” “Inclination,” “Width,” “Glass type [TVG],” etc.](images/c10f027.gif)
Figure 10.27 Half normal plot of a screening experiment.
In Figure 10.28, the resistance factor calculated from the finite‐element model is plotted against the resistance factor predicted by the statistical model. The crosses are the data used for validation. These datasets are randomly chosen values. The solid dots are validation data from the German standard, which lists glass panel and the minimum and maximum values for their width and height. For the validation of the metamodel, only the maximum possible values for the glass panel dimension are taken. The resistance factors of these datasets have values around 1.0 in the figure. Therefore the predicted resistance factor should also be near 1. The metamodel is able to identify these sets. The empty circles are the dataset used to build the statistical model.
Figure 10.28 Predicted vs calculated resistance factor with validation.
Generally from 84 datasets, the metamodel identified 63 that fulfill the requirements and 9 that would fail. For 12 datasets a detailed investigation is necessary, which will usually be carried out by an expert.
The advantage of the metamodel is clear. Instead of testing or calculating a complex set of 84 panels, it is only indicated that 12 models need a more detailed calculation. Alternatively, these 12 panels can be given a new parameter value – say greater thickness –to meet the criteria. This reduces the time and cost. Thus architects and sales representatives are able to calculate at a very early stage which setup will suit the project plans.
10.10.3 Monetisation
The case study shows how complex simulation models, which need a lot of expert knowledge, can be transferred into metamodels, which use input parameters requiring a minimum knowledge about designing glass. The results are not exact values; for the example, the stresses in the glass are only approximate. However, the result provides evidence for the decision of whether the safety requirement is fulfilled or not. The resulting algorithm can be used to build a fast and easy‐to‐use engineering tool that works in the background while a client makes the order for glazing. The customer gets immediate feedback about whether their chosen design meets the safety requirements.
The implementation of the model is fast and easy to use. These types of engineering tool have a great economic impact. With such simple‐to‐use tools, architects or facade planners can check at an early stage of a project if the glazing they want to use fulfils the requirements. Or the sales people from the facade planners can use these tools to make a quick decision during a sales discussion.
The above results show that metamodels can be used to get a first impression of the suitability of a material for the design of a product. This enables the industry to make decisions at a very early stage in complex construction products. In future, the use of metamodels will be extended to further complex problems in the field of construction. For example, a metamodel including climatic loads, wind loads and different shapes that gives reliable estimates could be used as a forecast planning tool for the industry more generally. The results so far indicate that building a metamodel shortens the simulation time with only a small loss of information and without the need for expert knowledge.
Finally, it can be said that using metamodels instead of complex and time‐consuming simulation tools is the start of direct digital manufacturing, enabling the producer/consumer (the prosumer) to design responsibly. Complete automation is possible leading to a ‘create your own’ product environment in which there is no intermediation between consumer and production.
10.10.4 Key Learning Points and Caveats
Statistical modelling can be used to reduce complexity to support decision making. Even in highly regulated industries, provided the model is validated, predictive analytics can be used to reduce the time needed to run complicated analyses. It will enable decisions to be made by customer‐focused non‐experts and even by the customers themselves.
The statistical model is essentially an approximation. However, the accuracy and precision can be increased by increasing the size and complexity of the experimental design. The statistical model can also be used as a pointer to when to revert to the more precise, time‐consuming and complex top‐of‐the‐range analysis.
An ongoing revalidation of the metamodel is always advisable. This will capture any subtle changes in features such as the way the materials behave.
10.10.5 Skills and Knowledge Needed
At the operational level, a non‐expert user of the metamodel must be clear what parameter values are needed as input and that the output will be in the form of three alternative outcomes that they can act on: the glass is safe, the glass needs further simulations before a decision can be made, or the glass is not safe.
To develop such a metamodel using computer‐simulated datasets requires a knowledge of the parameters and their ranges, the types of statistical design available, how to get the design points and how to run the simulations. Then, having generated some simulated data, a model has to be constructed. This process requires the same skills as creating a model using real data, so includes the full toolbox of methods including regression modelling and response‐surface analysis.
10.10.6 Cascading, Wider Relevance
The wider relevance is that this pattern can be used in all industries, especially where you have complex, expensive but reliable and sensitive calculations. The other key feature is that you do not always need great precision and that an approximation is often more than enough. It is not uncommon for predictions from metamodels to be almost as good as more detailed analyses and for the slight lack of precision to be compensated for by the increased speed, cost reduction and saving in time and effort. This is an example of the familiar ‘rule of thumb’ being sufficient for many circumstances.
The methodology can be used in other situations within a company and be cascaded to other departments. This case study complements Section 10.11, in which the price of products with different attributes is explored. In the current case study, metamodels are introduced to predict the resistance factor based on glass attributes. Although the underlying theory is very complex, the metamodel produces a simplified approximation that can be used by a non‐expert. Metamodels can be produced for any product aspect: quality, reliability and safety. After sorting out these aspects, the customer can then use the pricing model set out in Section 10.11 to predict the price of the newly designed, personalised product. This process of exploring and clarifying customer desires can be done before production actually starts and is therefore extremely valuable to the company from an operational and risk‐management perspective.
10.11 Industry 4.0: Modelling Pricing Data in Manufacturing
10.11.1 Background and Content
As mass customisation becomes vital to a company’s success, there will be more diversity of end products. Customers can expect to be able to order products exactly corresponding to their own taste and design. This issue occurs both in B2B and in B2C. Customers who are actively involved in designing their own products are often referred to as ‘prosumers’.
It is useful to have a quick and convenient method of predicting the price of a product from its attributes without having to specify which of the many thousands of components will be used to make up the product. A company typically has thousands of examples of prices for products with different combinations of attributes. Statistically analysing these prices and attributes can provide a way of checking for anomalous prices and also a model to predict the price of a new product containing a different combination of attributes. Clearly some products will be more precisely predicted than others and an important part of the analysis is to study the prediction errors to explore the main causes of discrepancy using data visualisation methods.
The aim is to find a model that predicts the price of the final product with reasonable precision so that an estimated price can be judged with respect to the market and the competition. Once validated, the model can be used to predict the prices for the next month or year’s production. The database of components making up each product can also be explored and visualised to generate ideas and prompt innovation.
10.11.2 Methods
Assuming the cost prices of products with different attributes are known, the data can be analysed to find a predictive model for price based on attributes. As the aim is to predict the price rather than to explain the influences on the price, a model fitting method that minimises the residual between observed and predicted price is used. Different regression models are compared using information criteria and validated using cross‐validation. The resulting residuals are examined and visualised in histograms, scatterplots and boxplots to determine whether the model fits well and is appropriate. Any large errors are examined to see what products and product attributes they relate to.
In Figure 10.29, the residuals are randomly distributed for each of the product types implying that the model fits equally well for each of these subsets. The components making up each product can be represented in a binary matrix in which each row is an end product and each column is a component; the matrix entries are 0 when the end product does not use the component and 1 when it does. The binary matrix can be visualised using dimension reduction techniques. This allows an understanding of the variation and it is also a way of detecting outliers.
Figure 10.29 Residual plot of prices.
Figure 10.30 shows an example of the use of T‐SNE (see Section 6.3.5) to explore the data. In the two‐dimensional representation of the components, each spot represents a product. The spots can be coloured according to other knowledge about each product, for example its power rating, size or grade. The presence of clumps of same coloured data points rather than a totally random spread of colours is interesting and shows that there are similarities in component mix related to the different product groups A, B and C. Process owners can examine the T‐SNE plots and investigate any points that are out of their clusters to see if there are identifiable reasons for them to differ.
Figure 10.30 Visualisation of groups of products.
These are just two analytical options for this sort of data. To make the results really useful there needs to be an interactive user interface. This would enable flexibility in the choice of features for the grouping or colour coding in visualisation plots, case details of outlier values to be displayed at the click of a mouse, and similar products to be shown for comparison.
10.11.3 Monetisation
From a detailed lists of products, attributes and components with associated prices, statistical analysis methods can create order and enable unusual values to be identified. Accurate and precise price predictions for a customised product can be made. These price predictions can be provided for any combination of attributes and make it easier to forecast financial flows for the next period.
10.11.4 Key Learning Points and Caveats
Production data can be tamed. The assumption that pricing is a well‐behaved combination of values for attributes may not hold for new designs. For example, there may be new attributes or new interactions between attributes that result in more expensive or cheaper final products. Until these cases are included in the training dataset, clearly they cannot influence the statistical models and prices cannot be predicted for them. It is therefore important that a check is kept on the ongoing precision of the models and that they are rebuilt periodically. The more data available for the model building the better the models that can be built.
10.11.5 Skills and Knowledge Needed
Although the actual model building can be automated, using statistical methods requires an understanding of how the data is entered into the models, how models are built and how predictions are made. The models need to be visualised and, for increased flexibility and easier data interrogation, an interactive user interface needs to be built.
10.11.6 Cascading, Wider Relevance
The idea is relevant wherever there is a situation of knowing past cases but needing flexibility to predict new cases based on new combinations. It is particularly important where customers wish to find out price ranges for their own designs and customised products. The methodology can be used for any situation where there is input information and a corresponding final value.
This case study complements Section 10.10, in which the safety of glass with different attributes was explored. Metamodels were introduced to predict the resistance factor based on glass attributes. Although the underlying theory is very complex, the metamodel produced a simplified approximation that can be used by a non‐expert. Metamodels can be produced for any product aspect, including quality, reliability and safety. After sorting out these aspects, the customer can then use the pricing model to predict the price of the newly designed, personalised product. This prediction process of exploring and clarifying customer desires can be done before production actually starts and is therefore extremely valuable to the company from an operational and risk management perspective.
This approach has applications in any situation where you wish to price an item based on its attributes. Thus it could include housing, vehicles and any kind of new or used items where you can describe the item and it has different features and you have a database of historic prices.
10.12 Monetising Data in an SME
10.12.1 Background and Content
Companies who have collected data as part of their core business, for example financial advisers, health advisers and expert systems in general are in an enviable position to monetise this data and add another income stream to their business.
This case study focuses on a small and medium enterprise (SME) that sells an expert system that recommends equipment to help older people stay independent in their homes for longer rather than moving into residential care. In order to obtain the recommendations, the user completes an assessment, supplying personal data relating to their physical condition, their environment and their capabilities. Although the data is collected for a specific purpose it can be used for a wide range of different applications, many of which are of direct value to specific stakeholders. This monetisation will bring new sources of revenue to the company. The assessments are strictly confidential and all analysis is carried out on redacted data and only aggregated data is reported.
The ageing sector is very important. The population of those over 65 years old is increasing globally. This increase has financial implications, both for the state and for their families. It has also created a demand for more data, to help everyone understand and resolve ageing issues. It has latterly been assumed that to deal with the increase in an ageing population, governments should increase the number of residential care homes. However, evidence suggests that staying at home for as long as possible has far greater financial, health and psychological benefits for elderly people than going into a residential care home. Any reduction in the time spent in residential care could create very significant savings for governments’ social care budgets, at a time when they are under pressure due to the increase in the elderly demographic and funding shortages, as well as reducing the emotional and financial cost to families of elderly individuals.
For older people to stay at home for longer, they need to feel safe and to be able to complete activities of daily living (ADLs), such as washing, dressing and feeding. Rather than the first response being residential care homes, individuals can be assisted in completing many ADL tasks at home, through the use of assistive technologies.
It is not always clear which assistive technologies will be the most appropriate for each individual and the current socio‐political‐medical environment means that there are frequently long waiting periods to identify these. There is a growing need for the interrogation of information resources in order to understand which technologies are best to use in each situation.
For many cases, assistive technologies are either unsuitable or the technology or product simply does not exist to resolve the problem. In the assistive technology market, it is quite common for products to have been developed specifically for an individual who has a need or requirement, then the product is mass‐produced and sold. When the product is bespoke, it is not necessarily suitable for all who present with similar difficulties. Analysing the assessments collected over the years can provide evidence to support the need for new products and motivate manufacturers to develop them.
10.12.2 Methods
The company aims to monetise their big data to provide a new service and a new income stream. The company could very easily become a data broker, simply selling data as an additional revenue stream. However, this would be a poor strategic decision, as any competitor could copy their data, and so could also copy their business models and possibly acquire their current and future clients. An alternative approach is for the company to become an insight innovator, using its data to offer insight to different stakeholders, and this is the approach chosen.
To understand the sources of insight, the next step is to identify the dimensions of the data. The company’s data is created by an expert system. This guides users with an ADL problem through questions that assess them against criteria determined by clinical reasoning, as recorded by a team of product experts and occupational therapists. Depending on the answers given, the expert system then matches the user to suitable and safe solutions (both products and services). The assessment data has four dimensions:
- Problems: the activity of daily living for which the user wants help
- Questions: the individual questions answered by the user
- Users: the individuals wanting help (note that that a user can carry out several assessments for different problems)
- Solutions: the products and services offered (or not offered) at the end of an assessment.
As stated above, the data is particularly sensitive and so confidentiality is a big issue. The data is anonymised before being analysed.
As in most data monetisations, the company is well‐advised to consider what open data, especially official statistics, would enrich the dataset and provide a benchmark (see Figure 10.31). Accordingly the company’s database was enriched with publicly available data from the Office of National Statistics and Public Health England.
Figure 10.31 Open data available to enrich company data.
The next step is a stakeholder analysis. After discussion and brainstorms amongst company personnel, the company’s stakeholders are considered to be:
- manufacturers
- suppliers
- retailers
- health professionals
- academics and researchers
- government authorities and budget holders
- policy makers
- designers of services suitable for three generations, such as hotels, shops and homes (for children, parents and grandparents) and offices (for young adults, middle aged and older people)
- the company itself as an internal customer.
The four data dimensions and the nine stakeholders are shown in the relational matrix in Table 10.6. The ticks indicate the strength of importance of each data dimension to each stakeholder.
Table 10.6 Data dimensions and stakeholders.
| Level of interest in data dimension (✓ low–✓✓✓high) | ||||
| Problem | Question | User | Solutions | |
| Manufacturers | ✓✓✓ | ✓✓ | ✓✓✓ | ✓✓ |
| Suppliers | ✓✓ | ✓ | ✓✓ | ✓✓✓ |
| Retailers | ✓ | ✓ | ✓✓✓ | ✓✓✓ |
| Health professionals | ✓✓✓ | ✓✓ | ✓✓✓ | ✓✓ |
| Academics and researchers | ✓✓✓ | ✓✓ | ✓ | ✓ |
| Government authorities | ✓✓✓ | ✓ | ✓✓ | ✓ |
| Policy makers | ✓✓ | ✓ | ✓✓ | ✓ |
| Three generational designers | ✓✓✓ | ✓ | ✓✓ | ✓✓✓ |
| Internal customer | ✓✓✓ | ✓ | ✓✓✓ | ✓ |
The manufacturers are interested in what products are recommended most often and also which problems have no solution. Clearly, they can then start to think how to satisfy these needs. The suppliers and retailers are interested in which products are recommended together and the likely demand in different geographical areas. They can use the information to help decide on stock levels and shelf displays, determine offers, delivery options and further up‐ and cross‐selling opportunities. Some solutions depend on being matched together in order to help the user. The data make it possible to observe the strength of associations between solutions. Such products and services can then be displayed together in brochures or retail outlets.
Health professionals are interested in the frequencies of different ADL problems, the answers to the different questions and the demographics of the users. Academics and researchers have wide‐ranging interests. Government authorities and policymakers need to know more about the demographics of their population. Three generational designers are particularly interested in which solutions are most often recommended. Internal customers are interested in all aspects of the data, to help them continually improve the system and innovate.
There needs to be an interactive system for the new customers to indicate what they want to know about. Thereafter data visualisation methods generate the insights. Popular choices include bar charts, scatterplots, pie charts, Pareto charts, box plots and time‐series plots. Dimension reduction techniques, such as cluster and principal components analysis, give a deeper interpretation of the data, as do decision tree analysis and statistical modelling.
10.12.3 Monetisation
The company’s motivation is for insights from this data to have a positive impact on the ageing experience. It will sell relevant and useful data insights to organisations within the assistive technology market, and interested external organisations, adding a new and sustainable revenue stream to the company. The company considered four main revenue strategies for insight monetisation, as described in Section 8.5.3. Because the stakeholders value the data dimensions differently it would be unfair to price sales to them in a general way. From the four revenue models, the relational matrix shows that the ‘points’ model is the most applicable model for all but internal customers. The advertising model could also work in addition to the ‘points’ model to generate more revenue for the company.
The development of new revenue streams derived from selling data insights is an exciting proposition for companies for growth and expansion. In the assistive technology market, in particular, providing the right products and services in the right quantities and in the right places is extremely important. The company’s insight innovator business model is a move in the right direction and prospective sales are likely to repay the company’s investment in time and resources.
10.12.4 Key Learning Points and Caveats
The barriers, challenges and opportunities faced by SMEs in the ageing sector are many and complex and change with time. However, SMEs play an important role in this sector as they can be flexible, local and specific. They generate masses of data, just as do large organisations. However, most SMEs are not using their data to develop new business and improve processes and increase revenue. The growth of data science and big data analytics in large organisations risks leaving SMEs behind. SMES need to nurture people with skills in IT and data analytics coupled with business knowledge. If they do not, the shortage and expense of such personnel will become an increasing problem. If commercial sensitivities and confidentiality issues permit, working together in pools in which SMEs share experts, IT platforms and best practice could provide a viable solution that would mitigate against the problem of incorrect or misleading analysis of data through poor experience in data handling, statistical analysis and adapting results to the business.
10.12.5 Skills and Knowledge Needed
The main skills required are data handling and the ability to understand the structure of data, business knowledge of the processes involved in helping people with ADLs, and recognising the business stakeholders. These skills and knowledge are all part of the business awareness that is vital for any data analytics.
Confidence in preparing reports and illustrating them with meaningful diagrams tailored to the stakeholder are also necessary skills. Practitioners need creativity to make use of the insight.
10.12.6 Cascading, Wider Relevance
The development of new revenue streams derived from selling data insights is valuable in other commercial environments, such as pensions and insurance, and for other data‐rich service providers. Once SMEs get started with monetising the insight from their big data, they can apply the methods to any sets of extensive customer data collected over a period of time. As more case studies become available to showcase the process, more SMEs will be encouraged to engage.
10.13 Making Sense of Public Finance and Other Data
10.13.1 Background and Content
The changes in stocks and shares prices are clearly important for understanding how a country’s economy is changing. Much financial data is unrestricted and can be gathered and analysed for many different purposes. Although you can copy the data yourself, obtaining it in direct‐feed form usually costs money for the convenience and time saving.
You can choose to analyse an index such as the FT100 or S&P500 or follow individual stock prices or a particular sector. This case study focuses on financial data as a primary source of raw data. Even without integrating it with data from other sources, much can be learnt from its analysis. Many amateurs spend hours poring over financial data in the hope of predicting extraordinary events and acting on them before anyone else. There is a whole science of ‘technical analysis’, ranging from straightforward techniques of short‐ and long‐term smoothing, constructing oscillators from smoothing ratios and beta coefficients from regression analysis, to time‐series analysis, neural networks and deep‐learning techniques.
The aim is to predict the unexpected or to find one or two stocks and shares that might be indicators of imminent changes. Some shares are aggressive and move up and down quickly with changes in the market benchmark and others are recessive, responding more slowly. A portfolio of shares that is balanced in these two types may be more resilient to major catastrophes. This insight can be acted upon by yourself or it can be sold on to others as a paid service. Investment experts are not necessarily expert in data extraction and manipulation. You can earn money from providing this service independent from what actually happens in the stock market, provided your guidance is sensible and useful. In other words, your monetisation service is without risk provided it helps your client be successful, regardless of whether stocks are going up or down. The cost is the time taken to do the analysis.
10.13.2 Methods
Data visualisation is vital and includes time‐series plots with moving averages and other smoothing techniques. Stocks and shares can be grouped by applying different methods of cluster analysis such as K‐means and diffusion mapping. The methods attempt to reduce the dimensionality and group the stocks and shares in interesting ways that can be usefully interpreted. Figure 10.32 shows a two‐dimensional summary of a year’s worth of share prices and clusters of points corresponding to different types of company shares.

Figure 10.32 Diffusion map showing clusters of shares.
New analytical and data mining techniques are applied all the time as even a tiny bit of insight can lead to massive advantage.
10.13.3 Monetisation
Clearly understanding the patterns in financial data helps to interpret the trends in the economic climate. By visualising, we can add value to the data, making it easier for experts in finance to see what is going on and add their insight. This saves time (and money) for the experts, who are therefore willing to pay for such a service. In this way innovation is encouraged, which is a valuable commodity. Data visualisation can also be used as a monitoring tool. For example, it might illustrate how the clusters move and also if the structure is changing, which might then give a warning of important changes ahead.
10.13.4 Key Learning Points and Caveats
This kind of service is a relatively new development and will increase in popularity: more companies want to make use of public data but do not want to invest enormously in understanding the techniques and doing the analysis themselves. Rather than committing to full‐time permanent employees, it is cost effective to buy in reports from experts who can do the analysis quickly and perceptively. If all your competitors use the same service, then you lose your competitive advantage. You can try to negotiate exclusivity or integrate your own data so that the service is customised to you.
10.13.5 Skills and Knowledge Needed
As well as the data handling and statistical skills necessary for deciding what data to access and what methods are best for your service, you need to keep up to date to see what new methods are being used. The data visualisation has to be suitable for a wide audience, with clarity and good design. Journalistic skills are invaluable and worth buying in if you do not have them.
You need to know about the legal aspects of accessing data and making sure the system is secure, both in the direction of retaining data in good form and also in the sense of unauthorised access.
10.13.6 Cascading, Wider Relevance
Using public data that is industry specific can be relevant in all businesses.
10.14 Benchmarking who is the Best in the Market
10.14.1 Background and Content
Benchmarking is important for comparing your business with others. Typical questions that benchmarking addresses are:
- How is it done in other companies?
- What are the underlying processes?
- How good are we in comparison to our competitor or to the market itself?
- How loyal are my competitors’ clients?
- Where can we learn from others and improve our production or services?
The answers to all these questions are difficult to get, but if accessible they will boost your success. Sometimes there are studies already available that will provide answers. Some reports are free; others will cost a lot of money. The search for benchmarking feeds a thriving, extensive industry trying to generate the answers and provide surrounding knowledge. This is a clear example of getting money out of data. There is a full range of service providers, institutes and market research companies offering to compare your company with others in the market or to give you a market overview in specific areas. This is not a new business. It relies on primary and secondary data. In this application, data generates business twice over: firstly for the service providers and secondly for the companies using the survey results to improve their processes, client relations and products.
10.14.2 Methods
Key requirements are sound survey sampling and avoiding bias. Research results must not be reliant on a subset of companies who are willing to provide information. Results must not be biased by the person who is interviewed, the interviewer or the way the answers are collected. There is a very thin line between the interviewer probing to find something unexpected and giving too much guidance in the way a question or the response options are presented. Industry best practice should be employed as a reference point to measure and describe the way the company handles their business.
For fast‐moving consumer goods, a panel of users is often gathered. The panel members are interviewed on a regular basis and new client‐specific questions will be added as required. The specific questions are only temporarily added and the answers are only presented to the related client. All other clients will just get the results for the standard questions.
In a one‐off or a regular panel study, the sampling strategy can involve designed experiments to ensure a representative unbiased result, minimising the survey cost and still achieving an approved, agreed quality level. The factors in the designed experiment could be geographical or process‐related as shown in Figure 10.33.
Figure 10.33 Sampling approach for benchmarking in China.
The results are handled with relatively straightforward descriptive and explorative statistics. Bespoke indices can be developed for standardisation and comparison, and this practice is recommended. The impact of single questions on the full results can be explored, for example using a partial least squares structural equation modelling approach; ‘what‐if’ scenarios can also be examined (see Figure 10.34).

Figure 10.34 Three‐step approach to survey analytics.
10.14.3 Monetisation
Generating the survey and selling the data and insights as products is the core business of many market research companies. The big market research companies base their business on three different kinds of study:
- panel with subscribers getting the results on a regular basis
- individual research based on individual needs
- publicly available studies or services that can be purchased, usually through a website.
These may include intelligent maps where you can see buying behaviour, for example on zip code levels.
Clearly understanding the patterns helps in interpreting the trends in the economic climate. By visualising the data we can add value, making it easier for experts in other areas, such as finance, to see what is going and enriching their own insights. This saves them time (and money) and so the experts are willing to pay for such a service. Visualisation can also be used as a monitoring tool to show how buying behaviour or the market structure is changing, giving warnings of important upheavals ahead. In this way innovation is encouraged. This is a valuable commodity.
10.14.4 Key Learning Points and Caveats
This benchmarking service is not new, but with the growing awareness of the power of data and data‐driven knowledge it is becoming more and more interesting to clients who did not think about it years ago. The general idea is to generate a service that enables ‘go or no‐go’ decisions, which can be rolled out to wider fields of data usage. It is important to concentrate on the way the raw data is collected and make sure that the results can support more general business problems. Be aware that it is very likely that the results and conclusions from a survey will be used in areas that were not a focus when the data were collected.
10.14.5 Skills and Knowledge Needed
As well as the data handling and statistical skills necessary for deciding what data to access and what methods are best for your business, you need to keep up to date to see what new methods are being used. The data visualisation has to be suitable for a wide audience, with clarity and good design. Journalistic skills are invaluable and are worth studying or purchasing.
You need to know about the legal aspects of accessing data and make sure the system is secure both in terms of retaining data in good form and also in the sense of preventing unauthorised access.
10.14.6 Cascading, Wider Relevance
Using data that is industry specific can be relevant in all businesses.
10.15 Change of Shopping Habits Part I
10.15.1 Background and Content
Shopping habits are changing markedly. In Sections 10.15–10.17 we explore new data‐driven concepts of shopping.
Companies in the retail sector, and especially those with high street shops, are facing a tremendous change in shopping habits. This change started years ago when online shopping began; customers started using shops for offline consulting and problem solving (for free) and then left the shops to search online for a cheaper price at which to buy. All the changes are triggered by data and the ability to educate ourselves online and do our shopping via a personal device where and whenever we choose. These new shopping habits mean that company owners need new solutions to stay in business. As well as coping with high rents and employee costs, shops need to create a memorable and unique customer experience. Big brands are changing their selling concepts. They are trying to combine the advantages of a tangible offline experience and consultation with smart online solutions that build on customer experiences. We see the emergence of three streams of selling concepts:
- The customer should have a unique and rare experience that makes them feel special.
- The customer should be able to test virtually and buy only afterwards.
- Shopping needs to be accessible and fast, especially where the products require little intervention, such as milk, orange juice, tissues, washing powder and bread.
In this case study, we will concentrate on Stream 1: the customer should have a unique and rare experience that makes them feel special. This type of experience can arise in a number of different ways. For example, in the flagship store of an international jewellery brand in the Tokyo district of Ginza, couples can search through an animated, virtual reality picture book customised to their exact situation and available when searching for their perfect wedding rings. They can create a personalised photo love story for social media. In this way, the shop creates an experience that the customers will remember and be able to share with their friends. The memory is attached to the product (in this case the rings) themselves, to the love story and most importantly for the shop, to the brand and/or the shop itself. This does not cost the shop very much and produces a multimedia adventure tour which is a romantic addition to the selection of wedding rings.
There are many other examples including:
- An international automotive brand that enables their showroom with virtual reality and gives customers the chance to take a virtual test drive or to explore the inside of an engine.
- The testing does not need to be virtual: a well‐known skateboard brand offers a real trial environment for customers to test new skateboards (see Figure 10.35).
- An electrical retailer that introduced a robot called ‘Paul’, who welcomes customers to the store and goes even further for those customers who are registered by giving them a personalised welcome.
- The ‘Slender Vender’ which is a gimmick that makes people remember the Diet Coke brand and point of sale because it launched the thinnest beverage machine on the street.
- 3M, who stacked millions of dollars in notes behind glass to promote their new safety glass and demonstrate their confidence in its strength.

Figure 10.35 Skateboard offer.
If shopping is a memorable experience then retailers can retain the sales or at least ensure that their brand is purchased even if online. The shopping experience is an opportunity for retailers to counteract their irritation about customers who seek advice in the shop but buy online. The retail outlet can even attach jammers to prevent customers from making online price comparisons. As a compromise proposal, e‐commerce can become the transaction area and the shop becomes the trading experience area. In other words, we go to the store only to let products be explained and tested: like the sleeping bag in the ice chamber or the canoe in the test pool at the outdoor equipment supplier in Berlin. In Dubai, there is a mall with a ski hall and a beach and even an amusement park. The ‘top stage’, a flagship store in a popular location, should offer good information, creating an experience so strong and unique that the customer will not buy anything but the authentic product. Then it does not matter whether the customer buys online or offline.
10.15.2 Methods
To follow the strategy, a big data solution is required to collect and measure every customer interaction with the brand/business at all touchpoints. This will allow the company to monitor these cross‐channel selling strategies and to provide an adequate follow‐up throughout the different phases of the consumer journey (see Figure 10.36). This involves basic descriptive analytics including the use of KPIs.
Figure 10.36 Customer journey.
To generate a relevant customer experience for each single customer it is important to predict customers’ desires and needs by predictive models, or at least to predict their behaviour based on distinct customer segments. The findings from the descriptive and predictive analytics are applied to optimise the shopping concept. For example, customers may have preferential access to special offers and this will generate unique shopping experiences, which can be different for each individual or segment of customers.
Augmented and virtual reality, as in the case of the jewellery example, may be one option; another might be a virtual personal shopping assistant who will help customers based on the results of previous transactions and interactions. This guide is like shopping with a good friend. The level of detail and personal data has a big influence on how individual the shopping experience might be. In case detailed data for each customer and prospect are not accessible, market research data is a second‐best option, which can give a good solution on the basis of a customer segment. Most of the actual solutions are created at this level (see Figure 10.37), but with increasing digital interaction even in the shops, after identifying yourself by your device, a display may change or a specific access may be created just for you.
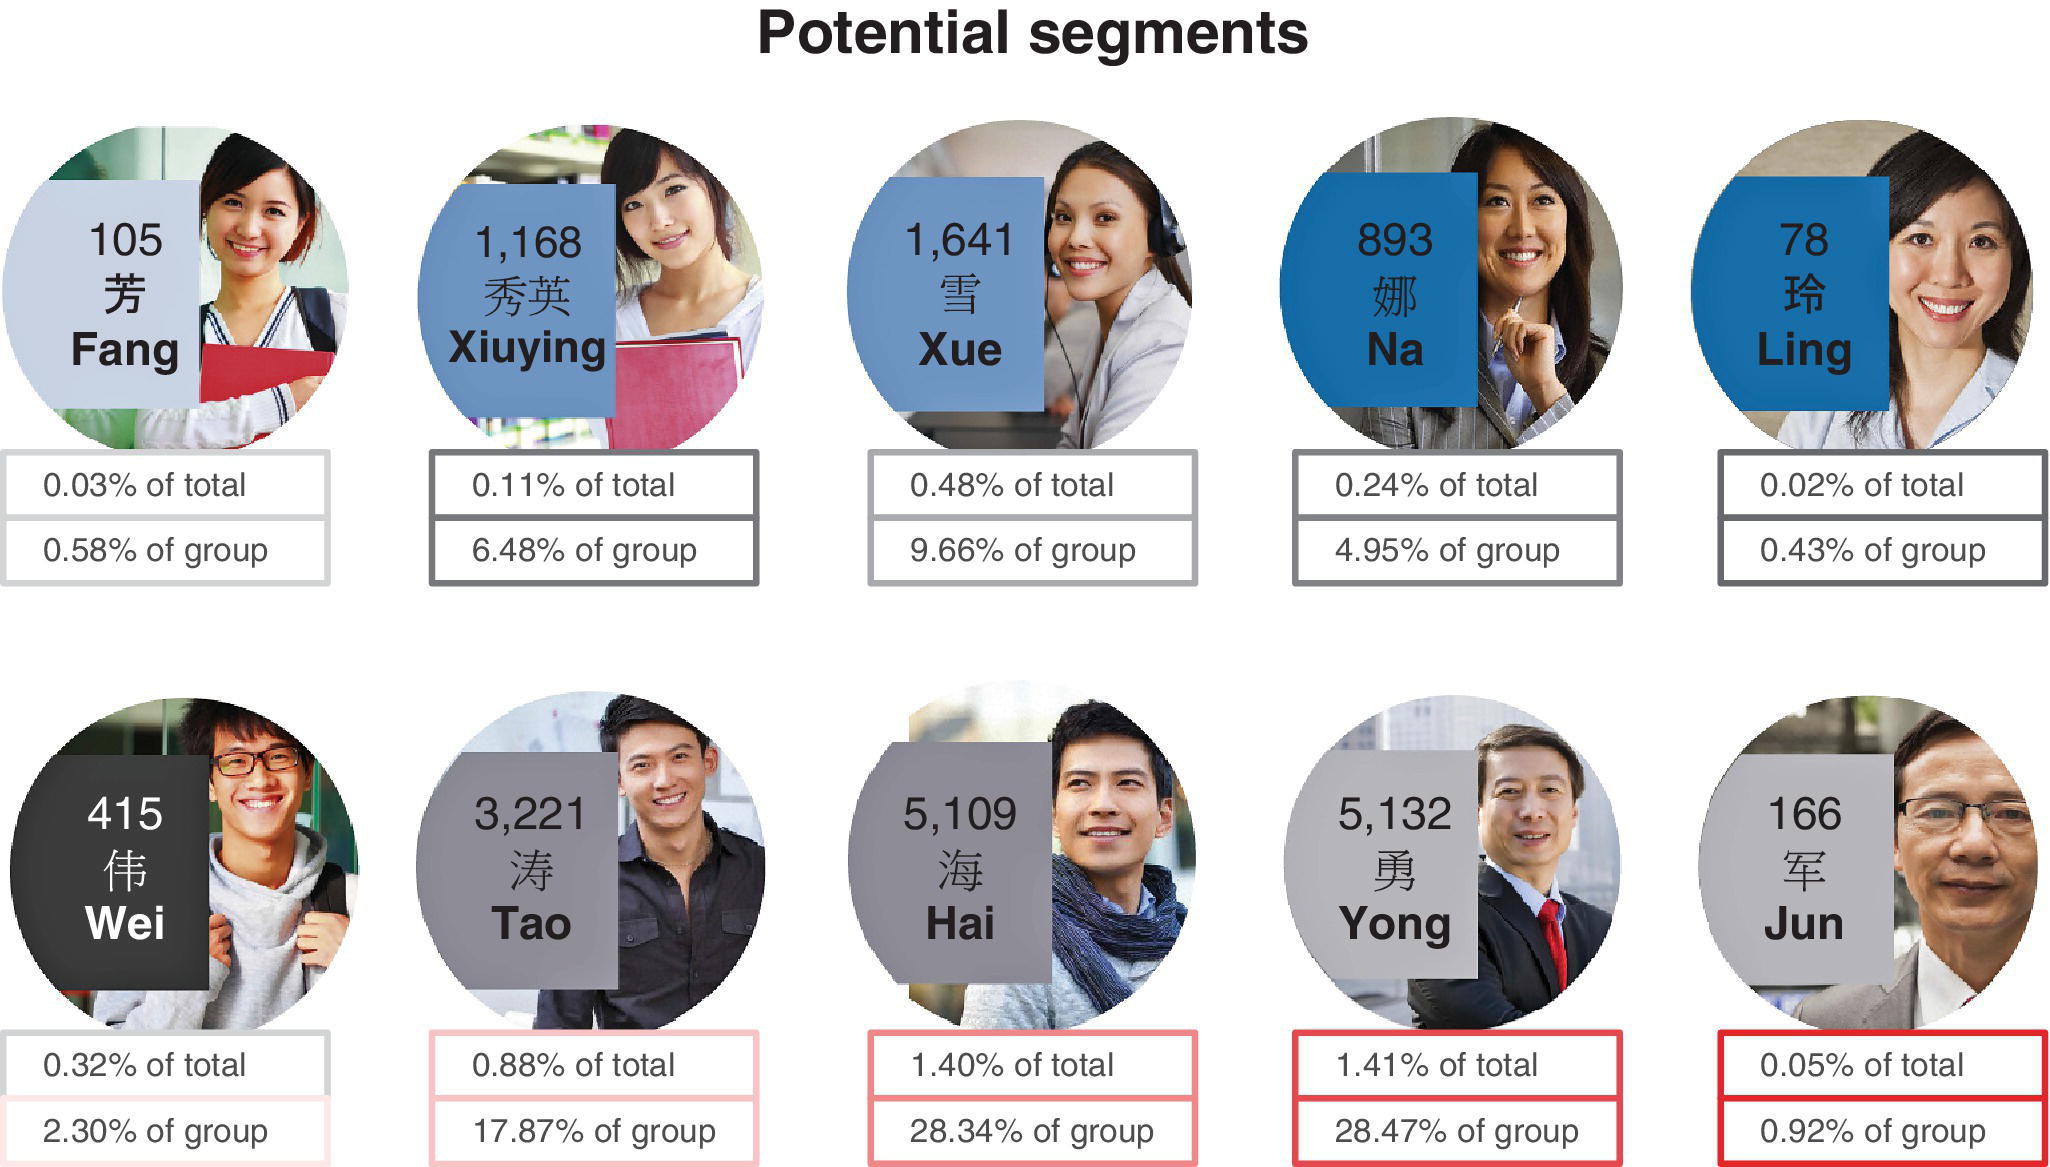
Figure 10.37 Example of customer segments.
Part of the sales process is creating tailor‐made offers that the customer can receive on their smartphone with the aid of Beacon technology, if the customer allows it. Companies that can effectively interlink the virtual and real worlds will be able to survive in the new, changed media world.
10.15.3 Monetisation
The payback comes from better customer loyalty and increased profits because resources are only invested where they are required and are likely to add value. Because the business insight derives directly from the data, these businesses depend absolutely on good‐quality, reliable and extensive data from their customers. The investment is not only evident in the shop itself; it also improves the brand value and online revenues. Consequently, although on a shop level the costs may not seem worthwhile, the overall benefits are considerable and the exercise has to be seen in its totality.
10.15.4 Key Learning Points and Caveats
This kind of service is not at all new, but with the growing awareness of the power of data and data‐driven knowledge, it has come to the attention of clients who previously were not at all interested. The general strategy of using your own business data as a service can be rolled out to wider fields of data usage that are not in focus when the data are collected.
The only key issues to concentrate on are the way the raw data is collected and making sure that the results can support these more general business problems. This means ensuring that the data is capable of identifying individual customers, or at least their customer segment, so that the results can be delivered on a personal level. The data needs to include a wide range of attribute data and be time‐stamped so that we can be sure of being able to learn from it.
10.15.5 Skills and Knowledge Needed
As well as the data handling and statistical skills necessary for deciding what data to access and what methods are best for your business, you need to keep up to date to see what new methods are being used and what your software is capable of. The data visualisation has to be suitable for a wide audience, with clarity and good design. Creative skills are invaluable in combining the results from the analytics with shopping concepts and marketing methods. Communication skills are needed to bridge the gap between these different ways of thinking.
You need to know about the legal aspects of accessing data and make sure the system is secure, both in terms of retaining data in good form and also in the sense of preventing unauthorised access.
10.15.6 Cascading, Wider Relevance
Using customer‐specific data produces insight that can be beneficial and is in fact vital in all businesses seeking to survive and flourish in the new media age.
10.16 Change of Shopping Habits Part II
10.16.1 Background and Content
Shopping habits are changing markedly. In Sections 10.15–10.17 we explore new data‐driven concepts of shopping.
Companies in the retail sector, and especially those with high street shops, are facing a tremendous change in shopping habits. This change started years ago when online shopping began; customers started using shops for offline consulting and problem solving (for free) and then searched online for a cheaper price at which to buy. All the changes are triggered by data and the ability to educate ourselves online and do our shopping via a personal device where and whenever we choose. These new shopping habits mean that company owners need new solutions to stay in business. As well as coping with high rents and employee costs, shops need to create a memorable and unique customer experience. Big brands are changing their selling concepts. They are trying to combine the advantages of a tangible offline experience and consultation with smart online solutions that build on customer experiences. We see the emergence of three streams of selling concepts:
- The customer should have a unique and rare experience that makes them feel special.
- The customer should be able to test virtually and buy only afterwards.
- Shopping needs to be accessible and fast, especially where the products require little intervention, such as milk, orange juice, tissues, washing powder and bread.
In this case study we will concentrate on Stream 2: the customer should be able to test virtually and buy only afterwards.
Shopping itself is either seen as pleasure and entertainment or as a necessary evil. To try on different shoes or to use the changing rooms is on the one hand a fun factor but on the other hand it can be tedious. To please the second group, those who do not like shopping as an event or who use online shops but like to try first, technology plays an important role.
As simulation technologies transform the apparel shopping experience, retailers must decide how rapidly to embrace this innovation. Several technologies are on the market to create a solution and to enable product testing or fitting without touching the real product. One example is virtual changing rooms, in which a virtual tailor’s mannequin with the customer’s body measurements tries the clothing on as a proxy for the customer. An example is shown in Figure 10.38.

Figure 10.38 Virtual changing room.
Augmented reality virtual fitting rooms come next, or interactive mirrors, 3D scanners and holographic sales assistants. Together, these create an experience of the product of choice that is near to real testing but allows the customer to stay at a distance or to reduce their personal involvement.
For example, the customer can stay dressed and they can see how the new pullover, for example, suits them. Or they can instantly try a different colour or pattern or style. Digital mirrors ensure that clothes in additional colours are projected onto the customer’s mirror image. Or the customer can look around, for example, in the kitchen that they might buy. Most big brands are already using this combination of real and virtual worlds. In some markets, customers can plan their home furnishings wearing virtual reality headsets. Virtual reality is increasingly becoming a fundamental feature of the shopping process.
10.16.2 Methods
The type of technology needed depends on the place where the new technologies are going to be used; the setup is different whether it is in a store or in an online environment. It also makes a difference whether the in‐store version comes with or without a link to the customer data.
The statistical methods to be used are straightforward; the key issue is how to get the data. If there is no link to the customer data then it must be captured by scanning the person and/or having an interface through which the customer can enter critical measurements about themselves. These include shoe sizes, height, waist, chest, arm length, and neck size. Some people are sensitive about these measurements and it is possible to keep them confidential and to destroy them after use if the customer feels strongly about it. If the customer is not sensitive about the measurements they can be kept and provide useful background information to the store managers. This is particularly important when matching size to style, colours, brands and trends. The journey from initial concept to final purchase is also extremely valuable information. The items that initially attract the customer are of as much interest to the fashion ‘buyers’ as the actual purchases. Transaction analysis only reveals what was bought and does not give any information about what was the draw for the customer. Traditionally, this additional information could only be found by customer surveys, focus groups and interviews with shop sales assistants.
If the store is linked with the customer database and the current customer is one of those linked in, the store can benefit from noting changes in the customer’s measurements and characteristics, for example if their hair colour has changed. They can also learn from the changing buying behaviours and use them to construct better predictions of likely purchases.
Considering the online version, it is difficult to work with optical scanners as not all customers will have the necessary equipment available. You are now more reliant on measurements volunteered by the customer. The data collected on the customer and their habits can be used to improve the business.
There needs to be a fail‐safe mechanism to ensure that the data collected is meaningful and consistent with reality. An obvious check is for measurements to be in a feasible relationship to each other. Once the data is available, methods of statistical modelling and prediction can be applied.
10.16.3 Monetisation
Clearly understanding the patterns helps businesses interpret the trends in the economic climate and upcoming buying trends. Today all retailers use transactional data to monitor existing business and predict future business; the data collected by the virtual shopping assistants will add a new level of detail.
By visualising this data, we can add value to it, making it easier for experts to see what is going on, and allowing them to add their insight. This service saves time and therefore money. In this way, innovation is encouraged which is a valuable commodity. The data can also feed a monitoring system, which can give a warning of important changes ahead.
We distinguish between the knowledge that is provided for the retailer and the knowledge that is of value to the producers or brand owners. Selling this knowledge to the producers or brand owners might be a source of income to the retailer. With this strategy of providing virtual experiences, the retailer has the opportunity to explore new products and have a better feel for what sizes, styles, colours and combinations are likely to sell.
10.16.4 Key Learning Points and Caveats
Information gathered in this way should be encouraged and fully utilised. Businesses can embrace new technologies and in conjunction with improved data analytics they can provide better customer service and also open the door to valuable insight into changes in behaviour.
As a caveat, the data must not be allowed to stop the retailer being open to new ideas. Past data can only reveal what is in the past, and not what is over the horizon.
10.16.5 Skills and Knowledge Needed
As well as the data handling and statistical skills necessary for deciding what data to access and what methods are best for your business, you need to keep up to date to see what new methods are being used. The data visualisation has to be suitable for a wide audience, with clarity and good design. You have to have computer science expertise and skills in these new technologies. You also need to be flexible and able to adapt as newer technologies come on stream.
You need to know about the legal aspects of accessing data and make sure the system is secure, both in terms of retaining data in good form and also in the sense of preventing unauthorised access.
10.16.6 Cascading, Wider Relevance
Customer measurement and behaviour data has broad applications. This kind of virtual reality technique can be used in any environment where the outcome is difficult to determine. For example, it can be used to simulate an unbuilt house, or to explore the implications of changing external factors such as road structure and architecture. It can be widely used in decision making processes.
10.17 Change of Shopping Habits Part III
10.17.1 Background and Content
Shopping habits are changing markedly. In Sections 10.15–10.17 we explore new data‐driven concepts of shopping.
Companies in the retail sector, and especially those with high street shops, are facing a tremendous change in shopping habits. This change started years ago when online shopping began; customers started using shops for offline consulting and problem solving (for free) and then searched online for a cheaper price at which to buy. All the changes are triggered by data and the ability to educate ourselves online and do our shopping via a personal device where and whenever we choose. These new shopping habits mean that company owners need new solutions to stay in business. As well as coping with high rents and employee costs, shops need to create a memorable and unique customer experience. Big brands are changing their selling concepts. They are trying to combine the advantages of a tangible offline experience and consultation with smart online solutions that build on customer experiences. We see the emergence of three streams of selling concepts:
- The customer should have a unique and rare experience that makes them feel special.
- The customer should be able to test virtually and buy only afterwards.
- Shopping needs to be accessible and fast, especially where the products require little intervention, such as milk, orange juice, tissues, washing powder and bread.
In this case study we will concentrate on Stream 3: shopping needs to be accessible and fast, especially where the products require little intervention, such as milk, orange juice, tissues, washing powder and bread.
Potential customers have many periods of downtime, for example when they are waiting for trains or travelling on public transport. These are opportunities for shopping. A bus stop can function as an online supermarket, with wallpaper acting as a virtual shelf. The bus stop can have illustrations of product packs with their QR code or bar code, and these can be scanned by the customer while they are waiting or travelling. A schematic example is shown in Figure 10.39.

Figure 10.39 Virtual supermarket at bus stop.
The goods can then be shipped and delivered to the customer at a convenient time. The bus stop becomes a virtual supermarket. This method of shopping is especially useful for basic products such as milk, orange juice, tissues, washing powder and bread that are so familiar and frequently bought that it is not necessary to test them before purchasing. The virtual supermarket speeds up the grocery shopping. It is easy: with the help of an app and a suitable device you can just scan the image or code of the chosen product and add it to your virtual shopping trolley. After paying as an online transfer the product will be delivered to the next branch, your home address or a pick‐up point that you choose. In contrast to a typical online shop, the wallpaper looks like a real supermarket shelf; the only difference is that you scan the product instead of picking it up. This kind of shopping is becoming increasingly common in cities all over Europe, after early examples were set up in Seoul, South Korea.
The advantage is that the technologies involved serve both customers and retailers. For the customer, it is convenient and timesaving and it has the advantage of being linked to traditional shopping habits and product presentation. For the retailer, it has the big advantage of saving expensive investments in shop space where rents per square meter are particularly high. The range of products offered in the virtual supermarket is usually small to keep it simple and leave the message clear: the customer may only have a short time to spare. The concept of the small range of products is similar to that of a small supermarket outlet in a station where just the most commonly bought commodities are on offer.
10.17.2 Methods
Techniques for ordinary online shops are combined with QR code and bar code technologies and ordering is by app rather than through a browser on the internet. All the data is accessible, as in the usual online environment, so the full range of statistics and data mining methods can be used. Predictive modelling and segmentation can be used to improve the range and placement of products and brands in the bus stop virtual supermarket. If there are no prices given on the wallpaper then individual pricing can be used. The pricing can be based on the customer segment or a personalised process of offers relevant to the individual customer and their behaviour.
Shopping in the virtual supermarket should be linked as far as possible with the customer’s shopping in other outlets. This depends on the customer identifying themselves via a loyalty card or handing in personalised coupons in the normal supermarket situation so that the match can be made. This requires good data quality and connectivity, as is the usual requirement for monetisation in retail, mail order and online shopping. The timing of the purchases will be different to normal shopping, focused on rush‐hour periods. However, it can also happen at any time in the 24 hours.
10.17.3 Monetisation
This shopping method is an ideal opportunity to test new products or product placement ideas, taking advantage of designed experiments for efficient capture of data. Analysing the customer’s shopping habits in the virtual supermarket provides insights that can increase customer sales, loyalty, and cross‐ and up‐selling opportunities. In addition, the shop saves money by not having to have a physical presence or pay shop assistants; the only outlay is in the advertising space and the packaging and delivery. The bus stop virtual supermarket can be placed in the most expensive rental parts of a city for much less cost than investing in retail shop space. The shop also avoids the problem of products going out of date, and saves on staff having to continually check the shelves for old product and the inconvenience of rotating the stock.
10.17.4 Key Learning Points and Caveats
Shops need to keep abreast of new technologies and be aware of innovations happening in other places. Shops need to be open to new ideas; even though the basic shopping process of looking and choosing is just the same, it is the method of transmitting the desire to purchase to the shop which has changed. Shops must be sensitive to the needs of their customers at all stages in their life and daily activities so that they can offer attractive ways for them to shop.
As a downside, the shop loses personal contact with the customer through this method of shopping; different methods need to be used to keep a close watch on how the customer feels about the shopping methods, choice of products and service provision. Surveys and focus groups are needed to give an understanding of whether all customer needs are met and how customers are changing over time.
10.17.5 Skills and Knowledge Needed
As well as the data handling and statistical skills necessary for deciding what data to access and what methods are best for your business, you need to keep up to date to see what new methods are being used. The data visualisation has to be suitable for a wide audience, with clarity and good design. You have to have computer science expertise and skills in these new technologies. You also need to be flexible and able to adapt as newer technologies come on stream.
You need to know about the legal aspects of accessing data and make sure the system is secure, both in terms of retaining data in good form and also in the sense of preventing unauthorised access.
10.17.6 Cascading, Wider Relevance
If you know your customer’s needs and desires then it is possible for all businesses to find the optimal mix of online and offline presentation of your business. Shops need to keep aware of the interplay between on‐ and offline sales so that the shopping experience is seamless. The customer should be seen as a whole, incorporating both their online and offline personae. Considerable resources may be needed to manage the data integration, but the new method of shopping via virtual supermarkets can benefit any type of business dealing with fast moving consumer goods, including healthcare. The main feature is that these goods do not need to be tried and tested in an interactive way before purchase.
10.18 Service Providers, Households and Facility Management
10.18.1 Background and Content
More and more data is arising from sensors and devices embedded in properties and household products. Intelligent buildings may include many different types of sensor, offering comfort and security to users. In the transition towards a so‐called ‘smart home’, electrical appliances like refrigerators, washing machines, the central heating system and TV will have internet access and other features to make life easier or enable them to be controlled by voice, or an app when owners are away (see Figure 10.40). This data can also be used to predict future user desires or detect the need for maintenance services or to provide more security. For example, an elderly person can have the option to be connected directly to caring services.

Figure 10.40 Input from miscellaneous IoT sensors.
The IoT sensors reporting on the technical environment help facility managers to maintain the service quality of systems, such as lifts or central heating, notifying whether they are working or not, or keeping the building secure, for example by notifying which windows and doors are open. The data collected is delivered or transferred via direct internet access to the service provider or the manufacturer or both.
It is also feasible to develop predictive models based on the sensor data, pre‐empting breakdowns or aiding service scheduling, although this is less common at the moment.
10.18.2 Methods
Monetisation requires accessible and easily usable interfaces such as apps, flexibility for updating capabilities of the application, and opportunities for customising the way the data is used. If the purpose of the monetisation is just to save time and money, for example by managing central heating more effectively, then less detail is needed and remote sensors and interfaces provide a satisfactory solution. However, if a more personalised and usage‐dependent analysis is required, more data is needed. Examples might be the identity of the person using the service or benefitting from it, and their historic behaviour. Then predictive modelling methods will be used.
The technological solution behind such integration of data and interfaces is referred to as the IoT platform. The following ten aspects need to be considered when seeking a suitable IoT platform:
- Connectivity is a key feature. Your platform should support all communication standards and protocols and preferably be able to communicate with other platforms relevant for your industry or typical for users or clients.
- The platform has to be able to connect, integrate, update, and manage heterogeneous devices efficiently to enable a wide range of IoT applications.
- Your platform should serve as the basis for application development by providing methods and tools that can handle a wide range of data inputs.
- The platform should be able to manage business processes and rules that control devices or leverage device data.
- The platform should be able to manage the challenge of huge data volumes and increasing velocity to achieve big data and near‐real‐time analysis.
- Your platform should ideally be available both on site and as a hosted service that can adjust to changing future requirements. A platform‐as‐a‐service solution should offer rapid and elastic service provision according to specific demands.
- Your platform needs to be robust. IoT applications require service availability and stable operations. Your platform has to recognise the different potential problems and be able to handle them: slow internet connections, unstable mobile connections, devices that go on‐ and offline, for example.
- Your platform should be scalable. Most IoT projects start with small numbers of connected devices and then more are added. Select a platform that makes economic sense, but scales with you, your customers, and partners.
- Your platform has to have security features based on a reliable, transparent, and fully integrated security concept.
- Your platform should support relevant data protection and privacy laws and ensure data confidentiality.
The IoT platform has data as an input and the data is subject to statistical analysis as appropriate, including all the data analytics methods for monetisation.
10.18.3 Monetisation
Monetising IoT data refers to adding value on top of the operational value provided by generating and analysing such data. Such added value can accrue from new product development, different pricing concepts or tool‐sharing models, such as managing facilities for sharing gardening tools, spare rooms, transport options or spare machinery when not being used by its owner. Added value also comes from up‐ and cross‐selling items such as fitness equipment, providing maintenance advice and predicting downtime, offering medication and optimising personnel for dangerous tasks.
The appeal of IoT in intelligent buildings opens a market for replacement of standard equipment with intelligent equipment before it is strictly necessary. For example, household items such as intelligent switches, lamps, heating systems, refrigerators and other technical devices may be purchased even though the old ones are still functional. In this way, the IoT is creating new markets and makes boring everyday products more desirable.
10.18.4 Key Learning Points and Caveats
For service providers, households and facility managers to benefit from the IoT, it is important to invest in an appropriate IT platform. To exchange the old devices and machines with new intelligent ones might be a big step, with a large financial commitment and/or new communication strategies needed to get these smart products and machines in place. The knowledge out of the new data streams creates additional valuable insights. To adapt new ideas, it is important to rethink existing business rules and processes and to cross‐check and sometimes enlarge them, incorporating the new and constantly generated insights from the accruing data stream.
It is vital to distinguish between the needs and the functions; with new insight it might be likely that need and function are split up and reunited in a different service or product set up. For example, an accommodation service might separate the function of providing somewhere to sleep from the function of providing regulated standards of accommodation such as clean sheets or a safe and secure environment, and whilst satisfying the need to find somewhere to sleep at a good economic price, they substitute part of the regulated standards for the satisfaction of the need to meet local people.
The caveat may be that old business and market knowledge might become less important and that strong computer science and analytical skills are more important than manufacturing and engineering skills to stay in the market. It is also likely that the value of data, especially the behaviour data of the customers, is underestimated or that the data owner loses control of the data and might lose direct access to their customers because the data is shared with service providers under the premise of saving money.
10.18.5 Skills and Knowledge Needed
As in any industry domain, knowledge is the main feature, but to use the power that arises from the IoT, a wide range of computer science and analytical skills are needed. In the case where the optimisation is focused on productivity process‐control techniques, industry statistics and failure prediction are key issues. In the case of adding comfort and pleasure to customers and consumers, deep customer knowledge and ideas about future customer demands are required.
10.18.6 Cascading, Wider Relevance
Collecting information and being able to measure exactly what happens in more‐or‐less real time gives a big advantage, compared with the former situation. Especially in the field of interaction between machine and humans, this information is much more reliable than manual documentation or completed questionnaires. In any circumstances where you need to improve processes or where new behaviour‐based services are required, the new technologies might help.
10.19 Insurance, Healthcare and Risk Management
10.19.1 Background and Content
More and more data is arising from sensors embedded in people and objects. The data is used in diverse ways: wearables (such as ‘fitbits’) monitoring performance; engine sensors monitoring fuel consumption (see Section 10.2); body movement sensors detecting wellbeing of people in healthcare environments; location sensors tracking crew in dangerous activities such as ocean racing.
A major change is also happening in the automotive market, with connected cars, vehicle management systems, security features, road condition sensors and recommendation features for popular restaurants, shops and garages, all delivering data to the automotive manufacturer for further improvements in the product itself and in the services it provides. This data is of great value for insurers because it gives personalised, detailed information about the particular individual and their peer group.
The data collected with these devices is delivered or transferred via the internet to the service provider. It can be used to predict future user activities and assess personal risk taking and provide the insurer with an indication of the risk of having to pay out.
10.19.2 Methods
Monetisation requires data sensors that are appealing and comfortable so that people want to wear them and use them. The attraction may be that they are fashionable and seem to be helpful even though they often provide more data than people can cope with.
For a car, the sensors need to appear as a helpful tool for improving your driving, avoiding traffic speeding penalties, finding the best route, saving fuel and recording your travel.
The sensor data must be accessible, with easily usable interfaces to export the data so that the user can compute basic summary statistics and generate graphical displays customised to their personal requirements (see Figure 10.41).

Figure 10.41 Appealing sleep sensor display.
The company needs to offer enough benefits that the user is willing to exchange their personal data for these services. The user needs to be willing to be identified, which is feasible with personal sensors but more difficult with cars, where different drivers need to be identified. One possibility is to connect the sensors via a mobile phone, which is more likely to be used by just one person (see Figure 10.42). Different drivers could also be recognised by their seating position. If identification of the driver is not possible then an alternative is to accept that the sensor data applies to the car as a whole and any predictions must be given at the level of the car rather than the individual.

Figure 10.42 Sensors connected by mobile phone.
The IoT data arising from these sensors is subjected to statistical analysis as appropriate, including all the data analytics methods for monetisation discussed earlier.
10.19.3 Monetisation
Monetising IoT data refers to adding value on top of the operational value provided by generating and analysing such data. Added value can accrue from new product development, different pricing concepts, up‐ and cross‐selling items such as fitness equipment, and offering treatments, medication and advice such as to go to a doctor, a garage or to seek expert opinion or specific training.
The data is used to tailor‐make products and offer new services based on data‐driven prediction. This covers benefits surrounding the use of products and services. The appeal of IoT for insurers is that it offers the opportunity for minimising their risks because they know more about their customers. They can consider asking higher premiums for higher‐risk customers or even to reject them at the next opportunity.
Monetisation can adversely affect the user who does not wish to share their data. After a while, using the sensor data may become the norm for the insurance company and those customers who refuse may be automatically labelled as high risk and have to pay more.
10.19.4 Key Learning Points and Caveats
To benefit from the advantages of the IoT it is important for the insurance company to invest in an IT platform that enables them to collect, integrate and use the data coming out of the devices. It is vital to distinguish between the needs and the functions; with new insights it is likely that need and function are split up and reunited in a different service or product set up. For example, specific medical services, such as checking blood pressure, may be carried out in a new, cheaper business unit rather than a healthcare setting and the results transmitted as sensor data; this could be advantageous for the user if the time and location are more flexible but on the other hand it could be annoying if a separate visit has to be made instead of doing everything in one place. Certain jobs that were previously carried out by highly paid and highly qualified personnel are now done by less qualified staff who are only trained in that particular task, or by the user themselves; having to do these tasks can steal the user’s personal time.
The caveat may be that old business and market knowledge might become less important and that strong computer science and analytical skills might become more important than risk assessment skills to stay in the market. It is also likely that the value of the data, especially the behavioural data of the customers, is underestimated. Alternatively, data may be shared with service providers in order to save money, but the data owner loses control and might lose the direct access to their customers.
10.19.5 Skills and Knowledge Needed
As in any industry domain, knowledge is the main requirement, but to use the power that arises from the IoT, a wide range of computer science and analytical skills are needed. In this case study, where the aim is to use the data to make better assessment of risk, deep customer knowledge is needed to customise the service provided. There also needs to be creative business thinking to know what will appeal to the customer so that they give their data for free.
10.19.6 Cascading, Wider Relevance
Collecting information and being able to measure exactly what happens in more or less real time gives a big advantage of knowing personalised data about how a particular person acts. Previously, companies would only know about events after they happened and even then have little or no knowledge of the details. These IoT ways of doing things are important wherever costs and risks are involved.
10.20 Mobility and Connected Cars
10.20.1 Background and Content
Cars have evolved from being a mechanical device controlled by the driver that skilled amateurs could understand and repair, to a complex technological machine that is likely to be able to drive itself in the future. The management system is difficult to understand and repairs can now only be done by experts. In addition, the vehicle is now acting as an information collector, recording the driver’s activities, behaviour and style as well as car usage, loading and the conversations within (see Figure 10.43). This information can be used by companies for various business advantages.

Figure 10.43 The connected car.
Often the user will connect their smartphone and the knowledge is shared between the car, the user and other interested parties. This is the first time that the manufacturer and the garage are in the position to know how the car is driven, who is driving the car and how it is used. Even if you detach your smartphone, the car’s sensors can identify different users from their seat adjustment, weight, mirror position, and so on.
A major change is also happening in the automotive market, with connected cars, vehicle management systems, security features, road condition sensors and recommendation features for popular restaurants, shops and garages, all delivering data to the automotive manufacturer for further improvements in the product itself and in the services it provides.
The data collected with these devices can include geographical position, weather conditions, information about speed limits, traffic signals and, if a route planner is activated, what the route is and whether it is followed. In addition, there are sensors recording how the brakes are used, the speed travelled and the engine condition, and the car’s internal and external temperatures. This information can be stored, and/or delivered or transferred via direct internet access or by smartphone to the service provider or the manufacturer or both.
Major car manufacturers are working on enlarging their services to rental services, bicycles and travel arrangements. In other words, they are presiding over the whole concept of mobility and are offering advice.
10.20.2 Methods
Monetisation requires integration of different types of data from different sources. The data needs to be filtered to extract the essential messages; these signals then need to be analysed to aggregate them in a suitable grouping (say, at the level of a particular person using a particular car). It requires a combination of business and technology to integrate the users, the things, and the companies or partners. The technological solution behind such integration is referred to as the IoT platform and must have the necessary range of functionality. This kind of data enables the creation of clear profiles of everyone using the car (or other mobility offer).
Currently, much of the analysis is descriptive, for example probabilities are calculated on the basis of behaviour: how often something is done. These descriptive statistics are combined with domain knowledge and business rules, for example that breaks should be taken every four hours. Together, this provides opportunities for recommendations, risk avoidance and new business.
Further analysis is mainly done with predictive modelling techniques. Information that is not recorded can be imputed from the patterns already detected or by the fact that most of the sensor data follows a specific statistical distribution that can be used to estimate information that is missing due to poor connections or temporary failures. Note that this missing data is different to data that is not present because nothing happened, perhaps when the car was just left unused.
Predictive modelling enables forecasts of car rides that are yet to happen or future driving behaviours and driver patterns. The most crucial issue, however, is to decide on the range of target behaviours of interest because each target may require a different predictive model. For example, predicting if a repair service is needed may be based on different habits and measurements than predicting the likelihood of the driver needing a break. Each target leads to a different business model. For example, a garage might be alerted to the need for a repair, whereas the car would be notified of the location of suitable restaurants and facilities when the driver is expected to want a break.
10.20.3 Monetisation
There are different stakeholders who might benefit from this mobility and connected car data; these include the manufacturer, the garage, associated services such as insurance and B2C operations who can use the data to advertise their own services, for example the welcome break for food and rest.
Each stakeholder has a different kind of benefit. Manufacturers gain valuable insight into the way the car is used and they can use this information to stabilise the brand relationship, to be in constant, positive contact with the driver, knowing whom to address and how. This is important because addressing the owner is different to addressing the actual driver. The way the car is driven gives valuable insight, enabling predictions of when a new or replacement car might be required and what model or type of car and with which features. Manufacturers already use static factual information to predict which car is likely to be the next one the customer will buy. When this static information is combined with further detailed information about actual usage then these predictions can be even more accurate. The manufacturer can also use the models to think about potential product combinations, for example car plus insurance or car plus two years’ service included.
For the garage, the information helps them to optimise their workload, and to get an even work flow. They can pre‐order parts and make timely contact with the customer. This helps to attract the customer to the garage rather than having them go to the cheapest.
For insurance companies, this kind of data is clearly very important; they can recalibrate their products and fees and thereby minimise their risk exposure. It also helps to close the deal as they can add attractive perks in conjunction with the manufacturer.
For B2C operations, the connected car and its data can be used for promoting services and the customer profile helps them know whom to address and what to offer them (see Figure 10.44).
Figure 10.44 The new connected eco‐system.
10.20.4 Key Learning Points and Caveats
Integration of all the different sources of data is a vital component of such a system. However, the mass of incoming data, especially that from sensors, needs time and careful thought to manage and to find the appropriate level of storage. The data varies as regards its archiving needs. Some data, such as contracts information, needs only to be updated occasionally; other data, such as garaging and repairs, is required more frequently; other data again, such as engine temperature measurements, arises in a constant stream. Some data retains its importance with time whereas other data is more important when recent than when older.
The knowledge produced out of the new data streams creates valuable insights. To adapt new ideas, it is important to rethink existing business rules and processes and to cross‐check and sometimes enlarge them, incorporating the new, and constantly generated insight from the accruing data stream.
It may be that the value of the data is not fully appreciated and the business advantages may not be fully exploited. Car manufacturers are generally large and care has to be taken that the power of the data is not lost between departments. Departments have differential access and lose the opportunity to optimise their part of the business.
10.20.5 Skills and Knowledge Needed
Data integration is key and requires profound computer science knowledge, especially in the area of big data. Business domain knowledge is also extremely important and because of the pervasive nature of cars in everyday life, creativity and new thinking will pay dividends. Interdisciplinary teams are particularly important and should include big data experts, data scientists/statisticians, engineers, marketing people and customer relations specialists
10.20.6 Cascading, Wider Relevance
Collecting information and being able to measure exactly what happens gives businesses a big advantage, compared with the former situation of having only static data available, such as contract information and invoices from garage services. The new data is more detailed. The concept can be used in any field where there is scope to track consistent behaviour.
10.21 Production and Automation in Industry 4.0
10.21.1 Background and Content
The first big revolution in mechanisation was with water and steam power, which transformed not only the way products were made but also the nature of society in manufacturing countries. This irreversible change was followed nearly a century later by mass production, with the advent of assembly lines and electricity. Computers and automation revolutionised manufacturing again in a third big step, and now we have Industry 4.0, with intelligent systems wherein machines and control are connected by data flows independently interacting with each other. Figure 10.45 shows these major steps in development. This interconnectivity is summarised in the term ‘Smart factory’.
Figure 10.45 Industry 4.0.
This connected automation leads to faster and more flexible production processes, with greater efficiency of material supply and usage and reduction of complexity and downtime. The smart factory in this Industry 4.0 development phase is highly dependent on connectivity, both technically and in terms of organisation between suppliers and manufacturers. The connectivity results in abundant data collected by sensors embedded in the manufacturing systems. The data is used in diverse ways, including monitoring quality, performance and the interactions between processes. The machines communicate directly. Data is also transferred to a central hub for operational and strategic purposes, including predictive modelling, failure detection and viewing in reports and dashboards.
10.21.2 Methods
In our experience, there are eight important features for running the smart factory effectively. These constitute the methods needed for effective monetisation of Industry 4.0.
- people
- intelligent automated components
- integration and configuration
- standards
- virtual real time representation
- security
- analytics
- IoT platforms.
These features are now briefly described:
- People Data can facilitate customisation of work environment tailored to individual needs and preferences. For example, the smart factory can provide workstations that are adapted to individuals, and give instructions in suitable detail depending on operator knowledge and experience.
- Intelligent automated components Interconnected components in the smart factory can make autonomous decisions based on business rules or predictive models. Intelligent automation can be steered from a central computer or can be decentralised between two or more machines. This distributed intelligence is a fundamental requirement for modular machines and flexible facilities that adjust themselves to changing market and manufacturing conditions.
- Integration and configuration There must be effective and well thought out integration of data from all aspects of the manufacturing process, including commissioning, integration and reconfiguration and preventive maintenance. This serves to reduce complexity and IT software costs.
- Standards Standards that extend across manufacturers and are independent of software systems form the basis for horizontal and vertical integration. Choosing the appropriate standards is important and should be carried out with a long‐term view and learning from other industries. Common standards need to be agreed across industries in value‐creation networks like supply chains. This ensures the seamless exchange of information.
- Virtual real time representation It is important to record and evaluate relevant data, calculate forecasts in real or nearly real time and display them. This information provides operators and managers with a solid base of information for rapid process improvements as production proceeds. All components and objects in the value creation process should be available in virtual real‐time representations. These virtual elements are closely linked to their physical counterparts and provide in‐context information for continuous process improvement in real or nearly real time.
- Security The full system has to have security features based on a reliable, transparent, and fully integrated security concept. Security and safety for Industry 4.0 includes protecting people from machinery‐related hazards as well as the protection of production facilities and corporate IT from attacks and faults from the surrounding environment and from within the company. This involves securing sensitive data as well as the prevention of intentional and unintentional malfunctions. It should support the relevant data protection and privacy laws and ensure data confidentiality. Note that intentional invasion is different from accidental breach of security, but both have to be taken into consideration. People are the important part of Industry 4.0, but they are also the most risky from the point of view of security and may be the target of attacks by powers wishing to manipulate them and by rogue operators wishing to access their personal information.
- Analytics With all this data around, it is important to remember that analytics is the key science for adding value. Analytics means more than the classical statistics around total quality management and in Six Sigma such as statistical process control and designed experiments. For Industry 4.0, we include all the advanced predictive modelling and meta‐modelling techniques.
- IoT platforms The IoT platform has data as an input and acts as a major data hub, facilitating the data analytics.
10.21.3 Monetisation
In the global world, new products must be brought to market in ever‐shorter timeframes, and customers demand mass customisation: products that are much more personalised. Digitisation of manufacturing is becoming a vital technology to address these highly competitive issues. Rapidly changing markets require increased flexibility and an efficient use of resources and energy whilst maintaining or improving quality.
Gathering and evaluating data makes it possible to constantly monitor and refine processes (see Figure 10.46). Feedback from the production process and customers can be incorporated for further improvement.

Figure 10.46 Industry 4.0 in action.
Data analytics leading to predictive maintenance reduces unnecessary maintenance work and the occurrence of expensive sudden or unexpected plant downtime. Digital enterprise can have a shorter response time to customer requests and market demands, which opens up new and innovative business areas. This gives a competitive edge.
10.21.4 Key Learning Points and Caveats
To benefit from Industry 4.0, production lines and processes have to be rethought. They must be broken down into modules that can be automated and enabled to communicate with each other without human intervention. With this change, good IT security becomes as crucial, as are a stable electricity supply and consistent flow of materials.
The whole approach of Industry 4.0 relies upon digital exchange and statistical expertise; statistical thinking needs to play a much greater role than is currently the case. Without it, it is unlikely that the full benefit of all the connectivity and analytics will be realised.
10.21.5 Skills and Knowledge Needed
Engineering skills, although important, are not enough to address the needs of Industry 4.0. Statistical thinking and awareness of variation, probability and uncertainty are vital to make sense of all the data and to realise its full benefit. Knowledge of IT security and data protection has to be kept up to date.
10.21.6 Cascading, Wider Relevance
Industry 4.0 is around to stay and is likely to become more widespread and all embracing. Therefore familiarity with the requirements and the necessary skills and techniques can be useful in many different applications.