APPENDIX 1
Mark’s Plan
You read about Mark’s 3Sig journey in Chapter 7. His plan’s complete worksheet appears over the next four pages in this appendix. It uses unadjusted prices from December 2000 to June 2013. In some places, the plan’s balances differ by a dollar from the ones you saw in Chapter 7 due to my rounding them in various examples and then making sure they added up correctly in the narrative.
Areas of particular importance are shaded in the table and summarized in the key at the bottom. Mark’s quarterly cash contributions changed over time. Each time they did, the new amount was manually entered the first time it happened and then automatically pulled forward by the spreadsheet. The manual entries are shaded. In the “Order Adjust” column, notice when Mark needed to move his excess VFIIX balance into IJR in Q202, and when he did not fund his entire buy signal in Q109 but instead used only his VFIIX balance.
You can see the price history of SPY in the second column, and the two times it triggered the “30 down, stick around” rule, prompting Mark to skip four sell signals each time: the ones from Q203 to Q104, and the ones from Q209 to Q110. Finally, IJR split 3-for-1 in Q205, which is indicated in that row with an underline.
To get a single-page printable version of the table for reference as you reread Chapter 7, and a working copy of a similar spreadsheet, please visit jasonkelly.com/3sig.
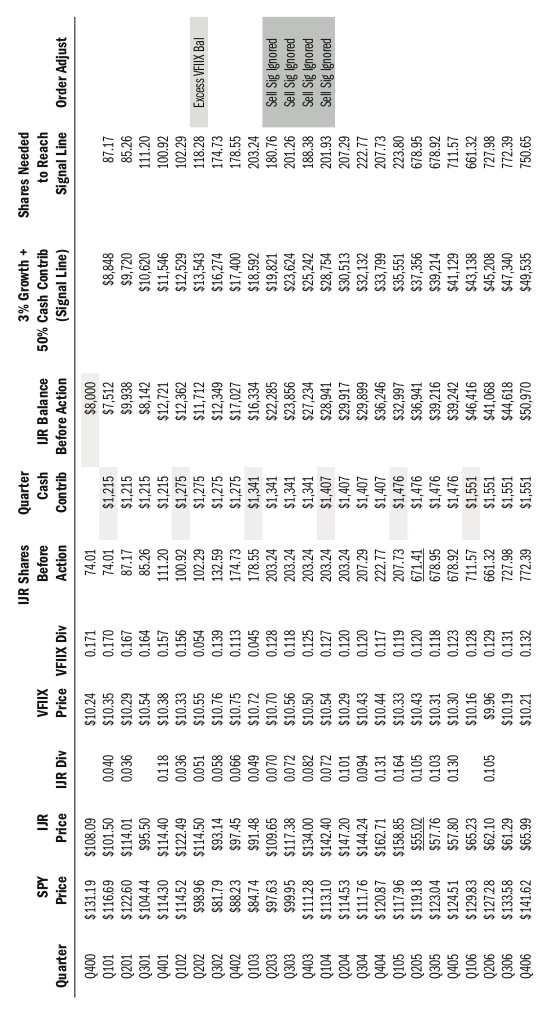
Visit (http://bit.ly/1L53oRI) for a larger version of this table.
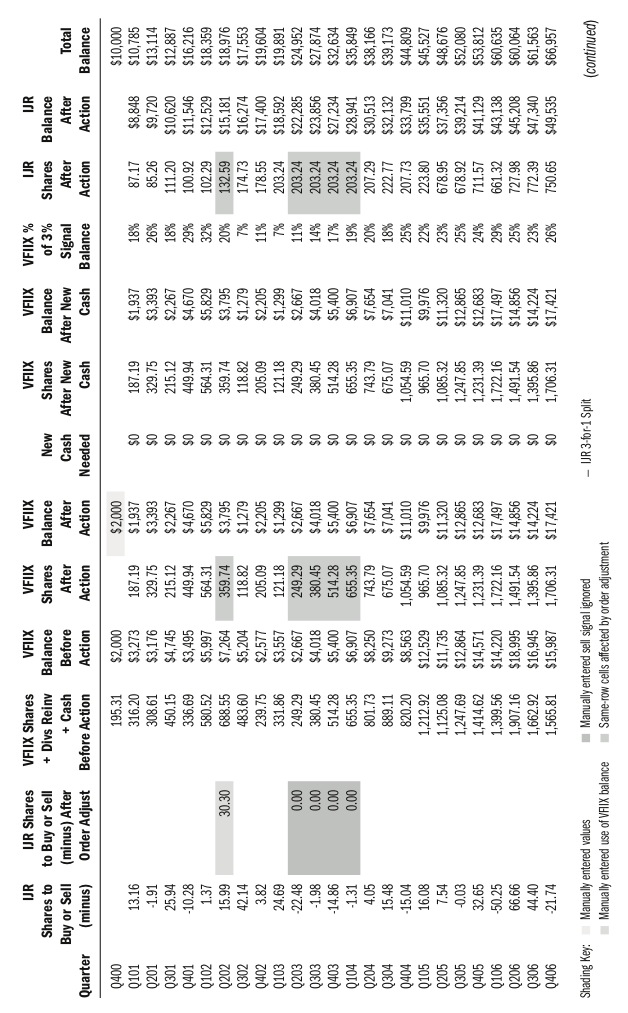
Visit (http://bit.ly/15mxoqZ) for a larger version of this table.
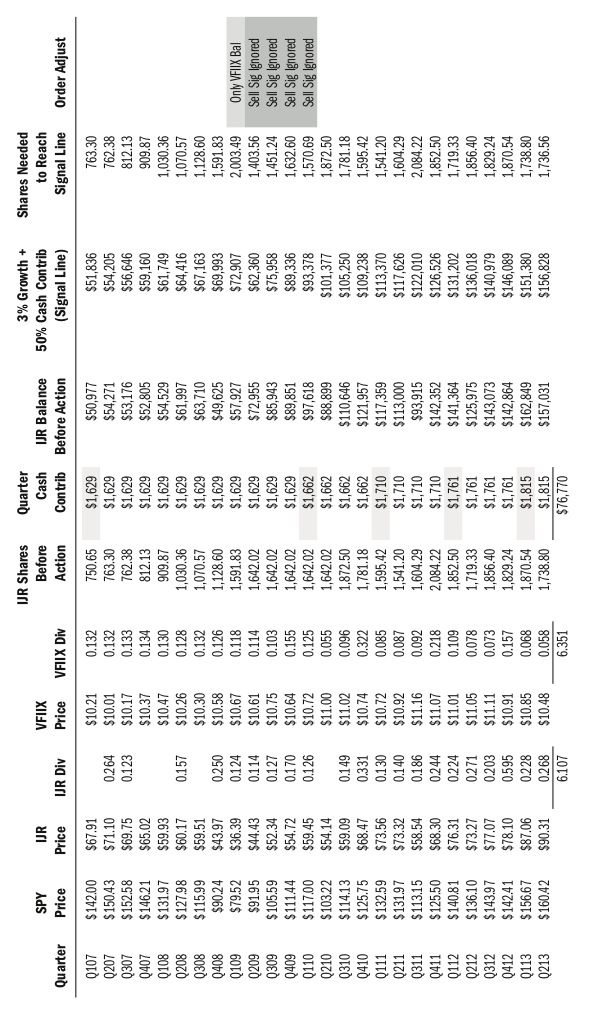
Visit (http://bit.ly/1AZSGE1) for a larger version of this table.
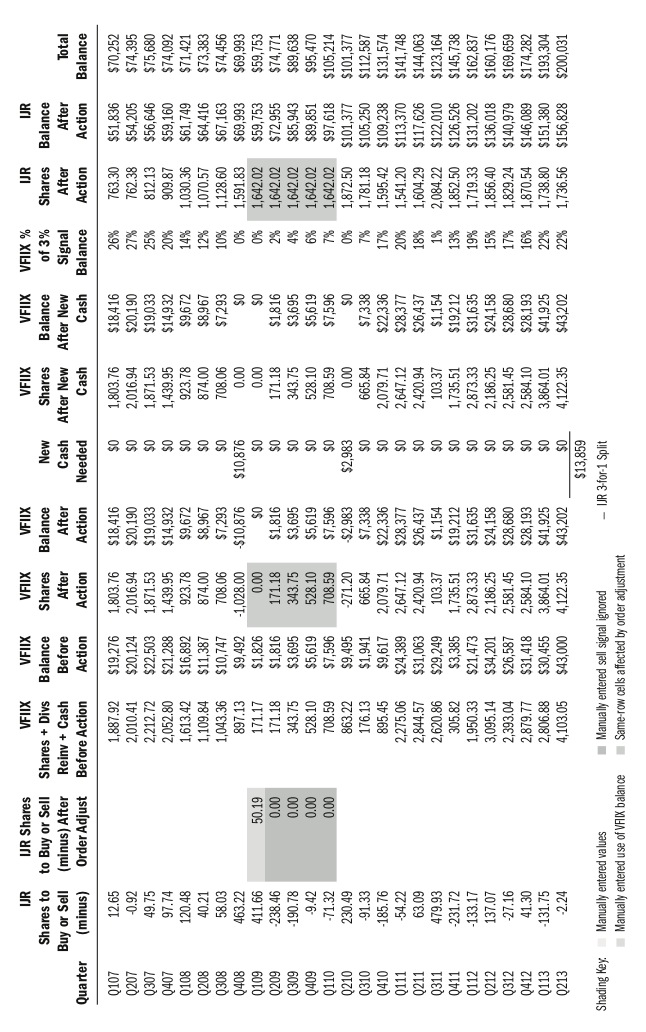
Visit (http://bit.ly/1t7NqQP) for a larger version of this table.