
ON APRIL FOOLS’ DAY 1980, THIRTY-FOUR THOUSAND OF NEW YORK City’s bus drivers, subway operators, dispatchers, token clerks, and mechanics walked off their jobs.a Despite laws that made strikes by any public union illegal—they’d been on the books since 1966, the year of the last transit strike—Local 100 of the Transit Workers Union had hit the picket lines.
The reasons were straightforward enough. At a time when the US economy was going more than a little crazy—I know younger readers will think this is a typo, but the inflation rate in 1980 was nearly 14 percent, and banks were paying more than 12 percent interest on money market accounts—the transit workers had demanded a raise of 30 percent (this isn’t a typo, either). The Metropolitan Transportation Authority offered 3 percent. This caused some hard feelings and, soon enough, a strike. Over the course of the next eleven days, between overtime expenses incurred by the city’s government and job absenteeism everywhere, New York’s economy lost an estimated $1 billion.
I had been working on the city’s response to a potential transit strike for months. Sure, there was lots of talk about it and the smart money had been betting on a strike, but I still didn’t believe it when, at about 3 a.m. on April 1, my phone rang and Spiros Lambros, a department liaison with the other city agencies, said, “It started.” The strike had been officially called at 2:05 a.m.
A waiting police car drove me from my Flatbush home to the Parade Grounds, a flat area of ball fields, just three blocks away—five minutes on foot, but less than a minute by car, and this was one time minutes mattered. There, I hopped on an NYPD helicopter and by 3:30 a.m. was flying over the Gowanus Expressway. I looked at the dark homes below, thinking, “They have no idea what’s going to hit them when they wake up.” In the distance I could see the headlights of drivers about to face the gargantuan task of getting in to work. I remember shuddering and thinking, “They are all counting on me.”
Within minutes the chopper landed at One Police Plaza. I walked down one staircase into my new temporary office, the conference room of the police commissioner. One door led to the commissioner’s office. The other to a wide expanse of desks, each with the nameplate of the agency represented: Fire, Education, Con Edison, Environmental Protection. By 5 a.m., every desk was staffed.
The mayor and the police commissioner made it clear to me: I had ten thousand cops, every city worker, every resource at my disposal, all of them looking to me for direction. After getting over the initial butterflies of opening night (actually dawn), I began barking orders.
I was well prepared. I had read everything I could on the strike fourteen years earlier, talked to cops and traffic engineers. I had concluded that it had been—mistakenly—treated as a police event when what it had really been was a scientific challenge: how to suddenly transport people away from their pods of subway trains and buses. My team did capacity assessments and sensitivity analyses, and used traffic engineering principles to move automobiles more efficiently. Our traffic signals had been prepped to take traffic primarily in one direction: inbound in the morning and outbound in the evening. If you were going against the flow, tough luck! Weeks before, we had manufactured hundreds of signs warning everyone that each car entering New York must have three or more occupants, and we had installed them at every major entrance to the city—and then covered them up. At 4:00 a.m. April 1, the covers were removed, the signals were activated, and the cops were posted. And Mayor Koch, along with several hundred thousand of his nearest and dearest friends, walked across the Brooklyn Bridge to work at City Hall.
As bad as the strike was, it had some good sides. Hotels never did better, as the employers of an estimated half a million commuters decided to keep them within walking distance of their offices. More than a hundred thousand people got out their bicycles and pedaled to work. And I added a word to the Oxford English Dictionary.
Though you’ll find a slew of articles that say that the word gridlock was invented during the strike, this isn’t really the case. Roy Cottam (the engineer in the Transportation Department who had reminded everyone about my strange habit of taking the subway) and I used it as shorthand to describe what the OED calls “continuous queues of vehicles block[ing] an entire network of intersecting streets, bringing traffic in all directions to a complete standstill.” I used it in print for the first time in a 1980 memo titled “Grid-lock [I originally hyphenated the word] Prevention Plan” and Roy, who was paranoid about his name being associated with the term, gave me all the credit for originating it.
He was on to something. I’m pretty sure that the first line in my obituary is going to mention it, and way more people know me as “Gridlock Sam” than as Samuel I. Schwartz, P.E. It’s not quite “Typhoid Mary” but it does evoke some not-so-good emotions. Gridlock is both common and very frustrating, which is why drivers who “block the box”—who enter an intersection but can’t exit it before the signal changes—are supposed to be cited and given a very expensive ticket. On the other hand, the reason that New York, and cities like it, are particularly vulnerable to gridlock isn’t an entirely bad thing. To have gridlock, you first need to have a grid.
And grids aren’t just good for transportation. They’re great.
Even though, as we saw in the last chapter, active transportation has a huge number of attractive qualities, those qualities disappear for routes that aren’t extremely short. Typically, transportation engineers assume that, for most trips, people will forgo traveling on foot for distances that are longer than a quarter- to a half-mile, or by bicycle when they have to travel more than two miles. This is a powerful argument for as much density as possible, in order to maximize the potential number of such trips, but it’s impossible to imagine a transportation future in which every trip (or even most of them) will be short enough to be completed on foot or bike. Whether it’s just for a weekly trip to a supermarket or a daily commute to work, for the foreseeable future, most people will need access to modes of transportation that are powered by something other than muscle.
But which modes? How many? And how organized? One way of answering these questions is to begin with the idea that all transportation systems have to maintain a balance between efficiency and flexibility. All other things being equal, by far the most efficient way to transport a lot of people is by collecting them in large vehicles that run on fixed routes at regular intervals. Bigger vehicles are more efficient than small ones, at least when they’re full. Fixed routes are more efficient than those variable ones. The more predictable the times for departure and arrival, the more efficient it gets. This is why, as routes get longer, heavy rail is more efficient than light rail; light rail and streetcars are more efficient than Bus Rapid Transit; and all of them are more efficient—passenger mile efficient, that is, in terms of cost, energy, and any other way you can measure efficiency—than automobiles.
On the other hand, the private automobile, whether owner-driven or in the form of a taxicab, is the most flexible mode of non-muscle-powered transportation. Cars go anywhere streets are paved; with the right tires and transmission, they can even go lots of places where they’re unpaved. They depart when travelers are ready, rather than when vehicles are. They’re just hugely inefficient. A properly designed system needs the benefits of efficiency and flexibility, which means it needs to be, as we noted in the Prologue, what engineers call multimodal, offering many different ways of getting from place to place, and multinodal, with routes that incorporate the maximum number of connection points.
Whether small towns or megacities, the first key to multimodal/multinodal transportation is space: the two- and three-dimensional map of the transportation system—not just the roads and tracks, but the surrounding buildings and other structures and how they relate to one another. When the activities where people interact with one another—working, buying, selling, and so on—are largely in one place, the places where they live surround that one place, the center. When there are lots of places for interaction, when people work and shop in a variety of neighborhoods, clusters appear, scattered by history and circumstance to different areas. In a centralized system, the transportation nodes tend to concentrate in—no surprise—the center, and are linked in the same way that the outer edge of a wheel connects to the hub, by transport “spokes.” In a city or town with a single downtown, a map of the highest-capacity linkages—streets and roads, for example—would look like a hub-and-spoke, since most trips are from the periphery to the center.
Many cities built before the late nineteenth century look a lot like this. But beginning with the growth of mechanized transportation, especially the first streetcars, cities started to adopt a grid pattern, in which streets meet at right angles. The reason is simple geometry: grids maximize accessibility and available space. In a grid, every part of the town or city is connected via a series of straight lines, which improves not just mobility but real-estate values. An urban environment with lots that are irregularly shaped is one in which the real estate market is relatively inefficient, like a supermarket in which the canned goods come in dozens of different sizes. One of the objectives (and criticisms) of the 1811 plan that transformed Manhattan’s streets into the world’s most famous orthogonal grid was to make large estates easier to subdivide into standardized lots. The plan’s surveyor, John Randel, even defended his plan precisely because it facilitated “buying, selling and improving real estate on streets, avenues, and public squares.”
But after the post–Model T battle for the streets (a battle the automobile won decisively) the streets themselves changed. The process really began in the late 1920s, when two English architects—Charles Stein and Henry Wright—transplanted their version of an English garden city to a town in Bergen County, New Jersey: Radburn, “a town for the motor age.” There were some attractive things about the Radburn model: sidewalks were very safe, and none of them crossed scary arterial roads. Some were less so: residential “superblocks” of thirty or more acres where nothing but houses could be built, surrounded by wide and forbidding arterial roads that made leaving residential neighborhoods impossible except by car. Within the superblocks, connectivity—if you can call it that—was sabotaged by a curvilinear pattern of looping streets and, even worse, cul-de-sacs, which by definition are connected to nothing, with a single way in and the same way out.
The pattern was given the seal of approval in 1934, when the Federal Housing Authority published a series of technical bulletins that endorsed both superblocks and cul-de-sacs. The FHA’s position thus established the model for suburbanization, mostly in America, but anywhere residential developments were built from the 1950s forward, and was one of the enablers of America’s fifty-year-long mistaken enthusiasm for sprawl. Around the same time, the Institute of Traffic Engineers even published a standard entitled “Recommended Practice for Subdivision Streets” that discouraged grids, encouraged curvilinear streets, and even opposed building four-way intersections where T-intersections could replace them.
The Radburn plan, in all its incarnations, was well intentioned: an attempt to protect pedestrians from automobile traffic in the places where they lived. Its results, however, were the opposite of multimodal. In the Radburn version of the English garden city, the only way to get from your house to anywhere that wasn’t your neighbor’s house was by car. Access to any other form of mechanized transport, whether trains, trolleys, or buses, was severely compromised. Since straight lines are the shortest distance between any two points, all other lines are longer, which means that travel is considerably less efficient on curvilinear streets than on gridded ones. After more than half a century of forgetting the geometric advantages of right angles, America now has tens of thousands of miles of highly inefficient roads. Even the most successful suburbs organized around curvilinear streets can be transportation deficient. The planned community of Columbia, Maryland, built by the Rouse organization in the 1960s, which is consistently ranked as one of the most livable communities in America, has never been able to support a decent public transportation system. Moreover, none of its ten bucolic villages has a Walk Score that exceeds 36.
Connectivity has become an even more acute problem in the twenty-first century than in the twentieth, since fewer and fewer urban areas are truly concentrated enough to take advantage of the transportation efficiencies of a hub-and-spoke system. Though millions of commuters will continue to commute from outlying suburbs to Manhattan for a very long time, clustering is far more prevalent than centralizing. Whether within a medium-sized city like Columbus, or a megalopolis like Los Angeles, travel is just as likely to occur between the northwest quadrant and the southwest, as it is from either to the center. More walkability can’t make that kind of connection work. Many if not most routes will remain too long for foot or bike, no matter how much we improve walking and biking access to employment, shopping, and entertainment. Given the increasing inefficiencies and costs of automobile dependence, those routes need to be accessible by public transportation.
Which brings us back to grids, which are the (relatively) simple solution to the classic transportation problem: how to minimize route distances at the lowest possible cost. In a grid, every intersection of perpendicular lines is reachable by a short walk from another intersection. What makes it work for routes too long for foot or bike is that every one of those intersections is a potential transit node: a place where a bus or streetcar can collect and discharge passengers. In practical terms, every intersection doesn’t have to have a bus stop or transit station. Generally, it works perfectly fine to have transit arteries laid out on parallel lines separated by a half-mile, or even three-quarters of a mile, which puts transit nodes within walking distance of one another. Even cities that were laid out in eras before the street-based grid of the streetcar era have created their own rail-based grids that run underground. This is why maps of the Paris Métro and the London Tube are far more gridlike than the respective city’s street maps.
And then there’s Vancouver, the seaport city that is at the center of Canada’s third most populous metropolitan area.
No one writes more eloquently about the geometric advantage of grid-based transit than planning consultant Jarrett Walker, who calls Vancouver’s system the “almost perfect grid.” As he points out, not only are the parallel arteries used by the city’s bus and rail system spaced between a half-mile and six-tenths of a mile apart, but they were explicitly designed to solve another problem of efficient transit design, the seemingly unavoidable fact that a bus or streetcar traveling through a zone with the same population density throughout is only using half its available capacity. A trolley that starts at the north end of Main Street and runs all the way through town to the southern end is going to be empty at the origin and empty again at the terminus, with maximum use right in the middle of the line. Fifty percent of the train or bus goes to waste.
The way to solve this is by anchoring the ends of a transit route at really popular destinations, so streetcars and buses will be just as full at the beginning and the terminus as they are in the middle, thus reducing all that waste. Which is exactly what TransLink, metropolitan Vancouver’s transportation network, does. It’s not that the planners of TransLink were more skilled than their colleagues in other cities, but rather that they had history and geography on their side—both human geography and the natural kind.
Vancouver was established in the middle of the nineteenth century, first as a seaport, then as a logging center, and finally as the western terminus of the Canadian Pacific Railway. Apparently because of nothing more than great luck, it is the only major city in North America without a single limited-access freeway entering it. This means that when, in the 1970s, the city’s planners started pushing back against automobile-first policies, they weren’t obliged, like San Francisco, to stop existing freeways from being completed, or to tear down those that were. The original street map, laid out for streetcars, was the only template they needed to concern themselves with.
That, and the city’s natural outlines. On a map, Vancouver resembles a hitchhiker’s hand. At the base of the thumb that sticks out into Vancouver Harbour is the city’s downtown, occupying the northernmost part of the Burrard Peninsula. That’s where the original 1870 settlement, Gastown, was built. Rebuilt after the Great Vancouver Fire of 1886 (but with the original cobblestones in place), it’s now the center of a complex of upscale and funky stores, nightclubs, traditional office space, and high-tech startups. And every one of Vancouver’s north-south transit lines converges on it, full of tourists, residents out for dinner, software engineers going to work, and artists to their studios, all the way to the end. In the same way, the city’s western border, the hitchhiker’s middle knuckle, is occupied by the University of British Columbia, which pays TransLink directly so that its forty thousand students and nine thousand faculty and staff ride for free, thus anchoring the west side of all the system’s east-west routes. In the south is Vancouver’s International Airport, and in the east, the gateway to half a dozen suburbs with what are, by North American standards, extremely high population densities. In fact, while the city of Vancouver houses six hundred thousand people in only forty-four square miles—fifty-five thousand people per square mile; by comparison, Manhattan has sixty-seven thousand—metropolitan Vancouver isn’t exactly sprawling. With more than 2.4 million people packed into a square roughly thirteen miles on a side, its density is exceeded in all of North America only by New York and San Francisco, which, not at all coincidentally, likewise grew up on limited land around great deep-water seaports.
If Vancouver’s transportation policymakers were fortunate in having population and employment centers grow up on its periphery, rather than in its center, they were still very smart in how they turned it to their advantage. Servicing multiple clusters efficiently also requires a lot of transportation modes, and Vancouver has ’em all. SeaBus, TransLink’s ferry system, carries four hundred passengers every fifteen minutes (during rush hour, anyway) from terminals at the downtown waterfront to Lonsdale Quay on the other side of Burrard Inlet, connecting the city with dozens of different bus routes servicing North Vancouver. Two different kinds of Bus Rapid Transit technologies are on offer as well: electric trolleybusesb on the north-south arteries, diesel-powered on the east-west lines that terminate at the University of British Columbia. The city’s monorail system, SkyTrain, the world’s largest system of fully automated—that is, driverless—metro trains, is composed of three (soon to be four) different lines running from the base of the hitchhiker’s thumb that is Vancouver’s downtown, one running due south, across the Fraser River on the SkyBridge, the world’s longest cable-supported, transit-only bridge. The other two run south by east, up the hitchhiker’s forearm. But while Vancouver is regularly cited for its highly photogenic and reliable trains (and buses and ferries), the most valuable lesson from the success of TransLink is the importance of its geometry, which may be the most important element in any successful transportation network.
The other lesson is that transportation networks aren’t built from scratch. They accommodate themselves to both geography and history, the choices that put certain neighborhoods, or business districts, or shopping areas, or schools, in particular spots. The folks who planned and built Vancouver’s TransLink had some built-in advantages, but the planners of any transportation network benefit whenever they can incorporate a similar combination of multiple transport modes and nodes.
How do they do it? Once goals are established and problems identified, professional transportation planning is usually a four-step process. First comes an estimate of the number of trips that begin or end in a particular geographic area: what engineers call trip generation. Residential areas are said to “produce” trips, while everything else—stores, businesses, and so on—“attracts” them. Attractors are then subdivided into different buckets: work, school, shopping, and socializing. The equations that appear in models can be extremely complicated but the concepts aren’t. The number of trips at the producer end is a function of the number and type of households—apartments versus single-family homes, for example—and the number, income, and age of the people living in them. On the other hand, the number and type of jobs and retailers (and the competition among them) and their accessibility are among the factors at the attractor end. The model is then compared with observation of a (hopefully) representative sample of people traveling in real life.c
The second step takes the total-demand curves and refines them into destination choices: matching origins and destinations into a table. In yet another example of the physics envy that made me a fairly bright star among my classmates in engineering, traffic planning uses equations from a fundamental piece of classical mechanics—Newton’s Law of Universal Gravitation—and transposes them into the world of transportation. There are even textbooks that describe a simplified “law of retail gravitation,” which calculates a “point of indifference” between two potential destinations: the point at which a potential moviegoer, for example, is equally likely to see the latest blockbuster at one of two different multiplexes. A bigger attractor will (like a bigger planet) have a stronger attraction even at a greater distance.
You probably already saw step number three coming: once planners have a sense of the total number of trips, and have matched origins to destinations, they have to account for the kind of transport modes people will use to get from one to the other. Here, the most popular modeling technique isn’t derived from hard sciences like physics, but behavioral disciplines like economics and psychology. Perversely, this didn’t make the math easier, but harder. The “Logit Model” (which won economist Daniel McFadden a Nobel Prize in Economics) is another statistical tool that estimates the way people value different travel alternatives. In theory, if you knew precisely how travelers—collectively and individually—valued their time, the cost of gas, parking, the enjoyment of driving or of sleeping on a bus or train, and everything else, you’d be able to predict their mode choice: walking versus biking, for example, or taking the car versus taking the train. Unfortunately, though, as all those predictions about increasing VMT from the early 2000s showed, you can use incredibly sophisticated models, with hundreds of precisely calculated variables, to arrive at completely wrong conclusions.
Once you know how many trips will connect origins and destinations, and the modes that will be used for the trips, the final step of the system calculates the routes that will be taken, along with variables that estimate the flow and capacity on any link in a transportation network at any given time. If all the t’s have been crossed and the i’s dotted during the planning process, an optimal network of transportation modes and nodes should emerge. Sometimes it actually does.
This doesn’t mean that a grid like Vancouver’s is always going to be the best solution. Another kind of route map that maximizes modes and nodes isn’t based on perpendicular connections, but radial ones.
Not this:
But this:

David Smucker (Sam Schwartz Engineering).
The second version, which resembles a spiderweb, with radiating spokes, is generally less efficient than the first. Spoke routes have geometry on their side. As the Pythagorean theorem demonstrates, diagonal routes are always shorter than traveling around two legs of a right triangle, which is what grid systems require. However, the cost of creating a system with a sufficient number of uninterrupted spokes is high, which means that, the further travelers are from the center of the web, the more indirect their routes tend to become. Moreover, the trains, buses, and streetcars will inevitably be filled only as they converge on the web’s center, and be empty at the periphery.
There’s another reason traffic engineers don’t like radials. They often create multiple phase intersections when they cross a grid. A typical, two-phase, perpendicular intersection forms an ×, so a simple traffic signal stopping traffic in one direction at a time is all that’s usually needed. But, introduce one of the diagonal streets common to radial systems—something like d—and another signal needs to be introduced to let the traffic on the additional street stop and go. So if the traffic signal repeats on a cycle one hundred seconds long, each movement in an × intersection averages fifty seconds, which is reduced to thirty-three seconds in an e intersection. This is part of the brilliance of Janette Sadik-Khan’s plan that closes a section of Broadway, which runs at an angle through the otherwise perpendicular Manhattan streets, to cars. The vehicular pattern changed three-phased signals into two-phased signals. So closing a street to traffic actually improved traffic!
However, attractors often got concentrated decades or centuries before contemporary planners started work; the planners don’t get to choose where attractors go. Lots of cities still have a traditional, single, prime destination—usually the original central business district, as with Boston, Massachusetts—and can satisfy many transportation needs with a traditional hub-and-spoke system. Paris, whose twenty arrondissements are laid out in a spiral, is a prime example of a radial spiderweb. Within the city’s core, the Metro lines circle the hub, while the city’s eight tram lines orbit the core—the T3 tramway alone carries riders on thirty million trips annually—and intersect inbound transit spokes.
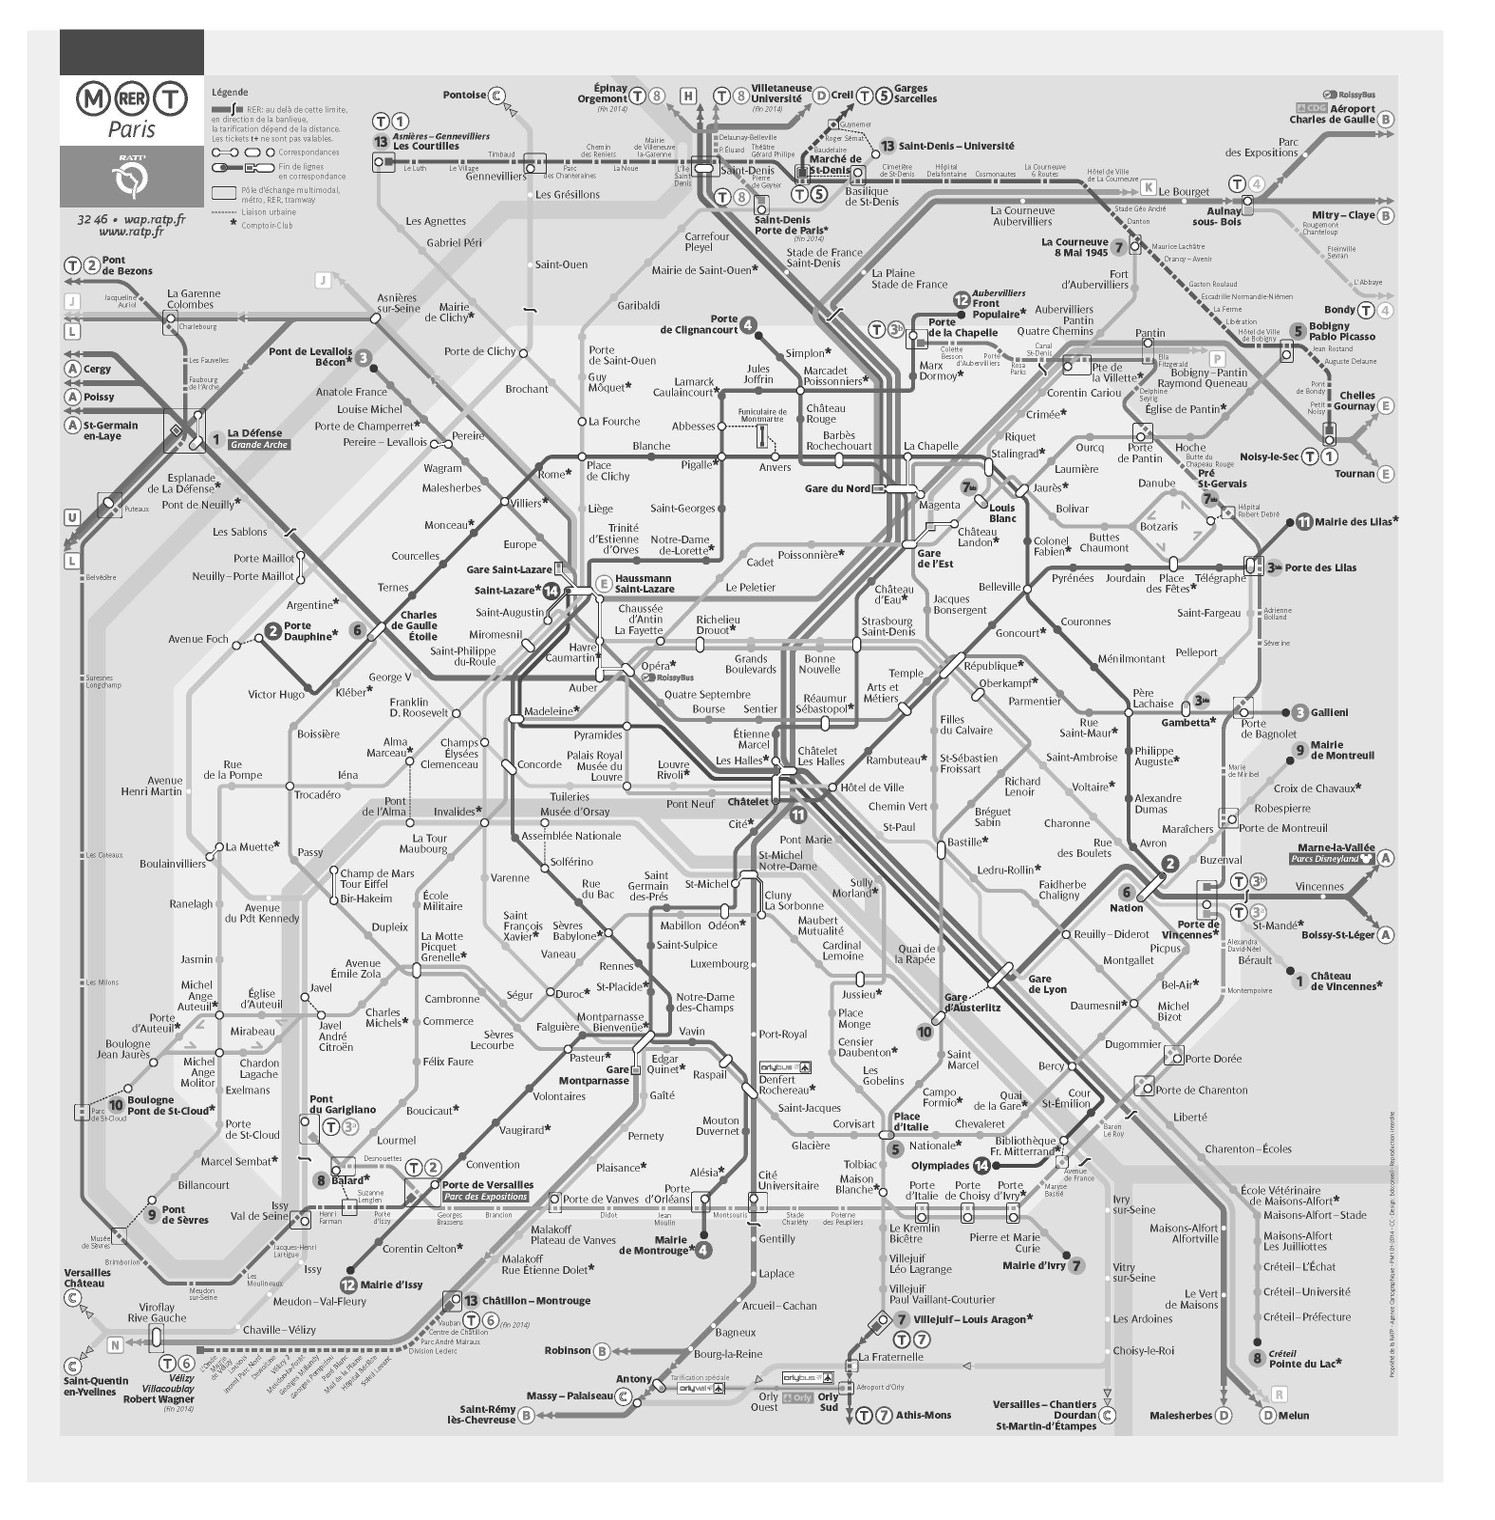
The Paris Metro: A modern radial grid underneath a medieval city. RATP (Paris Transport Authority). All rights reserved.
Paris, Boston, and even Vancouver are well-known examples of the importance of preexisting geography in planning a multimodal system. But the same lesson is on display in less familiar places as well, such as Charleston, South Carolina.
If Vancouver resembles a hitchhiker’s hand, thumb up, Charleston looks, on a map, like a foot trailing in the waters of Charleston Harbor, with the Ashley River on one side and the Cooper River on the other. The southern end of the peninsula is Charleston’s historic heart: a downtown composed of buildings dating back to the eighteenth century. It includes destinations that attract nearly two million visitors annually: the Broad Street shopping district, the City Market, and the South Carolina Aquarium, to say nothing of the Fort Sumter National Monument out in Charleston’s harbor. The College of Charleston and the Citadel, the Military College of South Carolina, between them have more than fifteen thousand students and three thousand faculty and staff. At the northern end of the peninsula, the city—or, rather, the Charleston Area Regional Transportation Authority, or CARTA—is building a state-of-the-art transportation hub, the North Charleston Intermodal Transportation Center, which will connect local transit, like buses and taxis, with both Amtrak and the Southeastern Stages intercity bus network.
Charleston has a strong and growing economy. The Port of Charleston remains one of the country’s busiest, and in 2011, Boeing built a new assembly site for their Commercial Airplanes division in North Charleston. Ten years before that the Charleston Digital Corridor (“18th-century architecture. 21st-century technology”) began actively attracting dozens of telecom, IT, and software companies to the city, in designated neighborhoods like the Gateway District in the north of Charleston’s peninsula, and the University and Wharf Districts in the south. The Charleston metropolitan area is home to around seven hundred thousand people, and is expected to grow to nearly a million over the next ten to fifteen years. Their challenge is supporting this kind of growth without choking to death on automobile exhaust. Like so many other places, the city is carved up by highways. Interstate 26 terminates in Charleston its subsidiary highway, I-526, loops it; and ten other limited-access highways curve around and through it.
In August of 2014, I met with Tim Keane, director of Planning, Preservation, and Sustainability for the city of Charleston, to discuss a future for the city that would allow it to grow using advanced alternatives to the automobile. Historically, as Tim reminded me, Charlestonians have always expected that “they will have a parking space wherever they work and live. But that can’t work anymore; we just don’t have the room.”
On the other hand, they do have a beautiful and untouched urban environment, one that’s older than the steam engine, much less the Model T. Walking around Charleston is a little like walking through a set built for a movie that takes place during the era of America’s founding, only it’s real. It’s not an accident. When Charleston passed the nation’s first preservation law in 1931, the city was already 261 years old. The law, which made it impossible to tear down much of anything, therefore also made it impossible to build anything either, so the core of Charleston has escaped most kinds of development-driven sprawl.
Charleston’s fundamental transportation need isn’t too hard to figure out. With the Intermodal Facility and Boeing to the north, and most of the Digital Corridor, the universities, and the tourist destinations to the south, the peninsula has two potential anchors for a multimodal, multinodal system. CARTA already operates a traditional, fixed-route, motor bus system both in the peninsula and the surrounding areas, and, downtown, it runs a trolleybus system known as DASH, for the “Downtown Area Shuttle”: three different lines circulating along loops through the southern end of Charleston’s peninsula, with stops at the Broad Street shopping district, the City Market, the aquarium, and both colleges. What Tim envisions, though, is a fully operational, north-south trolley, running the entire length of the peninsula. And, he adds, it “must be wonderful” to attract a car-oriented public.
![]()
Vancouver and Charleston need different networks because they have different histories and different geographies. What they all want, though, are the same things: reliability and frequency. The last parts of network planning—the route maps—are the real determinants for the frequency of service along each of the routes: how many trains, buses, or streetcars, and how often they will stop to pick up and discharge passengers. This is always managed as a series of tradeoffs, since more stops means more access, but slower speed. Even the question of whether stops should be located at intersectionsf or mid-block is a tradeoff, since intersections offer more access, but mid-block stops pose less potential for conflict with other transport. If the first measure of a network is how it handles space, the second has to be how it manages time.
Just as varying travel distances favor different travel modes—a five-block walk to the corner drugstore, versus a three-mile-long car trip to the supermarket, versus a thirty-mile commute by train—different travel purposes require different frequencies. Though every few years some company experiments with staggered work hours (and most of the time, they turn out to be pretty happy with the results), the efficiencies of consolidating work in the traditional 9–5 portion of the day are hard to overcome. Rush hour is with us for the foreseeable future, which determines transit frequencies in the peak mornings and evenings.
However, for all other travel, a usefully frequent network is one that stops at a convenient transit node at least every fifteen minutes, and ideally even more often. The advantage of this, of course, is that no one really needs to know a transit schedule to use such a system; you just get yourself to the transit stop, and hop on. Creating such a frequent network isn’t a trivial task. But it can be done, even in some of the most auto-centric cities in the country. Such as Houston, Texas.
Houston isn’t just the biggest city in Texas, it’s the fourth largest city in the entire country, and one of the most sprawling. The city alone has 2.16 million people scattered across more than six hundred square miles, while 6.3 million people live in the ten thousand square miles that comprise the ten counties of the greater Houston metropolitan area. As a region that not only grew up during the automobile age, but whose economy was built on the fossil-fuel business, it’s not much of a surprise that Houston is what you might call automobile dependent. Before the Metropolitan Authority of Harris County—METRO, for short—started its light rail service in 2004, Houston was by far the largest city in the country with no rail transit at all, which is why nearly 90 percent of its residents drive to work—one person to a car, of course—on nearly six hundred miles of limited-access freeways. The road system is organized in a classic spiderweb, with a series of beltways and interstates looping around the city, but it’s hard to call it a very efficient one. Houston is the fourth most congested city in the country, and the average resident spends fifty-eight hours a year stuck in traffic.
With the very modest ambitions of METRORail—only thirteen miles are currently operational, and it will be many years before the seventy-three miles on the drawing board are built out, if ever—the bus system offers the only potential transit alternative to the automobile. But it’s also one of the least attractive, an option used mostly by Houstonians too poor to own automobiles. It’s probably too much to expect METRO to change that anytime soon. But they have identified, and have produced a plan to repair, the mass transit system’s biggest deficiency, which has been its lack of frequency.
If a decently frequent system is one in which most people live within a quarter-mile of a transit node where a bus (or streetcar) stops at least every fifteen minutes, Houston wasn’t doing so well. By those criteria, barely five hundred thousand people qualified, even during peak weekday travel times, and fewer than half of them did so on weekends. A new system, which METRO calls the “frequent network,” would allow 1.1 million Houstonians to board a bus within twenty minutes of leaving home: a five-minute walk, followed by, at most, a fifteen-minute wait. That’s nearly three-quarters of Houston’s transit users, and they would receive the service fifteen hours a day, seven days a week.
Did I mention that the “frequent network” provides this level of service at exactly the same cost as the old system? Designing it was an exercise in good transportation planning basics, going back to the four steps described above, with an added twist. This analysis compared two different transportation goals: patronage, a measure of the number of riders the system could carry, how far, per dollar spent; and coverage, a calculation of service availability: whether every part of town, or every segment of the population, got its “fair share.”
The two goals aren’t necessarily in conflict, but neither are they always in harmony. In Houston, especially, the old system offered far more coverage than patronage, which made the existing route structure a long way from optimal. The existing bus map had largely mimicked Houston’s early-twentieth-century streetcar routes,g and therefore had a lot of stops in places without a significant number of transit riders, and a lot of transit riders in places with no stops at all. This made for a huge amount of waste. The old system had less than half its resources in places with high ridership, while the new one devotes 80 percent of the bus lines to them. The “frequent network” replaced the meandering routes that converged on downtown (now home to less than 25 percent of the region’s employment) with a high-frequency right-angled grid that gets most transit riders to an employment cluster with a single transfer, at most.
They may never get there. Transportation planning in Houston is more like religious warfare than engineering. It’s not that the city has no advocates for walkability, density, and transit availability. Tom Lambert, METRO’s head, says, “Rail used to be a negative word around this town. It’s not anymore.” More than half of Houston’s residents, according to the Kinder Institute’s Houston Area Survey, want to live in a mixed-use community that isn’t completely dependent on the automobile. However, there’s the other half, Houstonians who believe themselves under attack from anti-car zealots who want to turn their city into—horror of horrors—Portland. Vocal and powerful local groups don’t just hate the existing light rail system, but fight the expansion of it as if the train stations were porn shops in which plague-infected crack was being sold to schoolchildren. They dislike buses and loathe trains, but they love, love, love their cars. These are the folks who chose to spend $2.8 billion, twice the cost of the entire METRORail system, on widening a twenty-eight-mile-long segment of I-10 known as the Katy Freeway from eight to—wait for it—twenty-six lanes. As of this writing, METRO’s new multimodal, high-frequency grid may be allowed to improve the lives of a million of Houston’s residents. Or not.
Either way, Houston isn’t going to look like Zurich anytime soon.
![]()
Houston and Zurich are both what have come to be known as “global cities”: places that occupy critical positions in the world economy.* Both have a lot of extremely wealthy residents, and both have a powerful aversion to taxes. And that’s pretty much where the points of comparison stop. Houston was founded in 1836, Zurich in 15 BCE. Houston is flat as a pancake. Make that flat as a crepe: the entire city is between sea level and forty feet above, with a famously steamy climate. Zurich sits on the Swiss Plateau, between 1,300 and 2,800 feet above sea level, with the Alps towering above. The average temperature of the coolest month in Houston exceeds that of the warmest month in Zurich.
To a transportation engineer, all that is just background noise. Zurich is probably the most transit-friendly city in the world.
Zurich is Switzerland’s largest city, with about three hundred thousand people (that’s the city proper; the metropolitan area is home to 1.8 million) tucked into a little more than forty square miles on both sides of the Limmat River just north of Lake Zurich.
Just reciting the options available in Zurich requires taking a very deep breath. The city’s tracked streetcar system operates nearly three hundred trains on fifteen different routes, running on more than a hundred miles of track set flush into the pavement, and carries more than 200 million passengers a year. Nearly eighty trolleybuses, running on six lines that parallel and supplement the streetcar network, add another thirty-four miles to the system, and another 54 million trips. In acknowledgment of the value of a grid system, two of the trolleybus lines run on north-south routes, two on east-west, and two are radial. Not enough? The transit system also runs 180 motor buses on sixty routes, 18 of them within the city of Zurich, for another 37 million trips annually. The Zürichsee-Schiffahrtsgesellschaft (Lake Zurich Navigation Company) operates seventeen passenger ships—two of them renovated early-twentieth-century paddle steamers—that travel from the Bürkliplatz dock at the city’s south end across Lake Zurich and up the Limmat River for another 1.2 million passenger trips annually on short ferry rides—90-minute round-trips to Erienbach, for example—and cruises that can take seven hours. Five additional ferries carry both automobiles and passengers on a ten-minute trip across the lake at a point seven miles south of the city, allowing drivers to avoid nineteen miles of driving, for another 2.2 million people, and more than a million cars and trucks, every year.
If you’re counting—and I know you are—that’s well over 300 million trips on public transit annually, in a city with three hundred thousand residents and a metro area with fewer than two million. And I haven’t even mentioned the S-Bahn, 240 miles of commuter train tracks that knit together the entire canton of Zurich.
Then there are the funiculars. I have a special place in my heart for funiculars, those cable railways that climb up and down slopes too steep for traditional trains that depend on friction to keep them on track. They are a cross between a train and an elevator. Something about looking up or down those tracks evokes memories of Coney Island’s legendary Cyclone roller coaster—my favorite. Zurich has two of them: the Polybahn funicular railway carries two million passengers annually on a 135-foot climb from Zurich’s Central station to the terrace of the Swiss Federal Institute of Technology. And the Rigiblick funicular does the same thing for the six hundred thousand passengers in the city’s northern suburbs, only higher: 308 feet, at an average grade of 25 percent.
Of course, Zurich isn’t the envy of the transportation world just because of quantity. Quality matters, too. And Zurich does even better on those measures. The entire fleet of clean, comfortable, and remarkably easy-to-use vehicles combines the world’s best on-time performance—Switzerland isn’t the watch capital of the world because the Swiss don’t care about punctuality—with frequencies that are almost incredible. Virtually no one standing at any transit node, whether for streetcar, trolleybus, or motor bus, waits more than three minutes before a vehicle stops at it. It isn’t just that Zurich designed a well-integrated schedule and then forgot about it. When you have a schedule that depends on streetcars meeting trolleybuses within minutes either way, a cyclist changing a tire in the wrong place can disrupt the entire system. The only way to keep the system operating at expected frequencies is by constantly fine-tuning it, which is why a network of more than four thousand sensors monitors all traffic, and high-speed computers using intelligent algorithms change signaling within the city on the fly. As vehicles—cars, motorbikes, trolleybuses, motor buses, or streetcars—approach any of the city’s nearly four hundred intersections, detectors buried in the pavement recalibrate signaling times, giving priority to streetcars and trolleybuses. The combination of a dense grid and literally split-second coordination of each different mode and route means that even the longest edge-to-edge trip can be completed in less than thirty minutes—most are less than twenty—even when they require transfers, either from one streetcar to another, or from a streetcar to a trolleybus.
All this shouldn’t be cheap, but it actually is: the equivalent of $30 a month for full use of the entire system. And it’s solvent. Once again, this is Switzerland, and they understand finance even better than they understand clocks. Fares pay nearly half the operating and capital costs for the system, which is far more than in a typical American system.
The reason is that it is so heavily used. According to the 2010 transport “microcensus” performed by the Civil Engineering Office of the City of Zurich every five years, 32 percent of Zurich’s residents use streetcars and trolleybuses regularly, while only 26 percent depend on cars (and motorcycles/motorbikes). Fewer than half the city’s households even own a car or motorcycle. In addition, while “only” 15 percent of all trips are intermodal (that is, involving two or more modes for the same trip), nearly 60 percent of the city’s residents are multimodal (that is, they use different modes for different trips depending on their daily needs and schedules).
And they haven’t forgotten active transportation, either: 36 percent of all trips in Zurich are made on foot, and another 6 percent are by bicycle.
It would be easy to conclude that Zurich’s extraordinary transportation network was the residue of historical good luck. Because of its size and age—some of the city’s streets were laid out by the Romans in the first century CE—Zurich never had to cope with the auto-centric design of newer American cities. Such a conclusion would, however, be a mistake. Zurich is what it is because it decided, not so very long ago, to end its dependence on, and addiction to, the automobile.
Or, more accurately, addiction to parking.
Though parking is a lot less flashy than automated electric trains, or interactive signs that help in finding routes, it’s hard to overstate its importance in building a successful multimodal transportation system or, for that matter, turning streets back into livable places. Back in 1997, Donald Shoup, then at the Department of Urban Planning at UCLA, wrote one of the most cited papers in the entire transportation literature, “The High Cost of Free Parking,” which demonstrated the flaws in setting minimum parking requirements for every land use—for every house, or store, or office building—based on peak demand. The problem with such minimal requirements is that the users of (almost) all such parking got all that parking at either zero cost or at well below the price they were willing to pay for it. Constructing all of it was costing “more than ten times the impact fees”—these are the fees that local governments charge for the public costs of private development, such as water treatment, sewers, but also additional police and fire department costs, even school expenses—“than all other public purposes combined.” Nor was street parking the answer, even if it wasn’t free. Whenever more than 85 percent of curbside parking is taken, significant numbers of drivers cruise looking for a space, causing immediate and paralyzing congestion. In study after study, dating back to 1927, an average of 30 percent of the cars in America’s congested downtowns are cruising for a curb parking space; in Brooklyn, researchers found a whopping 45 percent.
Both problems were part of Zurich’s experience. Prior to the 1990s, Zurich had parking regulations comparable to those in most other European and American cities. For every square foot of new construction, whether residential or commercial, some minimum amount of parking would likewise be required. In 1989, though, the city changed from a parking minimum to a parking maximum. And the maximums weren’t very maximal. For every 1,333 square feet authorized by a Zurich construction permit, developers were allowed to supply only a single parking space. In the United States, a comparable permit would require at least three spaces for the same amount of square footage.
Then, in 1996, Zurich passed a statute requiring that virtually every new parking space be built underground, and that they be priced to what the market would bear. Even more important, they placed a ceiling on the total number of parking spaces in the city. This meant that for every new parking space built underground, at least one parking space on the city’s streets had to be eliminated, until the total amount of parking in the city equaled the amount available in 1990.
The result has been dramatic, and dramatically effective. As of 2014, the maximum parking allowed in Zurich’s city center is 0.08 spaces for every 1,000 square feet of new construction. In the employment and shopping clusters at the city’s periphery it’s not much more generous: 0.5 spaces for every 1,000 square feet. For the 750,000 square feet of commercial space in four new buildings constructed above the city’s Hardbruecke Train Station—one of them thirty-six stories—the city allowed only 250 parking spots. A similar complex in the United States would require at least 2,000 spaces.
Restricting the number of street parking spaces opened up the streets to other uses. Half a dozen streets that until 1996 offered parking (frequently on both sides of streets that were less than twenty-five feet wide) are now fully pedestrianized districts. Rennweg, for example, the main street in the medieval old town of Zurich. Maybe even more tellingly, the Bahnhofstrasse—the Fifth Avenue of Zurich—and the Limmatquai promenade that runs along the Limmat River were major auto thoroughfares ten years ago. Now they’re pedestrian and transit parks.
In my practice I routinely advise my clients to apply for variances that would permit them to provide less parking than required. Many are supportive, not because they hate cars, but because it costs less, and in places like Manhattan, a lot less, since most parking has to be underground, which is very expensive. Fewer square feet for parking also frees up space for other uses: more labs and classrooms for Columbia University’s new campus or more retail acreage for the IKEA home furnishings store in Brooklyn.
One problem with restricting parking, all other things being equal, is that it forces even more vehicles to cruise for longer periods of time looking for space. It would scarcely have helped Zurich’s or Brooklyn’s streets (and, especially, the reliability of the streetcars and trolleybuses that use those streets) if the same number of cars were entering the city, with even fewer places for them to park. Zurich’s answer, one of the best-known aspects of its transit network, is a system of in-pavement sensors like the ones that regulate traffic signals inside the city, but located at municipal boundaries. Those sensors automatically calculate the congestion index for the city at any moment in time. Once a given number of cars have entered the city, the system’s algorithm uses traffic signals to halt automobile traffic on the main roads into the city until congestion falls back to a manageable level.*
For a lot of people, like those fighting the Houston METRO Rail, this is evidence of Zurich’s powerful aversion to the automobile. To be honest, a lot of the city’s most fervent advocates would probably agree. Many people, including a lot of those I speak to and work with, see transportation in very black-and-white terms: either you believe the automobile is the devil’s handiwork, and that cars have no place at all in a virtuous future, or you believe that riding a bicycle to work, or liking public transit, is evidence of something un-American. Both are half right. Which means that they’re both all wrong.
The key to understanding what’s improving mobility and quality of life in Vancouver and Zurich, and may start to do the same in Charleston and even Houston, is that no single transportation mode is ideal. That’s how we got in this mess in the first place, believing that the personal automobile had achieved a kind of perfection in transportation, the ideal way to shop, commute, and socialize. But arguing that the automobile has no place in a properly designed transportation system is as wrong as maintaining that nothing else has any place. Even in transit-happy Zurich, more than a quarter of the population uses a car on a daily basis. Every task that requires moving from place to place has an appropriate solution(s), just as every destination has an optimal route.
But which mode was the most appropriate one? Which route was optimal? These are questions that frequently have simple and elegantly modeled engineering solutions. But no matter how cleverly planners add modes and route choices to the environment, no matter how many new nodes are created, no matter how sophisticated the trip generation models, the real test of a multimodal system is whether its users can navigate it efficiently. In even a medium-sized city, that means that transportation success is a function of millions of decisions made by hundreds of thousands of people every day. Shall I take this route to work, or that one? When do I have to leave the house to make it to the airport in time? Should I drive, or take the bus? If I drive, what are the chances I’ll be able to park my car when I arrive?
Even when definitive answers to these questions theoretically existed, most transportation systems provided no practical way for people to find them, no way to unlock the transportation grid, at least in an acceptable amount of time. Over-engineering the system by simply adding modes and route choices doesn’t make the problems easier to solve. It makes them harder. And it makes it particularly hard on users who might otherwise be inclined to use public transit: if it takes longer to figure out whether it’s cheaper or easier to take a bus or train, or faster to take the express or local, than it does to just get in the car and start driving, people will put away the transit schedules and reach for the car keys.
But, on the other hand, what if it got so cheap, easy, and fast to answer those questions that anyone could do it in a matter of seconds?
![]()
a In an unrelated job action, the trackmen of the Long Island Rail Road, the nation’s busiest commuter line, also struck on April 1, returning to work two days later.
b Because traditional trolleys (sometimes called streetcars or trams, depending on the venue) have metal wheels that run on tracks, rather than rubber tires on pavement, they can be powered by a connection to overhead wires using a single pole, with the conducting metal of the track itself closing the electrical circuit. Trolleybuses need two wires and two poles in order to do the same job.
c Putting together all the inputs, planners use an intimidating-sounding statistical method, ordinary least squares regression, which squares the differences between predicted and actual numbers. Since those differences can be positive or negative, squaring them turns them all into positive numbers, making it easier to fit the observed and predicted results to nice smooth curves.
d Or even on the near or far side of an intersection.
e Yes, even Houston had a system of nearly ninety miles of streetcar and trolley lines. And, yes again, it was one of the systems bought up and put out of business by National City Lines.
f Dozens of different groups of geographers and economists rank such cities annually. As of 2012, according to Foreign Policy magazine, Zurich is number 31 on the list of global cities, with Houston at number 36.
g I used a crude form of this during the 1980 New York transit strike. On April 9, 1980, a day that shall live in traffic lore infamy, the skies opened up and unleashed a torrent of rain and wind. Midtown traffic was paralyzed. I ordered traffic stopped for vehicles entering Manhattan and turned as many lanes as I could outbound, kind of emptying the bathtub of Manhattan of cars. A few years later, I wrote an award-winning paper on the concept, titled “Metering High Density Sectors.”