IN 1973, JUST A COUPLE OF YEARS AFTER I BEGAN WORKING FOR THE NEW York City Traffic Department, the US Department of Defense initiated the project that became the NavStar Global Positioning System, or GPS for short. The original idea was to standardize the systems that the US Navy and (sometimes) the US Air Force were already funding in the hope that satellite technology would revolutionize navigation. The satellite technology was very new; remember, this was only sixteen years after Sputnik, and barely a decade after Telstar, the first communications satellite.
If they only knew. The original idea behind GPS was to launch satellites into orbit around Earth at a distance of about eleven thousand miles, each of them carrying radio transmitters with the most precise time measurement equipment ever invented, accurate to within trillionths of a second. Since the speed with which radio waves travel is the speed of light, if you knew the precise location for each orbiting transmitter, and the time of transmission, and time of arrival for each signal, you could closely calculate the latitude, longitude, and altitude for any receiver on the planet. It took a while to turn theory into practice, not just increasing the world’s computing power by several orders of magnitude but putting twenty-four satellites into orbit (there are now thirty-two) in order to ensure that the entire globe was covered by four at any one time.a But in April of 1995, the system, which had cost somewhere between $10 and $12 billion, became operational, first as a military-only network and five years later as the first precise and practical navigation system for civilians.
In 2000 I purchased my first GPS-enabled car. Ten years later, in 2010, I bought my first smartphone. It came with what was rapidly becoming a standard feature: its own GPS navigation system.
Any number I quote about the number of people with a working GPS receiver will be obsolete by the time you read this (actually, it will be obsolete by the time I finish writing this sentence). In 2010 alone, just under 110 million were sold, more than three every second. By 2013, not even counting standalone GPS units—for some quirky markets; ever since 2006, the USGA has permitted “distance-measuring devices, including GPS-based systems,” for improving the performance of America’s golfers—and the ones built into cars like General Motors’ OnStar system, more than 150 million smartphone users in the US were carrying a built-in GPS receiver, along with a mobile connection to the Internet, pretty much everywhere they went. The implications for what transportation engineers call advanced traveler information systems, or ATIS, are, literally, impossible to exaggerate.
ATIS is more than handheld devices or even the Internet, of course. A whole category of ATIS builds the “I”—the information—into the traveler’s route, rather than the traveler’s pocket or purse. Familiar examples include the time-and-distance signs along many limited-access highways, the ones that read, “8 Minutes to Route 110 Interchange” or “George Washington Bridge: Upper Level 8 minutes, Lower Level 12 minutes.” The mass transit versions of these route-based ATIS are the countdown clocks on train platforms and bus stops that show the time until the next departure or arrival, or their routes.
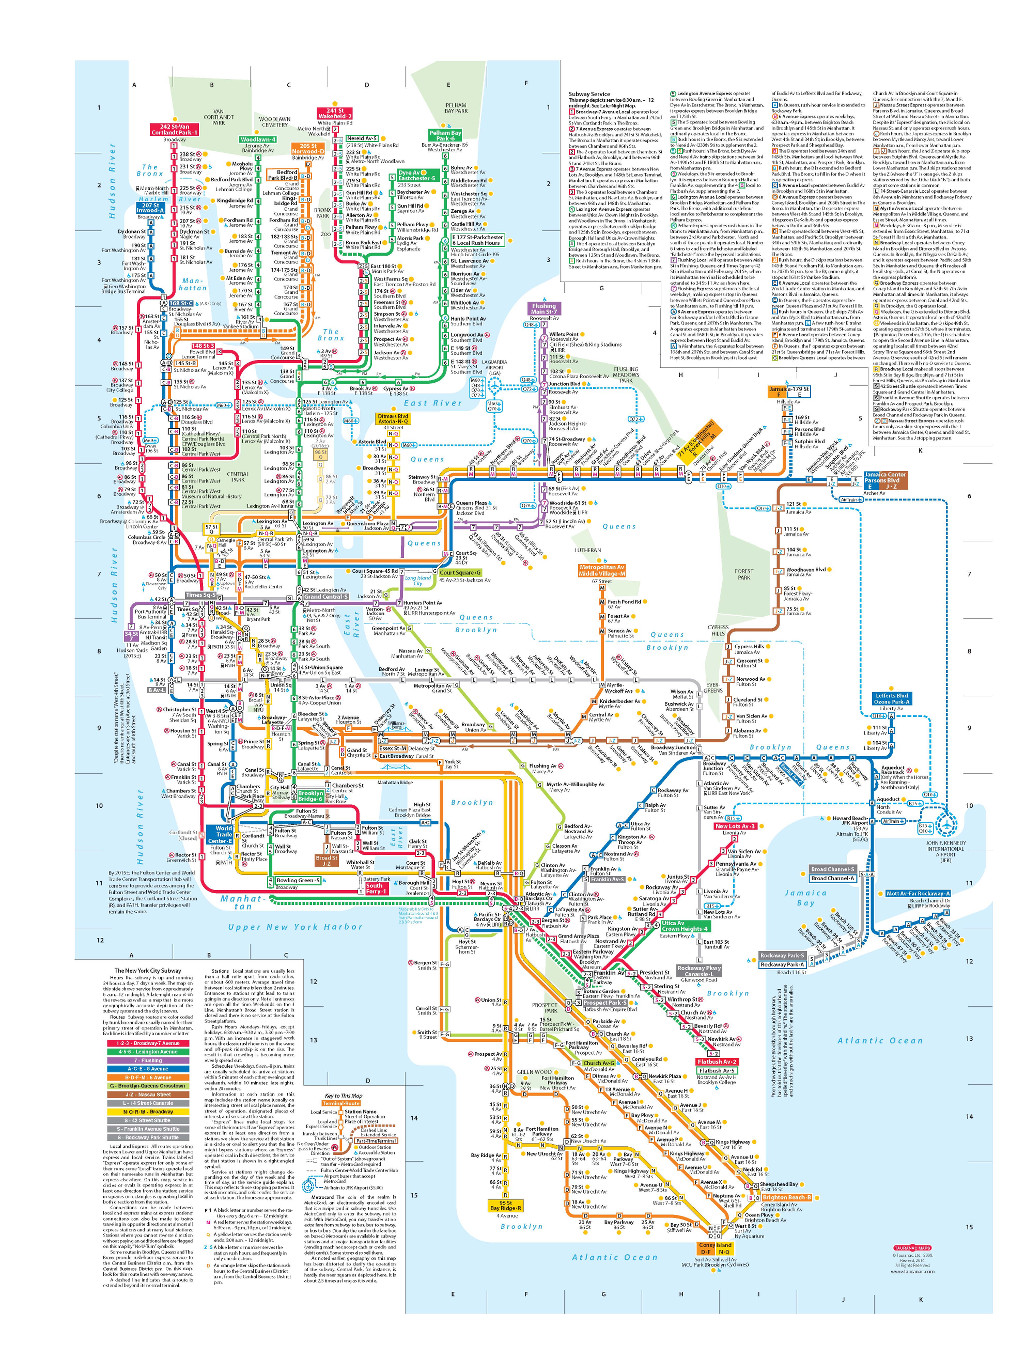
These kinds of systems are really just dynamic versions of traditional signs. What makes them “advanced” is that the information they provide is both accurate and easy to understand, two things that even the best fixed maps don’t do especially well. A map of the New York City subway system is posted in every car and on every platform, and it’s a pretty good one, of its sort.
A thing of beauty: New York subway system map. John Tauranac. Reprinted with permission.
But like the equivalent bus map, it contains both too much information and too little. Travelers who want to get from Rockefeller Center to downtown Brooklyn don’t really need to see every train or bus that will get them to Yankee Stadium. Meanwhile, for what they do want to know—“When is the next train leaving, and how long will it take to get there?”—the map is useless.
This affects different travelers in different ways—important ways. The most important of those differences is familiarity. Because most trips are familiar ones, whether it’s the daily commute to work or the weekly trip to the supermarket, they’re taken on automatic pilot—by the people who take them regularly. We all know not just the shortest driving route for picking up kids at school, but the best places to park, how to avoid the especially dangerous intersection, and even which streets could use a new repaving. All that information makes the familiar trip much easier for you than the unfamiliar one, but the inverse is also true: your familiar trip is someone else’s first experience with it, with all the anxieties and inefficiencies you’d expect.
Don’t take my word for it. Go to any large transit hub like 30th Street Station in Philadelphia, or Union Station in Chicago, and watch how travelers behave. Commuters know where to stand, when the train announcements are made, how much time they have to use the restroom or get a cup of coffee. Tourists, on the other hand—easy to spot, if only by the luggage—are anxious. You can almost hear the questions running through their heads: Do I need to show my ticket to the conductor as I board? Is this an express, or a local? When I arrive, will I be able to catch a bus to my next stop? A cab? When is my train actually going to get here?
It’s like this in every city in the country. One class of travelers knows every stop on the Muni Metro, or the CT1 bus, or the Route 36 streetcar—in San Francisco, Boston, and Philadelphia, respectively—and another one feels like it’s trying to find the way out of a corn maze: intimidated, anxious, and unsure whether to look down at the maps they’re carrying or up at the arrival and departure signs.
Unfamiliarity is always intimidating to the traveler, but the intimidation factor is a bigger obstacle to mass transit use than to driving, since when you’re behind the wheel of your car, at least the vehicle is familiar. It’s even more forbidding for transit that requires the multiple transfers needed to take advantage of the multimodal networks described in the last chapter.
Or, I should say, it used to be. The combination of thirty-two satellites and a couple of hundred million GPS receivers has changed two critical aspects of transportation. First, it has dramatically increased the value and appeal of existing public transit systems. And, second, it has created an entirely new category of transportation options.
In 2010, Next City, a nonprofit organization aimed at improving the sustainability and livability of cities, and a team from the research firm Latitude performed a study of how new technologies like mobile Internet and GPS could improve public transit, both quantitatively (getting people where they want to go faster and more conveniently) and qualitatively (in ways that improve the experience itself).
The program was what is known as a deprivation study: researchers recruited regular drivers twenty-four to fifty-one years old, who agreed to forgo—to be deprived of—driving for a week. The program’s participants stopped driving, but they didn’t stop traveling. Virtually all of them replaced their cars with buses, streetcars, biking, and walking; the average participant used five different modes during the deprivation week (94 percent walked, 89 percent took buses, 61 percent biked; only 6 percent used a scooter). And, because they were unfamiliar with their respective city’s transportation options, they did so using mobile transportation apps. Lots of them.
One reason is that the study was done in two cities where apps of all sorts have a lot of appeal, and where the transit systems are, by American standards, anyway, very high-end: Boston and San Francisco. In addition to the by-now-ubiquitous Google Maps and MapQuest, Boston features dozens of local transport apps, such as Transit Spy, Nextime, Nexmap, and Open MBTA. The San Francisco equivalents—Bay Tripper, iCommute, SFMuniApp, Pocket MUNI—are, if anything, even thicker on the ground. Though the drivers selected for the study weren’t users of anything except driving-specific mobile tools, they had no difficulty finding lots of excellent ones for navigating public transit systems, for choosing safe and efficient bike paths, and even the best routes for walking.
Before and after their week of auto deprivation, the study’s participants were interviewed in depth about their experiences. Two-thirds of them reported that the absence of a car exposed them to new experiences. They felt more connected to their communities. Many felt literally claustrophobic when they returned to driving after the deprivation experiment.
There’s more. The results confirmed that a perceived “experience gap” separating driving from public transit explains a lot of the resistance many travelers have about transit in general. And the biggest chunk of that gap wasn’t the feeling of ownership they got from their cars, or the greater comfort of driving. It wasn’t even status. Though Americans, especially those Millennials, still derive status from their consumption choices, they’re now more likely to do so from the services they choose, rather than the products they own: Netflix and HBO, not DVDs. Spotify, not CDs.
So, if not comfort or status, then what? Autonomy. Travelers feel helpless and dependent when they have to rely on public transit, independent when they’re behind the wheel of a car. Specifically, most respondents tend to think that boarding a bus or train makes them hostages to an inflexible system. They believe, with some justice, that they can make in-the-moment decisions when driving that aren’t possible on a streetcar, train, or bus.
They have a point. You can’t reverse a bus because you forgot your purse at home, or stop a streetcar because you have a sudden hunger pang that strikes you as you pass a barbecue joint. From scandals like National City Lines’ purchase of dozens of urban streetcar lines in order to shut them down, or political decisions like the GI Bill’s preference for suburban construction, or the Interstate Highway System’s subsidy for limited-access roads, it’s tempting to conclude that the automobile never had any intrinsic appeal at all, that it triumphed over public transit in a rigged game. But that turns out not to be completely true. The dice were loaded, all right, but even if they hadn’t been, the private automobile would still have been a very attractive choice for most people. There was always a lot of autonomy in the automobile.
This appears, at first glance, to be an obstacle for a multimodal, active transportation future. But I choose to see it as inspiring. What the research shows isn’t that travelers want cars, but rather that they want freedom and control. If technology can make them feel free and in control, if it can liberate them from, for example, the tyranny of cars, such as the need to find a place to park them, they’re going to like it. A lot.
Overall, the reactions of the deprivation-study drivers to a week of being walkers, bikers, and smartphone-wielding passengers were nearly all positive. But, as is often the case, the more they got, the more they wanted. Most especially, they wanted (and needed) a comprehensive information resource that showed all possible travel choices, with comparative data on time, availability, and cost.
It’s not there, not yet. But the reason it’s getting closer all the time is the other reason that San Francisco and Boston were chosen for the study. Both cities are pioneers in what’s known in the app business as “open data.” While the municipal transit agencies in both places produce half a dozen different user-friendly components of an intelligent transportation system, they don’t make them all. They don’t need to. They just need to give away the information they’re already collecting. Just a few years ago, according to Richard Davey, general manager of the Massachusetts Bay Transportation Authority, “providing riders with real-time information would have required the installation of costly signs at bus stops throughout the system.” Now, though, all they have to do is to make the data freely available, and wait for third-party developers to step into the breach and create apps; in Boston as of this writing, there are more than thirty just for the trains and buses of the MBTA.
Open data is making things happen in systems all over the country, some of them a lot more surprising than San Francisco and Boston.
• In America’s mountain West—the “Greater Yellowstone Region,” which hosts more than three million visitors annually—transportation providers in twenty-seven rural counties in Idaho, Wyoming, and Montana have formed, through a member co-op, the LINX system, a web and mobile app that allows users to book and confirm tickets for transit throughout the region. LINXComm—still testing, as of this writing—offers online ticketing, GPS location information, and Wi-Fi service on the region’s buses.
• In the mid-sized city of Chattanooga, Tennessee—170,000 people live in the city proper, half a million in the metropolitan region—the Chattanooga Area Regional Transportation Authority’s SmartBus program allows users to connect to vehicles on the sixteen lines within the system by using cellphones and Wi-Fi access on buses. Automated announcements from CARTA send texts and messages to mobile devices advising of bus delays, arrivals, and route changes in real time.
Real time is real important. A survey of Chicago-area commuters unsurprisingly concluded that awareness of, and experience with, real-time transit information increased ridership, especially among infrequent users of the transit system. A lot of people who tended to avoid transit because of earlier experiences with an opaque system were lured back once it became clearer. Another study, this one of the King County system of Seattle/Bellevue, Washington, showed something even more important, at least for anyone interested in persuading more people to choose transit. It turns out that riders without real-time information consistently report their perceived wait times as longer than the actual time they experience. Time always seems longer in the absence of a known end point, and not just for transit; if you’re asked how long you’ve been watching a particular movie, you’re far more likely to overestimate the time when you don’t know when it will end. The same is true for transit. When riders were given accurate information about wait times for buses—King County’s OneBusAway system provides next-bus countdown information by website, text message, and smartphone apps—it not only decreased their actual wait time (because they were able to arrive closer to true departure times) by nearly two minutes, but decreased their perceived wait time by an additional 13 percent. That’s made for lots of happy (or, at least, happier) bus riders in King County.
Not as many as in Salt Lake City, though.
The geography of Salt Lake City, the biggest city in Utah—and the biggest city in the huge and sparsely populated portion of the United States known as the Intermountain West—makes it a surprisingly promising place for building a workable transit system. The city itself has the advantage of decent density, with 190,000 people living in about 110 square miles, but the real advantage is the topography of the metropolitan area. Mountain ranges and lakes pack the 2.3 million people who live along the Wasatch Front, a string of cities connecting Salt Lake with Ogden to the north and Provo to the south, into a space that’s 120 miles long but nowhere more than about 18 miles wide. The Wasatch Front can’t really sprawl.
Basin-and-range geography made building a world-class regional transit system possible in Utah. It didn’t require it, though. That’s something Salt Lake City chose for itself. In 1997, after the city was picked to host the 2002 Winter Olympics, politicians, business leaders, and farmers’ associations from the four-county area surrounding Salt Lake recruited environmental and urban planning experts to host a series of public meetings that they named “Envision Utah.” The idea was to accommodate both the surge associated with the Olympics and the predicted long-term growth of the region, to do so in a way that preserved the natural environment that made it so attractive in the first place, and to keep Salt Lake City attractive to the next generation of transit-happy Millennials.
The hallmark of Envision Utah was what its creators called a strategy of “quality growth”: an explicit commitment to less sprawl and more density. Less reliance on cars, more on walking and transit.b Step one was the TRAX light rail system—multiple-car trolleys powered by overhead electrical wires—that opened with seventeen miles of track and twenty-three stations in 1999. It was an immediate success, so much so that the crowds soon rivaled those of Tokyo subways at rush hour. By 2006, the Olympics were long gone, but the Utah Transit Authority, or UTA, had expanded the system to accommodate virtually the entire Wasatch Range metro area. It added twenty-eight miles of new trolley track, forty more stops, and the FrontRunner, which carries passengers on eighty-eight miles of heavier commuter rail running from Ogden through Salt Lake all the way to Provo. The University Line, to the University of Utah and Medical Center, was opened between 2001 and 2003, taking daily student ridership from 1,500 a day to more than 10,000.c A new Green Line connected the city with its airport, the Red Line with Amtrak’s California Zephyr train to Chicago, and the Blue Line with the FrontRunner to Provo. The Blue Line also connects with Salt Lake City’s Sugar House Line, which serves one of the city’s oldest neighborhoods with another fixed-rail system powered by overhead wires, but one more like a streetcar. The Sugar House Line runs more slowly than the rest of the city’s trolleys, stops more frequently, and uses single cars rather than multicar trains.
With its combination of traditional buses, bus rapid transit, streetcars, and light and heavy rail, Salt Lake City may have the most multimodal transit system in the United States. It might even be the best large public transportation system in North America. That’s what Michael Melaniphy, president of the American Public Transportation Association, said when APTA named Utah Transit Authority 2013’s “outstanding public transportation system,” though he couldn’t have been very surprised. It was the fourth time that UTA had been recognized by the association.
But while UTA gets a lot of deserved applause from the professional engineering community for building such an extensive system so rapidly—in the five years from 2008 to 2013, UTA completed seventy miles of rail line—and from Salt Lake City’s taxpayers for doing it for $300 million less than was budgeted for it, the system wouldn’t be very popular with riders if none of them could figure it out. And it’s definitely popular. Annual ridership is closing in on forty-five million, with nearly twenty million trips on UTA’s 130-plus bus routes. The routes include the MAX, a limited-stop bus with dedicated lanes, credit card ticketing, and traffic signal priority, which UTA calls “light rail on rubber tires.” As MAX buses approach intersections, the lights turn green, which is the reason that they enjoy an unheard-of 97 percent on-time performance. TRAX generates more than eighteen million trips and the FrontRunner is closing in on four million, with a few million more trips via streetcar, vans for the disabled, and so on.
This kind of arithmetic is impressive, but it’s also daunting. Salt Lake City is an emphatically multimodal system, which means that a very high percentage of trips require a transfer from one route to another, and frequently between modes. It’s hard to see how this could work with nothing but a traditional map.
Luckily, it doesn’t have to. As far back as the 2002 Olympics, when the Federal Highway Administration commissioned a study of what even then was Utah’s state-of-the-art intelligent transportation system, the state’s transportation agencies have been leaders in getting information to travelers. It’s not much of a surprise, then, that UTA has embraced mobile information systems as enthusiastically as any system in the country. On its own, it operates mobile and web-based apps like Ride Time, UTA Pro, TRAX Tracker (this one includes countdown times for the next three trains), and UTA Tracker (with a special version for students at the University of Utah, more than a third of whom are commuters who get to classes using UTA). UTA also allows third parties access to its data, which means that riders throughout the Wasatch Range can use apps like GeoUTA, a GPS-driven app tracking UTA buses; iTransitBuddy Lite for train schedules; Roadify Transit for real-time arrivals and departures for multiple transit choices; SmartTransit; and Moovit, which uses UTA-supplied open data but supplements it with anonymous crowd-sourced information.
It’s not just Utah, of course. CityMapper (the “Ultimate Transit App”) provides point-to-point routing plus real-time departure information on every available form of public transit for San Francisco, Chicago, New York, Washington, DC, Boston, London, Paris, Berlin, Madrid, Barcelona, Milan, and Rome—and, with a single stroke, will plan a “get me home” route, as well. TransitAPP uses its software platform and the GPS locator in any mobile device to show a similar menu of transit options and departure times, plus the availability of bikeshares, and any service advisories in real time for eighty-seven cities (and counting) in the United States, Europe, and South America. The “directions” panel from Google Maps, of course, does the same thing for everywhere Google Maps has a map, which is, of course, everywhere, including the floor of the Atlantic Ocean, a region with fairly limited transit options.
Apps don’t just make travel faster or more efficient. Though less known than Google Maps or CityMapper, a bunch of mobile apps with names like Random GPS, Serendipitor, and Drift generate routes for dérives (French for “drift,” or aimless strolling—and, yes, I know how silly this sounds). One team of researchers from the University of Torino and Yahoo Labs created a mobile mapping algorithm that didn’t find the shortest routes, or even the most meandering, but the most pleasant—the ones with the greenery and the Victorian houses—using an algorithm that ranks every route choice along three criteria: beauty, quiet, and happiness. As you might guess, quantifying this wasn’t the easiest thing in the world. The researchers used the online votes given to 3.7 million photos of London street scenes, and another 1.3 million from Boston, loaded on the photo-sharing site Flickr to compute the elements that resulted in the highest vote totals. The “psychogeography”—yes, this is actually a thing; it’s been part of the world of academia since the 1950s—algorithm generates four different paths from London’s Euston Square to the Tate Modern: the shortest, the quietest, the prettiest, and the happiest.
I suspect that apps like these have barely scratched the surface of what all that information and computing power can do. It’s not entirely accurate to say that smartphones have made us smarter, but in a way they have. Give me an iPhone and a broadband connection and I could probably fight Ken Jennings to a draw in a mano-a-mano game of Jeopardy. With the same tools, even a first-time visitor to New York might beat me in a subway race from Bensonhurst to Lincoln Center.
This phenomenon illustrates, as well as anything I know, what the Street Smart program is all about. Until very recently, nearly everyone made travel decisions—Shall we walk or ride? Depart this morning or this afternoon?—using a very limited number of tools that were mostly just a combination of habit and guesswork. In many parts of the world, that’s still the case.
In smart cities, though, these limits don’t exist anymore. In them, giant oceans of information about schedules, prices, and routes are easily navigated by just about everyone. It’s not that smart cities are filled with nothing but smart people (though it may be that they’re the first to realize the advantages of living in them). It’s that you don’t have to be a genius to get the most out of smart buses, smart streetcars, smart sidewalks, and, of course, smart streets.
![]()
In August of 2014, I used the car service known as Uber for the first time. I had been at the annual Sam Schwartz Engineering Coney Island Afternoon, which gives folks in our New York office the chance to blow off some steam riding the (very scary) Cyclone wooden roller coaster, which has been terrifying riders since 1927; to take the swinging car on the Wonder Wheel; and even to experience the thrill of being shot into the air from gigantic slingshots, which is where I, at least, draw the line. After, and I stress after, the rides, we have a picnic-style dinner of hot dogs, hamburgers, and fries.
By the time dinner was done, the August sun had set. We had all taken the subway from our Manhattan office to the last stop in Brooklyn, and I intended to return the same way. But after a few beers and feeling really good, I thought, “Why don’t I try Uber?” I had read enough about it to know that how popular it had become, and had, months before, downloaded the app to my smartphone, but there’s nothing like doing it. I logged in, punched in my request, and was told that a car would pick me up in three to four minutes. It even showed the car on a map and I could see it was pretty close. After five minutes, though, the car wasn’t any closer. I was confused. Like all first-timers with a new toy, I thought I had done something wrong, though I discovered, soon enough, that the driver wasn’t actually in his car but relaxing at his apartment when he got the message, and it took a few minutes before he dressed and hopped into the car.
I now use Uber with some frequency and have had nothing but good experiences. It is reliable, safe, and not too expensive. I do worry, however, what a fleet of cars transporting one passenger at a time means if it continues to grow at the pace of Uber. Think of a building the size of the Willis Tower in Chicago in which everyone gets to ride in his or her own elevator, alone. This is a reason that my firm is working with VIA, a company that solves part of the problem by using a single vehicle to transport up to eight people with eight different origins and destinations efficiently through the use of very complex algorithms. Though I have to admit that another part of the reason I find VIA, Uber, and their ridesharing competitors so fascinating is that so many of the people who are now working on these kinds of complex traffic problems are, like me, lapsed physicists, using sophisticated mathematics to improve the world of transportation. (In fact, my professor brother, forty years after rejecting me as a physics has-been, invited me to a physics PhD candidate’s defense of her thesis, which mathematically described the flow of traffic on highways. Now who’s the scientist?)
Actually, although Uber is often described as a ridesharing company, the “sharing” part is a little disingenuous. In fact, the only sharing that applies to most of the trips taken by travelers using Uber or Lyft (though not VIA) comes from the drivers sharing their cars with passengers. What these companies actually do is ride-matching.d The basic structure of the business is fairly simple. Drivers pass background checks (of themselves and their cars; in some places, like New York, they are also required to have a specialized license). They are given either dedicated phones or apps for their existing phones. Whenever they’re online, they get messages telling them when an order has been placed for service within what a GPS-driven algorithm concludes is a reasonable distance away. Meanwhile, a customer who has an account with the service requests a ride, is told the price, and confirms. After the ride is complete, the customer’s credit card is charged, with some percentage going to the ride-matching service and the rest to the driver, who is responsible for gas and tolls. Most of the services also oblige drivers and customers to rate one another. Which is why, even more than state-of-the-art apps for public transit, they are creatures of the age of mobile GPS.
Very young creatures, at that. Uber is, as I write, the largest and the oldest of the ride-matching companies, though it began as a service offering limos and SUVs in San Francisco only in 2010. (A few earlier incarnations confuse matters, but that’s when the mobile app at the center of the service, which handled reservations, payment, and driver ratings, went live.) At the time, the base fee was $8 plus $5 a mile and a $15 minimum. Two years later, the company launched the UberX program which expanded the service to offer “sharing” for essentially any driver who could pass the background check and owned an acceptable car.
That was when things started to heat up. Competitors like Sidecar (launched January of 2012) and Lyft (founded summer of 2012 as an extension of an earlier city-to-city ridesharing service known as Zimride) noticed the potential upside for a business that could extract revenue from travelers without actually investing in anything as expensive as buses, trains, or even cars; all that they needed were software algorithms and marketing. Though the California Public Utilities Commission, under pressure from existing taxi services, shut them all down, it allowed them to reopen the following year as what the state of California now calls “Transportation Network Companies.”
Uber, by far the biggest kid on the ridesharing block, expanded to Paris, Toronto, and London in 2012, and hasn’t looked back. By 2015 you could download the Uber app to your smartphone and request an Uber pickup in more than two hundred cities in forty-five countries.e This kind of growth attracts all sorts of attention. USA Today picked Uber as their “tech company of the year” in 2013, and venture capitalists have invested so much in the company that, as of the end of 2014, it had a valuation somewhere north of $40 billion.
Not all the attention was positive, however. None of the original San Francisco–based companies, or newer arrivals such as the Israeli startup Gett, have figured out how to avoid controversy for more than a week or two. The backlash against Uber specifically, and ride-matching companies generally, was as rapid and ferocious as the business’s own growth. In general, the complaints came from one (or more) of four categories:
• Objections from existing taxi businesses and competitors either because companies like Uber threatened their monopolies or because, as unregulated competitors, the ride-matching companies enjoyed an unfair advantage.
• Objections from consumers, mostly over the Uber-specific policy of surge pricing: raising fare prices by up to 500 percent during times of high demand.
• Objections from other ridesharing services about abusive business practices.
• Objections from their own drivers.
All of them have their points. I can understand why taxicab drivers, who paid hundreds of thousands of dollars (or in New York, more than a million dollars) for what they were told was an exclusive franchise, might be upset to learn that it wasn’t nearly as valuable in 2015 as it had been in 2012. In Chicago and New York, during the two years after those app-driven fleets appeared, the price of an exclusive taxi medallion fell 17 percent (for a New York City taxi medallion, this represented a decline of nearly $180,000). In Boston, it fell 20 percent. I also get the bad feelings engendered by surge pricing. Though I believe in raising tolls on bridges and tunnels to transit-rich areas like Manhattan to reflect the real demand for them, I also understand why charging a hundred bucks for a twenty-block ride just because it’s snowing and it’s Valentine’s Day can tick people off.
The concerns about business practices, which include threatening journalists and making false reservations with competitors to limit their performance, aren’t really in the same category. It’s not that they’re not important, but that they’re not integral to the ride-matching business model. Complaints that come from drivers are a little different. So long as Lyft and Uber and the others are in competition with one another, they’re going to be under pressure to cut prices, which inevitably comes out of the pockets of their drivers. And so long as they’re able to offer such great service by saturating neighborhoods with cars, they’re not just competing with other companies. Uber’s own drivers are, inevitably, competing with one another, and a significant number of them are working for what amounts to a little above minimum wage. In Los Angeles, the largest US market for the most popular service, uberX, drivers average less than $17 an hour before gas and tolls.
However, even these aren’t the biggest concerns. If the goal is to improve mobility for city dwellers—to replace automobile dependency with active and multimodal transportation options—then it’s difficult to see how ride-matching can ever be more than a small part of the solution. That’s because the defining characteristic of the Ubers and Lyfts of the world (and of their very vocal cheerleaders) is hostility to regulation.
For decades now, regulation has been getting very bad press, and not just from conservative politicians and libertarian economists. Everyone has a list of silly bureaucratic rules that have long outlived their usefulness, and I’m no exception. One of my favorites is the requirement that a car’s registration sticker be to the left of the inspection sticker or you’ll get a ticket. Wait, I think it might be the other way around. Actually, I’m not sure whether it applies when you’re in the car or facing the car. But, after spending a lifetime studying the subject, one of the few unarguably true things I’ve learned about transportation networks is that access to them can’t be efficiently allocated by an unregulated free market.
The first problem with eliminating, or strictly limiting, regulation of these new and exciting services is consumer protection. Because ride-matching isn’t a regulated business, the relationship between drivers and riders—all that “sharing”—is governed by contract law. When you download an app and take a trip in a car you summoned, the contract you accepted is between you and your driver, not with the company that created the app. Uber isn’t responsible, for example, if one of their drivers attacks you, or runs you down. That’s why they insist that the drivers carry liability insurance of $1 million. The company’s terms and conditions include the following (the capitalization is theirs, not mine):
YOU ACKNOWLEDGE THAT UBER DOES NOT PROVIDE TRANSPORTATION OR LOGISTICS SERVICES OR FUNCTION AS A TRANSPORTATION CARRIER. UBER’S SERVICES MAY BE USED BY YOU TO REQUEST AND SCHEDULE TRANSPORTATION OR LOGISTICS SERVICES WITH THIRD PARTY PROVIDERS, BUT YOU AGREE THAT UBER HAS NO RESPONSIBILITY OR LIABILITY TO YOU RELATED TO ANY TRANSPORTATION OR LOGISTICS PROVIDED TO YOU BY THIRD PARTY PROVIDERS THROUGH THE USE OF THE SERVICES OTHER THAN AS EXPRESSLY SET FORTH IN THESE TERMS.
UBER DOES NOT GUARANTEE THE SUITABILITY, SAFETY OR ABILITY OF THIRD PARTY PROVIDERS. IT IS SOLELY YOUR RESPONSIBILITY TO DETERMINE IF A THIRD PARTY PROVIDER WILL MEET YOUR NEEDS AND EXPECTATIONS. UBER WILL NOT PARTICIPATE IN DISPUTES BETWEEN YOU AND A THIRD PARTY PROVIDER. BY USING THE SERVICES, YOU ACKNOWLEDGE THAT YOU MAY BE EXPOSED TO SITUATIONS INVOLVING THIRD PARTY PROVIDERS THAT ARE POTENTIALLY UNSAFE, OFFENSIVE, HARMFUL TO MINORS, OR OTHERWISE OBJECTIONABLE, AND THAT USE OF THIRD PARTY PROVIDERS ARRANGED OR SCHEDULED USING THE SERVICES IS AT YOUR OWN RISK AND JUDGMENT. UBER SHALL NOT HAVE ANY LIABILITY ARISING FROM OR IN ANY WAY RELATED TO YOUR TRANSACTIONS OR RELATIONSHIP WITH THIRD PARTY PROVIDERS.
Uber clearly has no legal exposure whatever. But the real problem with an unregulated market in ride-matching, where the number of smartphone-dispatched cars is limited only by the number of willing drivers, isn’t a lack of liability. It’s a surplus of VIM: Vehicles in motion.
The VIM problem isn’t a new one, but then, once you strip away the GPS and smartphone apps from ride-matching services, they’re not entirely new either. What they resemble, more than anything else, are old-fashioned radio-dispatched limousines, a subject with which I have some history. Back in 1982, when the number of taxi medallions in New York City—at that time, 11,787, which was the same number issued in 1937, although since then it’s been allowed to increase to 13,347—seemed inadequate to the demand, a guy named Bill Fugazy, who owned the Fugazy Limousine Company, announced that he was prepared to put six thousand brand new limousines on the streets of the city, each of them just a phone call away from anyone with a credit card.
The number actually didn’t sound too daunting. More than thirty thousand vehicles enter Midtown Manhattan each hour, two hundred thousand a day. Manhattan’s bridges and tunnels were handling more than one million daily. What could be so difficult about handling another six thousand? The mayor was for it. The City Council was for it. The voting public was for it. The only people who saw any red flags were cranky transportation engineers. Such as me.
What we knew was this: at that time, the number of vehicles in Manhattan’s Central Business District at any one time was between 139,000 and 181,000. But we also knew that not all of them were actually moving. Many if not most were parked. I figured that the way to calculate the true number of vehicles in motion for any given hour required knowing the miles traveled—yes, our old friend VMT—during that hour divided by the speed, in miles per hour.
Simple algebra. And simple geometry. Knowing, for example, that the core of Manhattan’s grid comprised segments of eleven avenues, each segment 1.19 miles long, I was able to calculate that, during the morning rush hour, between the hours of 8 and 9 a.m., only a few more than 5,200 vehicles in the core were in motion, and the maximum number that would allow any movement at all was less than 9,000. Which meant that if only a third of those radio-controlled limos-of-the-future were to operate in the most desirable part of New York at any given time, they would increase traffic density by at least 20 percent. The result? Total gridlock.f As I wrote at the time, all those limos would be stopped dead, with their only purpose to provide seating space on Manhattan streets at $25 per hour.
It’s not just a New York problem. Every city on the planet has a measurable VIM maximum. It’s a different number for each city. In Manhattan, it’s a little more than seven thousand cars. Each car above that critical number on the streets results in fewer total miles traveled. Nor is it like an on-off switch. Mobility starts to degrade long before complete gridlock occurs.
This doesn’t mean that there’s no place for ride-matching services in a Street Smart city. Not only are they hugely convenient, they make the decision to live without a personal car possible, even attractive. I applaud the technology that created them, and expect that they will continue to supplant existing taxi companies, or to convert those existing companies to a service that looks a lot like Uber: cabs that can be summoned to a particular location using GPS, and paid for using smartphones. But to the degree that their appeal depends on increasing the supply of cars to the point that no one is ever more than a few minutes away from a roving driver waiting for a smartphone to put driver and rider together, the model is fundamentally unsustainable. Long before enough smartphone-carrying drivers hit the streets, the VIM tipping point will be reached. Beyond that point—that is, beyond the maximum carrying capacity of a particular city’s streets—the numbers won’t add up to more mobility, but less.
This is an unavoidable fact of life. No matter how sophisticated the technology becomes, public streets will remain a public resource with finite capacity. When ride-matching services like Uber and Lyft treat city streets as a free good, they’re just repeating the same conceptual mistake that the original champions of motordom did during the 1920s—the argument that, while streetcars and trains were responsible for maintenance of “their” right-of-way, streets were free for everyone. Smart cities shouldn’t insist on stupid regulation. But that doesn’t mean they can do without regulation at all.
![]()
On Alice’s second trip through the looking glass, she meets Humpty Dumpty, who tells her that the word glory means the same thing as “a nice knock-down argument.” When she objects, he tells her, “When I use a word, it means just what I choose it to mean—neither more nor less.”
Smart city is like that. Ever since the term smart cities started appearing in the early 2000s, it’s been used in a dozen different senses, from describing the sort of place that attracts creative industries like publishing, design, R&D, and advertisingg to one that is able to adapt to changing circumstances, to one that offers a more sustainable quality of life. Smartness, in one definition, is anything that results in better public services and lower energy use. Cities are said to have smart infrastructures, smart governance, and smart healthcare, and each category is foggier than the last.
For transportation, though, it’s a lot clearer: A smart city uses information to improve mobility and access for its residents and visitors. The more it uses information, the smarter it is.
In the same way that widely distributed and accessible information is changing consumption choices from products to services, it’s transforming the components of mobility from the physical—vehicles, tracks, roads, fuel—to the virtual. This isn’t just the Millennial-led revolution in work, entertainment, shopping, and socializing, all of which are now activities that can be done, at least some of the time, without leaving home. It is a shift in the kind of infrastructure that can now be built for when we do leave home.
Think of it this way: Ever since the architects and builders of the first cities started roughing out their plans on clay tablets or papyrus scrolls, they’ve faced the same kind of problem, which is that their transportation corridors, whether roads or rails, needed to be built to accommodate peak demand. By definition, therefore, during every time of the day or year when demand was below the peak, the systems had a lot of surplus capacity, what we in the trade call over-engineering. As cities grew, so did peak demand, and, for a long time, the only way to satisfy that demand was by increasing capacity: More (or wider) roads and rails. More over-engineering.
Lots of people have heard of the “Report Card” on America’s infrastructure prepared annually by the American Society of Civil Engineers. (Full disclosure: I’m not only a member of the society but have served on the New York Committee on America’s Infrastructure, which is responsible for assigning grades.) The Report Card gives a grade to sixteen different categories of America’s infrastructure, from aviation to ports to schools to inland waterways, and if you’ve heard of it at all, you probably know that our overall GPA is currently a pretty pathetic D+. That same report estimates the investment needed to bring us up to a passing grade by 2020 at $3.635 trillion—that’s trillion, with a “T.” The largest single component of that number, $1.735 trillion, is surface transportation: roads, highways, transit, and bridges.
However, when you dig a little deeper into the way in which that number was calculated, here’s what you’ll find.
In the “Roads” category, the biggest reason that the ASCE gives America’s four million miles of public roadways a grade of D is the costs of congestion. But as we’ve seen, congestion isn’t always what it appears. The congestion paradox—that more congestion is correlated with higher prosperity—would seem to argue that spending hundreds of billions of dollars in road construction to alleviate it might not be the best way to improve the average American’s bank account.
Even better—or worse, really—the ASCE Report Card on roads also makes some unpersuasive assumptions about future driving habits. This is a direct quote from the 2013 Report Card:
While VMT has been decreasing over the last few years [that is, from 2004 to 2010, which is the last date available for the ASCE numbers] due to continued congestion and the recession, the trend is not likely to continue for a long period of time.
This is an assumption backed up, literally, by nothing. My colleagues at the ASCE even backtrack a bit in the same report, pointing out that “our nation’s roadways can benefit from significant performance improvements without adding new highway lanes . . . including wider use of performance pricing, variable speed limits, and more efficient signal timing.” Unmentioned, for some reason, are other applications of the newest tools of the information revolution, ones that make it possible, for the first time, to redistribute demand across different times, modes, or routes, allowing the same infrastructure to carry more people from place to place quickly, safely, and efficiently. This is actually good news. It turns out we can improve many, if not most, of the deficiencies of American roads for a whole lot less than a trillion dollars. Smart cities are using those technologies for managing peak transportation demand in the same way that a modern power grid automatically reroutes electricity. And for the same reason: they save money.
The comparison between the power grid and the transportation network is a pretty good one. From the time the first power grids were built at the end of the nineteenth century through the 1960s, power companies had a similar peak-demand problem as the same era’s roads and rails: if you build for peak demand, you find yourself with a lot of expensive and redundant capacity, like “peaking power” generators that were turned on only when July heat waves caused millions of air conditioners to work overtime. The reason was the same for power generation as for transportation: since electric utilities could measure power demand only in limited ways, they had to over-engineer the system.
Now, though, what is known as a “smart grid” has the ability to collect huge amounts of data from devices like automatic meters that provide continuous real-time information. With access to so much information that it is measured in exabytes,h and the computer capacity to analyze it instantaneously, the system becomes highly dynamic. Some devices, like air conditioners, now have the ability to adjust their cycles when the grid is working its hardest. Like the old-fashioned grid, a modern smart grid can shunt power to different portions of the network automatically, but it can also manage consumption.
There are dozens of analogies for this kind of data collection and management in a smart city’s transportation grid. The four-thousand-plus sensors that Zurich Public Transport uses to manage automobile and streetcar traffic are one of them. Like an electrical utility adjusting the cycle of an industrial air conditioner because the system is operating at peak demand, Zurich allows only as many cars into its center city as can be accommodated without congestion. Just as important, though, for a smart city’s transportation system is the ever-growing network of hundreds of millions of GPS-enabled smartphones. Those mobile devices aren’t just providing travelers with maps, turn-by-turn directions, and the occasional restaurant review. They’re also populating the network itself with information about the phone users’ location and speed. The data they send up the line is why the information that returns—when your bus will arrive, for example—is ever more precise and useful. Better data in, better data out. The city of Dallas and the US Department of Transportation have built what they’ve named the “511DFW system,” essentially a public website, a phone-enabled travel line, and an Interactive Voice Response system that consolidates sensor data, smartphone GPS signals, and real-time information on road closures and collisions, to guide users to optimal routes by any combination of travel modes.
Lots of similar systems are the creations of public transportation systems themselves. Some are general, others very specific. The French national rail company, SNCF, uses a sophisticated algorithm to predict, based on time of year, weather, disruptions, and so on, how many people are likely to be traveling on any particular train, up to providing an estimate of the likelihood of getting a seat, and on which car. SFpark, a project of the San Francisco Municipal Transportation Authority, uses sensor data from parking meters to offer real-time information about available parking, a nontrivial aspect of transportation management, since, at any given time, 30 to 50 percent of the VIM in a city consists of drivers looking for parking spaces.
Not all the information permeating the system is created by public agencies, or even by private companies using public data. The private software-and-data company INRIX collects trillions of bytes of information from nearly two hundred million smartphones and other mobile devices (like fleet vehicles with GPS locators), analyzes it, and sends it out in the form of real-time traffic information to, among others, Google Maps and the navigation device manufacturer TomTom. A thousand different ways to smarten up transportation systems are already in operation, and ten thousand more are probably gestating in the brains of software designers and app builders.
Data, algorithms, and smartness are the missing ingredients required for building a new kind of transportation network. Without them, the best-designed multimodal transportation network imaginable, one with precisely the right number of routes through exactly the right neighborhoods, one with high density and well-designed walking paths and safe roads, one with the most diversified and comfortable assortment of trains, streetcars, buses, cabs, and private automobiles, is still deficient. Remember those two classes of travelers in our hypothetical transit hub? The ones who were comfortable with the system and, well, the other ones? What separated the two wasn’t native intelligence but familiarity, which is really just another word for easily accessible data. Linking those thirty-two satellites to a billion (and counting) smartphones is the key ingredient putting the “smart” into Street Smart.
The impact of this is already enormous, and its potential is even greater. It’s more than encouraging tourists to take subways and buses when visiting new cities. It’s more than supplying transportation departments with the ability to balance supply and demand for mobility in real time, and definitely a lot more than enabling thousands of Uber and Lyft drivers to race one another to the same traveler standing on the same corner. The real value of pouring all that information into the system is that it gives the same sense of autonomy to transit users as the old system did to automobile drivers. This, as we’ll see, is critical. Though easy-to-access information is, indeed, the missing ingredient for a modern multimodal transportation network, such a network still won’t survive long-term unless it attracts the widest possible customer base. A Street Smart system needs to be useful.
![]()
a In case you’ve forgotten all that spherical geometry you studied back in high school, here’s the reason four satellites are needed: Each signal is deciphered by a satellite as the surface of an imaginary sphere. When two spheres overlap, they intersect as a circle; when that circle intersects a third sphere, it does so at two points. The fourth signal, the final sphere, eliminates one of those points, leaving the actual position.
b And biking. Salt Lake City is in the process of building eighty-seven miles of bike paths.
c According to Hal Johnson, UTA’s manager of Project Development, campus parking—ten thousand total spaces—was at 96 percent capacity in the fall of 2001. By 2013, that had dropped to 70 percent, entirely because of the number of students using the University Line.
d At Uber, ridesharing—people traveling from roughly the same origin to about the same destination, while splitting the cost of the trip at a discount—is rare enough that it has its own name: uberPOOL.
e Lyft, the Avis to Uber’s Hertz, operates in a third as many markets.
f I’m considering trademarking the term: Total gridlock™.
g If you’re thinking that creative industry is another Humpty Dumpty phrase, you’re right.
h One quintillion bytes. And, yes, I had to look it up.