CHAPTER 3
More of the Same Is Just More of the Same
It would be nice (and easy) if the goal of universal education could be met in the same way as the goal of universal schooling: apply more of the same, and eventually children will be equipped for the twenty-first century. If this were so, then the same coalition of advocacy, altruism, and self-interest could segue from a schooling goal, like the Millennium Development Goal, to learning and education goals without innovation, disruption, or change from the existing “access axis,” which has been successful in putting together a powerful coalition for expanding schooling. But a wish is not a plan, much less a plan grounded in evidence about what “more of the same” would actually achieve. In this chapter I marshal evidence to show four things:
If their current pace of progress remains unchanged, most developing countries will take centuries to reach acceptable levels of student learning.
No developing country has an evidence-based plan for achieving significant progress in education. Nearly all countries have plans to spend more on inputs and will call that “quality,” but none has a plan for increasing student capabilities.
Copying the educational fads of rich countries will not work: the pedagogical and educational problems of developing countries are entirely different from those of more developed countries.
System change and the diffusion of innovations, rather than just more of existing inputs, are needed to meet education or learning goals.
This is not to say that inputs cannot affect learning in developing countries; they do. But replicating or augmenting the external trappings of good schools does not make a good school. Without the animating drive that is at the heart of any functional school, adding more of one or another input won't make much difference. This is the lesson of Frankenstein: while most people have two arms, stitching arms on a cadaver does not make a living person; conversely, people can lose an arm and still be functional. Appearances can be forced from outside, but performance is driven from within.
The Current Pace of Learning Progress in Developing Countries Is Slow
Chapter 1 documented the magnitude of low learning in developing countries. But, it may be argued, although things are bad now, perhaps they are getting better. Perhaps the same “business as usual” approach that successfully expanded enrollments will also, just left to its own devices, lead to better learning outcomes.
Data that track learning over time are difficult to come by. However, the ASER data for India have been collected for the last seven years, and cross-country international assessments like PISA and TIMSS and SACMEQ test the same concepts with the same age or grade cohorts over time. All of these tell the same story: progress in the measured learning of children is often negative, and even when it is positive, the pace of progress is typically very slow. Only a very few countries show rapid progress. Extrapolating current trends shows that it will take anywhere from “forever” (for countries going backward) to a century or more for countries to reach minimally adequate levels of capability in basic literacy and numeracy.
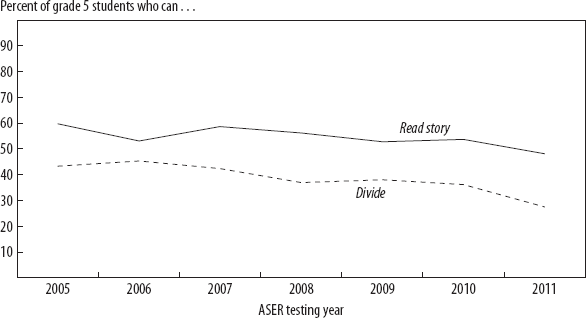
ASER in India has been testing almost a half a million children a year since 2005. As figure 3-1 shows, things are getting worse. The percentage of grade five students who cannot read a story at the grade two level has been rising over the past seven years. The fraction of students in grade five who cannot do division has stayed the same or gone up over the past seven years. Obviously, if progress is retrogress, it will take forever to reach learning targets.
Figure 3-1. India's progress is retrogressive: more and more children cannot read a story or do division, even as they reach grade 5.
Source: Author's calculations with Barro-Lee data on years of schooling, POLITY IV for Democracy-Autocracy, ICRG for Control of Corruption, and Freedom House for Civil Liberties (see Data Sources).
Perhaps India is an exception. So we might ask, what is the pace of learning outside India? The easiest way to examine progress over time is to measure it using a student standard deviation or an international assessment (from PISA- or TIMSS-like instruments) student standard deviation (IASSD) because these normed scores are at least somewhat comparable across countries and time. On PISA and TIMSS, scores are normed so that the IASSD is 100 points for OECD students on a 500-point scale. As we saw in chapter 1, nearly all developing countries, including many middle-income countries, would need to gain at least 100 and sometimes 200 or more international assessment points to achieve the OECD learning level of 500.
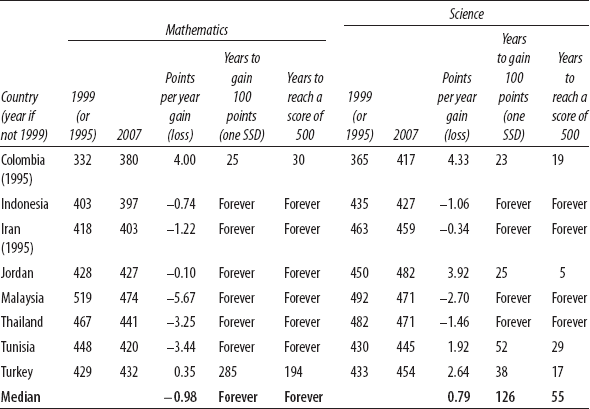
Eight developing countries participated in the TIMSS mathematics and science assessment in either 1995 or 1999 and 2007. This amounts to only twelve (or eight) years of data, but it provides some sense of the direction and magnitude of change. In six of the eight countries, mathematics scores fell between the first available year, either 1995 or 1999, and 2007. In some countries, such as Jordan and Indonesia, the fall was a small amount, but in some scores fell by more than 20 points (Thailand, Tunisia, and Malaysia). Intriguingly, in science, there were more countries with improvement, but learning fell in half the countries.
Table 3-1. Progress in learning achievement of grade 8 students on the TIMSS is slow (or moving backward) in many countries.
Source: Pritchett and Beatty (2012). Data from National Center for Education Statistics (http://nces.ed.gov/surveys/international/table-library.asp).
If mathematics capability in your country is moving at the typical pace observed in the countries that participated in the TIMSS, then your average score is falling by about one point per year (table 3-1). At that rate, your students will never catch up, and your country is falling further and further behind. At the pace of the median country's progress in science, with a gain of 0.79 points per year, a country would take 126 years to gain 100 points (or one IASSD). If your child is average, at 400, then perhaps her great-great-great-great grandchild will reach OECD levels of learning.
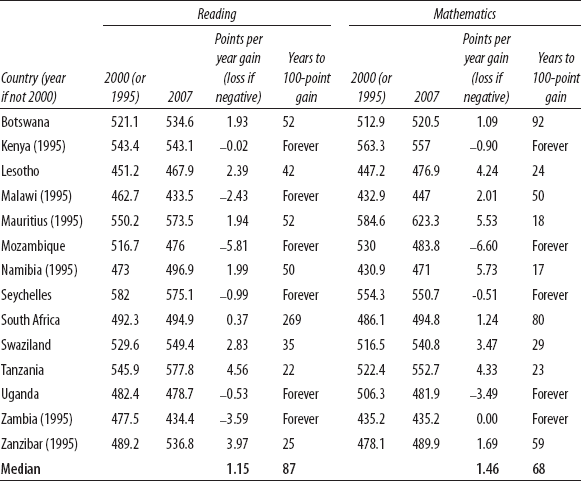
We used data from fourteen countries or regions in eastern and southern Africa that have been participating in regional mathematics and reading tests, the SACMEQ (Southern and Eastern Africa Consortium for Measuring Educational Quality), since either 1995 or 2000.1 These tests are different from PISA or TIMSS in that they assess students earlier, in sixth grade, but are similar in that they are normed for the participating countries to have a mean of 500 and a student standard deviation of 100 (and hence these scores are not comparable in levels to PISA scores, as a SACMEQ score of 500 is just a regional norm; countries that have participated in both SACMEQ and PISA have PISA scores 100 to 200 points below the PISA norm of 500). Using these assessment data, we can make similar calculations and standardize the results to make comparative statements about the pace of progress.
In mathematics, at the current observed pace, it would take the fourteen African countries sixty-eight years to gain 100 points, and in reading it would take eighty-seven years. This means it would take three to four generations just to increase learning by one student standard deviation—and this would leave many countries still far from OECD levels in these subjects. In six of the fourteen countries the trend was negative in reading and in five countries it was negative in mathematics (table 3-2).
Alternatively, comparing the PISA results for reading from 2000 to 2009 for the nine countries with comparable reading scores yields a modestly more optimistic picture (Pritchett and Beatty 2012). The estimate is a 1.7-point gain per year, and hence only fifty-seven years are needed to gain 100 points. (For math, it would take 47 years.) Thus, if a child going to school now at age six has a child at age twenty-five, who has a child at age twenty-five, in most countries the great-grandchildren will be at OECD levels of capability when they reach age fifteen in the year 2071. And that is the most optimistic of scenarios.
Of course, this simple comparison over time of those who are tested (who may be in different grades or of different ages, according to the different assessments) mixes both changes in learning and changes in the composition of those tested. Part of the slow pace of learning may result from the influx of less learning-ready students attending school for the first time, which would mask underlying progress.
In some cases the deterioration in learning is so great that even though more students are in school, absolutely fewer students are at an acceptable level of performance. For instance, Tanzania has had a massive increase in secondary school attendance and hence a massive increase in the number of students taking the Central Secondary Education Examination (CSEE) in the mandatory subjects; that number increased by 180,000 students from 2008 to 2011. However, the proportion of students scoring a grade of C or higher fell so fast that in five subjects—Kiswahili, English, history, geography, and chemistry—the absolute number of students passing fell. The number taking the CSEE exam in Kiswahili increased from 155,000 to 339,000—about 185,000 more students sat for the exam in 2011 than in 2008. The number passing with a grade of C or higher fell from 65,000 to 27,000 as the pass rate fell from 41 percent to 7.8 percent in just four years. Had the pass rate stayed constant, the number passing would have risen by 80,000, instead of falling by 27,000 (see figure 2-8 on page 87).
Table 3-2. Gains in reading and mathematics in southern and eastern Africa show several generations (68 to 87 years) would be needed to make 100-point gains in assessed learning.
Source: Pritchett and Beatty (2012). Data from SACMEQ.
All Countries Plan to Improve “School Quality,” but No Country Has an Evidence-Based Plan to Improve Learning
To expand enrollments, education systems needed more schools, more inputs, and more teachers. So the natural extension would be that to improve the quality of schooling, systems need better schools—where “better” is defined as having more infrastructure (for example, more space, more rooms, playgrounds, toilets for students), more inputs (more chalk, more learning materials, more textbooks), more teachers (leading to smaller teacher-to-pupil ratios), and more formal qualifications and training of teachers (more years of pre-service training, more time in in-service training). This redefinition of quality from learning outcome to inputs is supremely convenient as it reduces the task to the logistics of expanding inputs.
A common component of school quality improvement, one that illustrates the typical approach of existing top-down bureaucratic spider systems, has been to create education management information systems (EMIS) to create and centralize information about schools. If the system's goal is to improve input quality (such as adding buildings, toilets, classrooms, books, desks, trained teachers, better teacher-pupil ratios), then EMIS can track these ingredients, school by school, in real (or at least realistic) time. This approach sees only the “EMIS-visible” information—those aspects of classrooms, schools, and teachers that can be coded into bits and bytes.2 This is not to say that learning progress cannot be quantified and tracked, or become “visible” through an EMIS. But EMIS reduces schools and learning to “thin” criteria that can be tracked and “seen” by a spider bureaucracy. These cannot cope with the reality of the “thick” experience of actual learning. EMIS goes hand-in-hand with an input-oriented approach to progress in education.
The logic of these “quality” improvements is circular and hence internally unassailable. Progress is defined as schools having more inputs, and success is reached when every school is a “quality” school. Thus, school quality is achieved when the EMIS shows that schools have adequate infrastructure, teachers and inputs. Success is guaranteed when funds are available because budget improvements lead to measured input improvements. Alternatively, when funds are not available, the EMIS documents the magnitude of the so-called quality deficit and hence the need for more education funding.
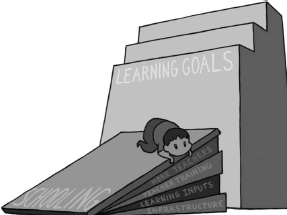
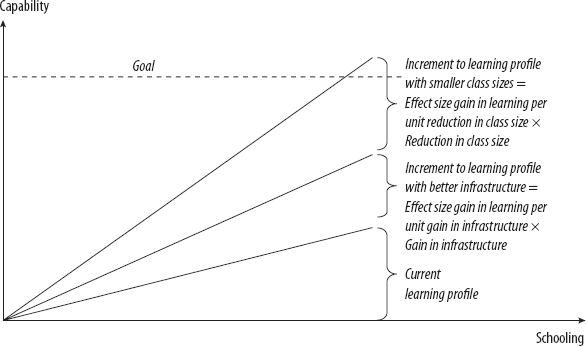
Suppose the input-oriented, EMIS-visible agenda were successful. How much closer would a country be to meeting learning outcome goals? Following the imagery introduced in chapter 1, we can think of a learning profile as a ramp that students walk up as they increase their capabilities through schooling. Improving learning entails steepening the ramp. Metaphorically, the EMIS approach steepens the ramp by adding input wedges under the ramp: more books, smaller class sizes, or more trained teachers.
How much steeper does the ramp need to be? If developing countries want to reach anything like developed countries’ levels of learning achievement, the learning profile needs to be dramatically steeper. The number of wedges needed to raise the learning profile depends on the size of each wedge. How thick are the wedges? Suppose we divide the quality improvements into four EMIS-visible input-oriented wedges:
— Physical infrastructure of the school and classroom, or such things as walls, windows, a leak-proof roof, classrooms, toilet facilities (including separate facilities for girls), desks, chalkboards, and so forth.
— Learning inputs, ranging from simple needs like chalk and pencils, paper, workbooks, textbooks, and learning activity materials to more sophisticated inputs like materials for science demonstrations or experiments to computers.
— Formal teacher qualifications and training, including any variety of general level of education, pre-service training for teaching, and in-service training.
— Teacher-pupil ratio, which is related to available teacher time per pupil.
The thickness of each wedge is the simple product of two features. The wedge's size is in part determined by the effect size, which is the impact of the intervention—better buildings, more textbooks, smaller class sizes, more trained teachers—on the learning outcome, measured in student standard deviation units. So, think of two equivalent students finishing eight years of basic education, one of whom in each year had a trained teacher and one who never had a trained teacher. The wedge size would correspond to the differing learning outcomes as a result of being consistently exposed to trained teachers (or smaller class sizes, or classrooms with chalk, and so on).
The second determinant of wedge size is the scope for expanding the input. Often there is an upper limit either to usefulness of the input or to the range over which the input has meaningful impact. It is plausible that moving from no available textbooks to shared textbooks could improve performance, as would perhaps moving from shared textbooks to one textbook per student. But almost no one expects any additional learning impact from each student having his or her own textbook to each student having two of the same textbook. So the scope for learning gains from textbook provision is from none to one per student. Other inputs also have a natural upper limit. Having a leaky roof might inhibit learning, but once the roof doesn't leak, better and better roofs likely won't improve learning outcomes. Limits on the achievable scope also come from practical considerations such as cost. For example, class sizes could affordably be reduced from forty to thirty, but perhaps not from forty to twelve.
Let's take a simple illustration of a quality (in the above sense) improvement's effect on ramp height or the learning profile. Suppose the cumulative (by say, grade nine) effect size of a child's being exposed to a trained versus untrained teacher in each year of schooling is 0.2 (effect sizes mean the magnitude is expressed in student standard deviation units). What is the feasible gain to the average student from training teachers? If, say, 70 percent of teachers are already trained (and hence 70 percent of students are already exposed to trained teachers), then the additional gain from having teachers universally trained is exposing 30 percent of students to trained teachers. So the gain is a 0.2 effect size for each student exposed times the 0.3 students newly exposed to trained teachers, which means the increase in the average would be 0.2 × 0.3 = 0.06. Hence, in this super-simple and simplistic example, the gain from having all students taught by trained teachers would equate to a wedge height gain of 0.06 effect sizes toward the goal of increasing one effect size (one student standard deviation) in learning.
An evidence-based plan for achieving any learning goal based on EMIS-visible input expansion would have three parts:
— Goals, defined as student domain skills or competencies or capabilities or functioning (which could be anything from basic literacy to working in teams to thinking creatively and need not be assessed with a standardized examination; they could require sophisticated assessment tools) where each goal is described in terms of the distribution of student performance, such as the fraction of students above a certain minimal level, the performance of the average student, or reaching an ideal level.
— Effect sizes of EMIS-visible inputs based on a fair reading of the best available empirical evidence.
— Budgetary and logistically achievable targets for the expansion of the inputs that would reach the specified learning goals.
Figure 3-2. An evidence-based, EMIS-visible plan for achieving learning goals based on improving “quality,” or expanding inputs, is lacking everywhere.
An example of an evidence-based input expansion plan is illustrated in figure 3-2. The goal is to improve mean student mathematics performance. The effect size target is 100 points, or one IASSD, to be derived from a reduction in class size and infrastructure expansion, accompanied by an implementation plan involving sufficient budget and capacity to execute. To be justified in terms of outcomes, an input plan must lay out the causal linkage (which has a magnitude) between the inputs and the outcomes.
No developing country in the world has an evidence-based plan for accomplishing any significant learning objectives through expanding EMIS-visible inputs.
I am not advocating the mechanistic, input-expansion approach described here; indeed, a major purpose of the entire book is to argue against this type of mechanistic input-output approach to education. With this illustration I am just making explicit the often hidden logic of the predominant current strategy to improve educational outcomes. The call to expand inputs—more toilets, more books, more teacher training—is never done for its own sake but with the often implicit claim that inputs will lead to better outcomes for students. This is not to say countries don't have plans to expand inputs. But plans to expand inputs lack one or more of the features that would make for a real plan for education.
First, very few countries have any articulated and measurable goals—that is, clear statements of the magnitude of the improvement in learning objectives that will be achieved by its plans for input expansion. Rather, nearly all plans are circular: quality will be improved when inputs are expanded because inputs are quality.
Second, no country has a plan that links plans for input expansion to learning objectives based on any evidence about effect sizes. While learning objectives may be mentioned, their magnitudes are not quantified. If you are a kilometer from your goal, it is critical to know whether your planned steps will move you closer by one centimeter, one meter, or a hundred meters. So, while some countries might pay some attention to evidence of which inputs are effective in moving some positive distance, none pays attention to magnitudes.
So far, countries do not have evidence-based plans to meet ambitious learning goals. It is not that they have “bad” or “wrong” or “inadequate” plans, they lack anything that even minimally qualifies as this type of plan. Which is not to say education ministries lack plans. Plans they have. They have plans for expanding schooling. They have plans for expanding inputs. They have plans for spending money. They have plans for training teachers. And it is not as if they don't have objectives. Objectives they have. What they don't have is (1) plans that link expanded schooling and input expansion to educational achievement, or, more important, (2) any kind of evidence-based plan for increasing the learning profile of students to meet specific and adequately ambitious learning goals.
The Learning Gap Cannot Be Filled with Inputs
Why does no country have an evidence-based, EMIS-visible input-based plan to meet learning goals? Because they can't have one. There is a fundamental contradiction between the best available evidence, which suggests input-based gains are small, and the need, which shows the learning gains to achieve adequate education are large.
Figure 3-3. Will expanding inputs be enough to meet learning goals?
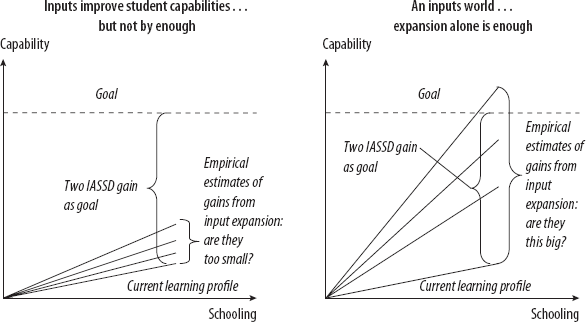
The key question is, are the wedges produced from expanding EMIS-visible inputs just too thin to add up to any meaningful change in the steepness of a learning profile (illustrated on the left side of figure 3-3), or will input expansion be roughly sufficient to achieve learning goals (the right side of figure 3-3)?
No country has an evidence-based plan for expanding EMIS-visible inputs to meet learning goals because the weight of the evidence—from literally thousands of empirical studies—suggests that achieving learning goals through input expansion alone, without increases in the efficacy with which all inputs are used, is impossible. The input wedges are just too thin. I do not claim that inputs make no difference, or that a viable, learning-oriented plan will not involve the expansion of inputs. But the overwhelming bulk of the empirical evidence suggests input expansion, at the current level of efficacy in actual use, could constitute only a small part of countries’ progress toward meaningful learning goals. Input-oriented plans alone cannot produce anything like the one or two IASSD gains that countries need for their students to be equipped for the twenty-first century. To illustrate this point, I draw on three literatures:
— Studies that compare student learning across schools with different levels of inputs
— Studies that compare learning achievement and expenditures
— Studies that track the evolution of learning achievement performance over long periods
Education Production Functions: Thin Wedges Do Not Add Up to a Steep Ramp
There is a massive literature investigating the links between educational inputs and learning achievement with literally thousands of studies.3 These studies have compared learning performance and exposure to inputs across students, across schools, across districts, across states or provinces within countries, and across countries. Many of these studies use nonexperimental data and statistical procedures to try to eke out the causal effects of inputs, all else equal. This is what I call the “education production function” literature. I start with this literature because it has the elements to put together an evidence-based, input-driven learning plan because these studies look at the association of lots of different inputs in the same study. (More recently, randomized experiments have been very popular, and I will come back to them, but they tend to focus on one or at best a few inputs at a time.)
All these studies seek to compare the learning achievement of students over time, looking at some portion of the learning profile, either by tracking the same students as they progress in school (which is rare) or by comparing student achievement at a point in time.4 The learning profile for any given student might be steeper if the student is in a learning environment with more inputs. How big are these effects? Are they big enough such that EMIS-visible input expansion or “more of the same” could steepen learning profiles enough to meet learning goals? How much higher could a student's cumulative mastery be from exposure to more inputs?
Any estimate of how schools or school inputs affect learning must account for other factors that affect student outcomes, such as family background, motivation, and innate abilities. One can only estimate the incremental impact of schools or inputs on a child's learning “all else equal.” Nearly all empirical studies find that the “all else” about students matters, a lot. The single most consistent empirical finding in the education production function literature is that student performance differs enormously, even among children with nearly identical schooling experiences, and that differences in performance are robustly associated with student and parental background characteristics. It should surprise no one that children of better-off, better-educated, and more achievement-oriented parents tend to perform better in school. This is important to keep in mind as, if these student background characteristics matter (and they do), and students with similar background characteristics tend to cluster in schools (and they do, either because of patterns of residence or because of school choice), then there will be large differences in the observed performance of schools that have nothing to do with the school's causal impact on student performance. Moreover, to no one's surprise, schools with students with rich and well-educated parents tend to be schools with lots of inputs, and hence the naïve association will show that schools with good inputs have good learning outcomes—but this association reveals nothing about what would happen if inputs were expanded.
I use three examples that are typical of the massive existing education production function literature to show the limits to the gains achievable from expanding inputs. The first example is a study from Jamaica that did a careful job of measuring not just EMIS-visible inputs but also pedagogical practices, school organization, and community involvement (Glewwe et al. 1995). The study included fourteen EMIS-visible components, including school facilities, the availability of instructional materials, student-teacher ratios, teacher qualifications and training, and school-level pedagogical inputs, each of which is an element of most plans for school improvement,
In examining mathematics, the authors found that seven associations were positive and seven negative—exactly what one would expect from pure chance. For reading achievement, the effects of eight inputs were positive, the effects of six were negative, and only one was statistically significant (at the 5 percent level).5 Moreover, the effect sizes even for many of the variables that were statistically significant were small, as the very largest was 0.2.
Figure 3-4. Empirical estimates of the maximum possible gain from EMIS-visible input improvements on learning is small: four examples.
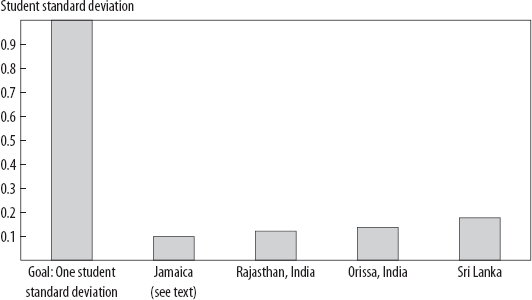
Source: Author's calculations, based on work cited in the text. The spreadsheet is available at cgdev.org/rebirth-of-education.
Finally, the scope for expanding or enhancing the inputs that were positively associated with learning was limited. For example, the study estimated that textbooks arriving two months later than when they were needed was associated with less learning, in both math and reading. However, this creates the possibility of a one-off improvement to deliver textbooks on time, not something that could be continuously improved to reach higher and higher achievement. Similarly, the number of students with desks had a big effect size of .2—but has a maximum of 100 percent—and 85 percent of students already had desks. So the maximum gain—the effect size times the scope—from moving to the best possible scenario (100 percent of students with desks) is about one-tenth of one standard deviation for reading, and even less for mathematics (figure 3-4).
What if we used these empirical results from this study to achieve an EMIS-visible input fantasy, that all of the inputs achieved their best possible values? What if all teachers had diplomas, all teachers had undergone training in the last three years, all students had desks, the class size was twenty-five, all schools had reliable electrical services, all textbooks arrived on time—everything was done? How much of a one standard deviation gain (on this particular test) in math and reading (averaged) would the input expansion produce? The optimistic estimate is that this EMIS-visible fantasy input expansion would produce about one-tenth of one student standard deviation.6 So a massive program of input expansion, which would be fiscally very costly and would likely take a decade to achieve, would be (generously) predicted to have an impact of 0.1 student standard deviation.
A second example in the education production function literature is a Sri Lankan study that measured learning achievement of grade four students in mathematics, English, and the child's first language (Aturupane, Glewwe, and Wisniewski 2006). The study collected student performance data, detailed information about children's backgrounds (such as parents’ education, resources in the home, and participation in private tutoring), and data on a rich array of variables intended to measure school quality, including infrastructure, teacher training, characteristics of teachers and principals, and so forth. In total, thirty-five inputs were measured.7
The authors used standard statistical techniques to estimate the association between the three learning achievement measures (math, English, first language) and child-, household-, and school-level variables. Nearly all inputs were dismissed in one telling sentence: “Variables with no explanatory power in any of the tests are dropped.” Of the thirty-five input variables, twenty-eight were never statistically significant in any specification for any learning measure (not math, not English, nor first language). Only one-fifth (seven of thirty-five) of the EMIS-visible inputs had any demonstrable association with any learning outcome, and the magnitude of the effect sizes was empirically tiny (and inconsistent in sign). As with the Jamaica study, even where there were strong associations, the available scope for expanding the input was modest. The school characteristic with the largest impact was all students having adequate desks (the analysis used either a zero or a one for each school). Providing adequate desks to all schools would (if the effect were causal) add 8.1 points to student scores, so the effect size is substantial. But there was a limited scope for desks to improve performance, as 58 percent of schools already had adequate desks. The gain from moving to 100 percent of schools is 8.1 × 0.42 = 3.4, which is good, but we are looking for a gain of 100 points, so this will at best get only a tiny part of the way.
Again we calculate the EMIS-visible input fantasy plan—that each of the seven statistically significant input variables was expanded to its maximally feasible scope. What is the gain? (And keep in mind this is already biased by the exclusion of the variables that were not statistically significant, as some of those might have been positive, some negative). The total gain is 0.18, which is undeniably something, but also undeniably not anywhere near 1.
What are the plausible upside possibilities and downside risks of an input expansion given the imprecision with which the impact of each input is measured? If each of the input impacts were one standard error below the point estimate, then the total possible scope for input expansion would be 0.03 (almost nothing). Alternatively, if the impact of every variable were larger than the point estimates, then even the maximum possible EMIS-visible expansion (at a uniformly optimistic assumption about impact) produces only about one-third of one student standard deviation.
To illustrate the third type of education production function research, I use studies from two Indian states, Rajasthan and Orissa, that examined the connection between learning achievement and the standard inputs such as teacher salary, teacher qualifications, teacher training, class size, and whether schools have multigrade teachers. Setting up the same thought experiment with the maximally feasible expansion of these inputs—that is, giving each grade a dedicated teacher with ten fewer students in each class, and with all teachers having degrees—I found total gains from 0.12 to 0.13 student standard deviations. Again, the combination of all possible input enhancements is nowhere near 1 (see figure 3-4).
These are just four specific studies in four specific regions, but I could do calculations like this all day (see my review of this literature in Pritchett 2004). These studies are typical of an enormous education production function literature. I encourage interested readers to do this too. The book's website (cgdev.org/rebirth-of-education) provides the spreadsheets used for these calculations and a template that can be used with any empirical study desired (www.cgdev.org/rebirth-of-education). One need only enter the effect size and the scope, then multiply and sum, and the total gain is given.
One very difficult technical issue is how to treat these estimates of the impact of inputs on students’ scores in a particular year, either as the cumulative impacts from exposure to the school, and associated inputs up to the point the student is now (such as grade five or grade eight), or as just representing the gain from one year of exposure to the particular level of inputs. In the latter case, one could imagine multiplying the effect size by the number of years of school, since the gains could be replicated in each year. However, there are good arguments that when students are tested in grade five and the results are associated with school effects, this already estimates the cumulative effect, whereas some of the classroom-specific effects could represent the impact of just that classroom exposure (and hence might be multiplied by five in calculating the potential total gain). On the other hand, the recent literature on the “depreciation” of one year of exposure with respect to long-run learning gains suggests that the long-run impact of one year of exposure is very much smaller than the one-year impact coefficient (for example, while being in a small class in grade three might raise learning in grade three, this learning gain mostly evaporates in grades four and five). With high levels of depreciation, the one-year gains would have to be sustained in each year for the one-year effects to be cumulative. In the calculations above I treat the reported estimates as representing cumulative gains.
Beware of evidence-based plans using cherry-picked estimates. There are many technical issues with estimating the causal impacts of inputs on student learning, and hence for many researchers, education production functions are out of style. However, the alternatives run the risk of cherry-picking the data to produce the results one hopes to derive.
First, using all the estimates from the same study (for example, in Sri Lanka or in Jamaica or in India) prevents someone from scouring the existing literature (which consists of literally thousands of studies) and picking the largest-ever reported effect size for books, the largest-ever effect size for class size, and the largest-ever effect size for teacher training, and then producing an “evidence-based” plan on those estimates. The danger is that publication bias (in all its many forms) already actively promotes a certain amount of cherry picking, so basing plans on selective reviews of an already selective literature can be massively biased.
Second, the fashion for relying only on “rigorous” estimates of causal impacts based on randomized (or well-identified by natural experiments) studies is not really an alternative, for three reasons. One, there are just too many inputs for which there are no randomized (or even rigorous studies). Two, the external validity problems are insurmountable—already there are rigorous estimates of the causal impact of class size that span the range from zero to quite large, so the hope that more “rigorous” methods will produce more consensus estimates has already evaporated (Pritchett and Sandefur 2013). Three, it is extremely unlikely that randomization will, on average, produce bigger estimates than the nonexperimental literature. The bias from nonexperimental evidence can go either way and make the nonexperimental effect size estimates either too large or too small. The most recent review of the literature (Glewwe et al. 2011) suggests that the more rigorous the method, the less likely it is that a study provides support for a large causal impact of inputs, which is most researchers’ intuition.8
How Much Will Meeting Learning Goals Cost? All You Have—or Nothing at All
Evidence as to the futility of just adding more of the same inputs also comes from studies that compare budgets. The link between evidence about inputs and evidence about budgets takes a bit of arithmetic and a few definitions, but is worth pursuing. To make the arithmetic easy, I'll assume a linear relationship between learning outcomes and the four types of EMIS-visible inputs: infrastructure (IF), learning inputs (IP), teacher training and qualifications (TTQ), and teacher-to-pupil ratios (TPR), so that the expected learning outcome (L) gain (of “plan” over “base case”) from a plan of expansion of these inputs is given by:
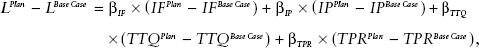
where the β values for each input are scaled in effect sizes.
The cost of this plan is just the sum of the cost of expanding each type of input, which is just the magnitude of the change in each input times the unit cost (UC) of the input. This expression is simplified using just four aggregates, but it can be built up from the educational plan that specifies each input and its cost:
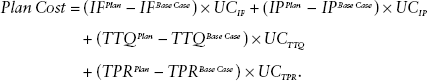
Two ratios make things clear. The cost-effectiveness of a given input is just the ratio of its effect size to its unit cost, or how much it costs to achieve learning through the expansion of that input:
The second is just the share of the total cost that is devoted to any given input:
The overall cost-effectiveness—or learning gain per additional expenditure for an input-driven plan—is just the sum of the cost-effectiveness times the cost share of each input. Put differently, cost-effectiveness is the cost-share-weighted average of the cost-effectiveness of each input:

These few simple equations allow us to link the literature on education production functions, which connects inputs and the learning outcomes of various inputs, with the also voluminous literature that relates spending per student to learning outcomes.
From this simple equation we already know two things to expect from this literature on the association between spending and learning outcomes: first, anything can happen from increasing spending, and second, mostly nothing does.
Anything can happen in associating learning outcomes and expenditures across jurisdictions (schools, districts, states or provinces, countries) or in the same jurisdictions over time. Anything can happen because estimates of the relationship between budgets and outcomes are just recovering some mix of the underlying cost-effectiveness. As table 3-3 elucidates, this means that if the incremental spending is on cost-effective inputs, then spending can have a big impact on outcomes, whereas if the incremental spending falls on inputs that are not cost-effective, then it will have no association with learning.
Table 3-3. How to understand associations between learning outcomes and spending: anything could happen…
| What could happen | Empirical result | Relation to underlying inputs and outcomes |
| Some schools face higher prices for inputs, but all schools use the same inputs. | No association between spending and outcomes is discernible. | Higher-spending schools are less cost-effective on average because unit costs are higher. |
| Higher-spending schools spend incrementally more on highly cost-effective inputs. | Higher spending is associated with higher learning achievement. | The composition of spending (cost shares) is better in higher-performing schools. |
| Higher-spending schools spend more on inputs with zero or small cost-effectiveness (at the same unit costs). | Higher spending is only weakly associated with higher learning achievement. | The composition of spending by cost-effectiveness is worse in higher-spending schools. |
| Cost-effectiveness is high across all inputs. | Higher spending is strongly associated with learning outcomes. | The composition of spending doesn't matter (much) because all inputs have high cost-effectiveness. |
| …but mostly nothing does. | ||
| Cost-effectiveness of most inputs (at existing levels of utilization and efficiency) is low | Higher spending is only weakly associated with learning outcomes. | The composition doesn't matter (much) because either (1) nearly all inputs have low cost-effectiveness at the overall effectiveness with which resources are used or (2) most resources are spent on expanding inputs with low cost-effectiveness. |
But mostly nothing does. A massive literature exists comparing levels of learning achievement and spending per pupil at many different levels—across countries, states or provinces within countries, smaller jurisdictions, and schools. And there is a literature comparing performance at these different levels over time. The finding, again and again, is that resources per se have little to no statistically significant impact on measured learning outcomes. But as with the impact of inputs, the question is not statistical significance but the size: how much can spending do?
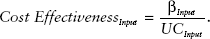
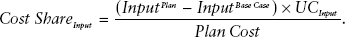
Figure 3-5. Even if Mexico increased spending fivefold, it would not be predicted to attain OECD learning levels.
Source: Author's calculations, based on PISA 2009 (OECD 2010) data.
While there are many sophisticated ways of attempting to use cross-national data to tease out the impact of resource expansion, the basic data tell the big-picture story: countries have exactly the same measured learning results with very different levels of spending. And countries have very different learning outcomes with exactly the same level of spending. Figure 3-5 shows PISA 2009 results (averaged across all three domains, math, science, and reading) and cumulative educational spending on a child from age six to age fifteen (in comparable purchasing power parity, or PPP, units). It doesn't take any fancy statistical procedures to see that the United States spends PPP $105,000 per child and Poland spends PPP $39,000, and they get nearly the same results. Conversely, Spain spends PPP $74,000 and Finland spends slightly less, PPP $71,000, yet Finland outperforms Spain by 50 points (half a student standard deviation).
Suppose we estimate the simple bivariate association between spending and these measured learning outcomes using OECD data (excluding Mexico, since I do the thought experiment for Mexico) and ask, if Mexico's learning outcomes were to increase with spending in exactly the same pattern as learning is associated with spending across the other OECD countries, how much spending would it take to reach an OECD-based learning goal? Not surprisingly, Mexico will never reach such a learning goal through spending alone. The score gap between Mexico and other OECD countries is 75 points (425 versus 500), and each $10,000 of cumulative student spending is associated with 2.2 additional PISA points. So an amazingly large increase in spending—say, a 50 percent increase from Mexico's base of PPP $21,000—would lead to a gain of two points. Suppose Mexico were to double spending from PPP $21,000 to PPP $42,000—which would entail massive fiscal costs—the estimated gain would be 4.6 points. Even in the absurd scenario that Mexico reached U.S. levels of spending, five times Mexico's current spending level, the predicted impact is still only 14 points of the 75-point gap.
Extending this analysis beyond the OECD, and comparing other countries around the world, I find the same pattern—countries with the same performance at very different levels of spending, and conversely, countries with very different performance at the same levels of spending. The overall learning outcomes-to-resources relationship is weak. Figure 3-5 uses the cognitive skills estimates that Hanushek and Woessmann (2009) produced using all available, internationally comparable assessments and compares them with UN data on education spending as a fraction of GDP. Brazil's cognitive skills estimate is 364 and Korea's is 540, or 176 points higher, but both spend roughly the same fraction of GDP on education.
Suppose this cross-national pattern revealed the typical path a country would take if it expanded spending. Suppose Brazil expanded from its current levels of spending and reached the highest level of spending as a fraction of GDP in the world (that of Denmark, which spends more than 8 percent of GDP on education). This would increase Brazil's performance by only about 21 points, which would still leave Brazil 115 points below the OECD norm (figure 3-6). Remembering that the relationship between spending and learning is statistically weak, let's suppose, for argument's sake, the estimate of the association is one standard error larger, meaning we were optimistic about the impact of spending expansion. Even if Brazil were the world's highest-spending country and the impact of this additional spending were at the high end of the range consistent with cross-national patterns, this would still get Brazil only to 406 points, still almost one full IASSD below the OECD average. Conversely, at the low end of the range of the association, doubling spending as a fraction of GDP would gain Brazil only one point.
Figure 3-6. If Brazil increased education spending as a fraction of GDP to Denmark's spending levels, Brazil would still not increase learning enough to achieve an OECD average.
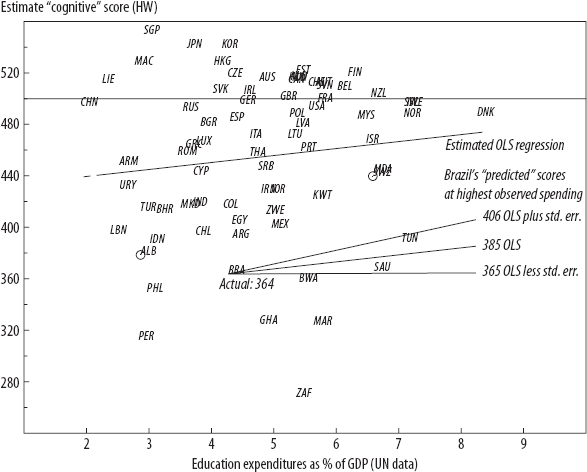
Source: Author's calculations, based on data from Hanushek and Woessmann (2009) and UNESCO UIS data from http://stats.uis.unesco.org/unesco/TableViewer/tableView.aspx?ReportId=172.
The usefulness of the arithmetic above is that we know that associations between spending and learning outcomes do not reveal some deep underlying hard technical facts about the world, but rather the opposite. Arguing about the causal impact of additional spending is pointless. The evidence suggests that the cost-effectiveness of spending, including the individual impact effects of various inputs, varies widely around the world.
In many physical sciences there are hard physical facts, like the mass of a proton or neutron. We know that if one atom has exactly one more proton than another atom, its mass is higher by exactly that amount, in Kenya, India, or Tennessee. But everything important about education involves human beings—as students, as teachers, as parents, as principals—and human beings are not reducible to physical facts because they have hopes, fears, identities, likes, tastes, motivations. Human beings choose. Therefore the impact of learning from adding a teacher to a classroom is not a fixed quantity, like proton mass, but rather is determined by the behavior of people.9 Studies measuring the impact of interventions such as lowering class size or adding resources or increasing teacher salaries do not reveal the impact of class size—they reveal there is no such thing as the impact of class size (Pritchett and Sandefur 2013).
What appears to constitute the major difference in the performance of educational systems in producing outcomes is the effectiveness with which people in those systems—students, teachers, administrators, parents—use resources. In low-effectiveness systems, no amount of additional resources that is not accompanied by a substantial increase in the effectiveness with which people work can achieve the education countries strive for. We can draw an analogy between spending on educational inputs and releasing water into a canal to provide irrigation for farmers in a desert. We know that water is needed to grow plants, but that doesn't mean that pouring more water into the canal will increase the growth of plants. What if the canal might be breached so that water leaks out? In this case, releasing more water at the head of the canal just leads to more water spilled, not more crops grown.
The West Does Not Know Best
Follow the leader makes some sense. Nearly all of the international assessments put countries into four groups: (1) East Asian countries, which have the highest scores, (2) most of the OECD countries, tightly clustered around the OECD mean of 500, (3) East European countries and former Soviet bloc countries, which are also mostly near the OECD mean, and (4) the rest of the world, mostly developing countries, which score around 400 or below. Therefore, a natural policy recommendation for developing countries might be to attempt to follow the same path as most OECD countries. Perhaps even education experts from the high-performing countries could teach developing countries how they achieve scores of 500.
The problem with learning from the West is that no living Western education expert has led, participated in, or lived through a truly major national improvement in measured student achievement. (In this case, “Western” excludes Finland, to which I return later.) Except for the United States the evidence is indirect, but it strongly suggests that all of the currently high-scoring educational systems in OECD countries were already high-scoring forty years ago. This means even a very experienced education expert, say, someone sixty years old, who finished his or her education training at age twenty-five in 1975, has never seen his or her country make a major improvement in average performance on measured learning outcomes. Such an expert's lived expertise therefore can include many issues, such as dealing with racial and gender inequalities, expanding reach to learning-disabled students, and coping with fractious social issues, but does not include creating a high-performance system.
This long-run stagnation in scores also means that the massive expansion of “more of the same” in OECD education systems—much smaller class sizes, much higher real spending per child, much higher levels of teacher educational qualifications—followed rather than preceded the achievement of high learning performance.
How do I defend this claim about the performance of the West? Nearly all schooling systems are much too clever to allow their performance to be tracked consistently over time. That would provide precisely the information needed to judge whether the improvements provided were really useful, and for what objectives. On this score, it pays to be ignorant (Pritchett 2002). By not tracking achievement over (a very long) time, the system is freed to follow the internally circular legitimization that more is better just because more is better.
The United States, however, consistently tracks performance in reading and mathematics using the National Assessment of Education Progress (NAEP). The really astounding result of the NAEP assessments is that over the thirty-three-year period from 1971 to 2004, the average reading score of seventeen-year-olds in American schools did not change at all. In 1971 the scaled score was 285 and in 2004 the scaled score was 285. Moreover, while there have been many socioeconomic and population composition changes in the United States since the 1970s that might have affected the national average, if we limit the time series comparison to just “advantaged” students (e.g., white students with a parent who graduated from college) the same trend holds (over the shorter period for which the data are available). In 1980 these students scored 305, and in 2004 they scored 303.
What would progress—for example, scores improving a student standard deviation in a generation—look like? As we have seen, the actual numerical scaling of learning assessments is just a convention, and on the NAEP, a student standard deviation in 2004 was 43, so a student standard deviation gain among the privileged students over this period would have taken scores from 305 in 1980 to 348 in 2004. This pace of progress in reading is illustrated in figure 3-7 as a hypothetical pace. While any education data are subject to quibbles, we can be confident that progress in the United States over this period was far, far, far less than a gain of one student standard deviation.10
While this lack of progress has occasioned massive debate in the United States, it is not a uniquely U.S. phenomenon. The U.S. rate of improvement is roughly the same as much of the OECD countries. Three German researchers, Eric Gundlach, Ludger Woessmann, and Jens Gmelin (2001), realized that although the United States was unique in tracking its own performance over time, many countries participated in a variety of international comparisons that compared their national average scores to those of the United States in reading and mathematics. Therefore one could link the assessments to estimate the speed of progress in countries that were not measuring their own speed. A simple analogy is to imagine you are watching a marathon. As long as two runners remain the same distance apart, if you know the speed of one, you automatically know the speed of the other. In the same way, if the United States measures its progress over time using one instrument, and Germany measures its position relative to the United States at various points in time, even using a different instrument, we can estimate the pace of progress in Germany by comparing its position relative to that of the United States. If it gained, it was improving faster; if it fell behind, it was improving more slowly. Woessmann has updated these calculations recently with Eric Hanushek (Hanushek and Woessmann 2009) using this simple concept, while making adjustments for the different subject domains, student populations, and assessment designs.
Figure 3-7. Average and “advantaged” children in the United States made nowhere near a student standard deviation progress in reading achievement over the past 40 years.
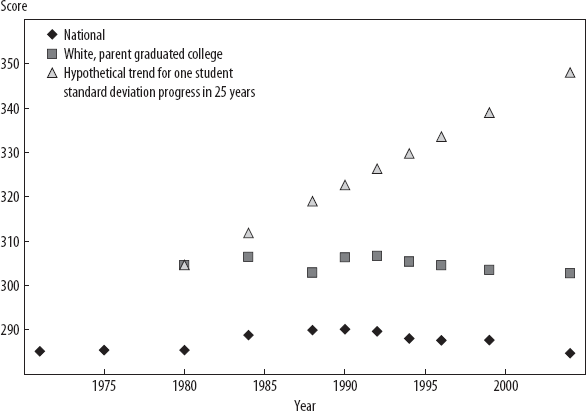
Source: Author's calculations, based on NAEP data from http://nces.ed.gov/nationsreportcard/lttdata/.
The results from this line of research reveal three important facts.
First, all fifteen OECD countries for which Hanushek and Woessmann had data were at or above 500 by 1975. These countries achieved roughly their current learning levels before the 1970s. This means no living education expert from the West has had experience implementing programs or practices or activities that led to the type of massive learning improvements that developing countries aim to achieve today. Instead, all existing education experts inherited systems with high learning performance. Therefore, their professional experience is in operating or improving functional, high-performing systems, not in building them.
Second, as Gundlach, Woessmann, and Gmelin (2001) show for the period 1970 to 1994, there have been massive increases in real education expenditures in every OECD country—in most countries, expenditures per pupil doubled or even tripled over this period. Moreover, all measures of the standard EMIS-visible inputs—infrastructure, supplies, teacher training and qualifications, reduced class sizes—also greatly increased over the same period. Whatever the gains from such increases in real education expenditures (and I am not debating whether there might not have been other valid educational gains from increased spending and inputs), however, the post-1970 improvements in spending per pupil neither account for the current OECD educational advantages nor appear to have led to substantial learning gains in the standard subject areas.
Third, countries that wish to increase learning outcomes cannot rely on imitating the current OECD pace of learning. The average gain in learning outcomes in the fifteen countries measured is 10 points over twenty-five years, only 0.4 IASSD a year. But 0.4 points a year is at the low end of the ranges we saw above for developing countries, based on PISA, TIMSS, and SACMEQ scores. This observation suggests that, while OECD countries are ahead, they are not systematically making faster progress.
Suppose we just do the mechanical exercise done in the opening of the chapter of asking, if developing country X were to achieve the pace of progress of the OECD, how long would it take that country to reach the current OECD level of learning achievement? Table 3-4 shows that it would take a very, very long time. We may take as an example Indonesia, a middle-income country with a growing economy and an average 2009 PISA score of 385. At the pace of 0.39 points a year, it would take almost 300 years (115/0.39 = 298) to reach the current OECD levels of learning achievement.
Some advanced countries have made more progress than others. For instance, Finland has been widely acknowledged as exhibiting rapid improvements. Between 1975 and 2000, Finland improved at about 1.2 points a year, almost three times faster than the OECD average. This is terrific, and later in the book I'll discuss more about how the country achieved that pace. But even at Finland's pace, Indonesia would take one hundred years to reach average OECD levels.
The reason I highlight the irrelevance of the pace of learning in OECD countries relative to that in developing countries is that debates about educational policies in poor countries often become about the educational fads in rich countries. But these are, for the most part, completely immaterial to solving the learning challenges of poor countries because OECD countries and poor countries are not tackling the same problem.
Table 3-4. Developing countries would take hundreds of years to reach OECD learning levels if they were to achieve on the pace gains in learning of the rich countries.
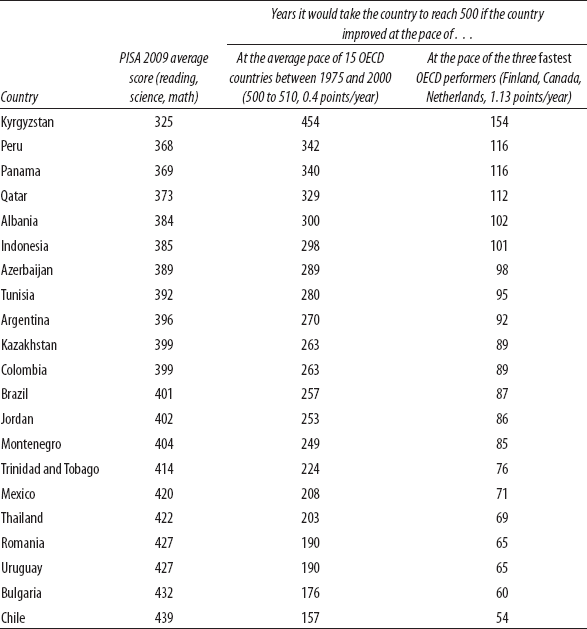
Source: Author's calculations, based on PISA 2009 data and estimates from Hanushek and Woessmann (2009, table B.3).
Why am I devoting so much time and intensity to the negative message that expanding inputs or spending alone cannot be the centerpiece of a strategy to improve learning? Because the first step to success is admitting failure. Thomas Edison and his team created a commercially viable electric light bulb by testing thousands and thousands of different materials and their shape. But this innovation was possible only because of three things: (1) he was looking for a new source of light, not content with existing sources; (2) he knew what he wanted; and (3) he was willing to admit failure and move on.
The next chapter discusses why all three things are difficult under the existing educational systems in most of the developed world. Major gains will have to come from system or structural changes that either produce more with existing inputs or accelerate the process of discovering and adopting new learning-achievement-improving innovations.
1. We did not use the data from Zimbabwe.
2. This is in homage to James Scott's landmark Seeing Like a State (1998), which describes many “schemes to improve the human condition” based on making the complexity of life “legible” to nation-states that rely on “bureaucratic high modernism” for implementation.
3. The most recent review (Glewwe et al. 2011) found over nine thousand studies looking at the link between inputs and learning, just between 1990 and 2010.
4. I want to stress again that while most of the literature relates educational inputs to learning in subjects that are easy and lower cost to measure, such as reading and mathematics, citing studies that examine learning in these subjects does not imply a “back to basics” approach that asserts that reading and math are the only or even most important elements of schooling. The process of education has a large number of important goals, such as socialization and the development of skill sets, that are not well measured on the typical standardized exam, but there is no evidence to suggest that gains to these harder-to-measure education objectives are different in their relationship to inputs.
5. Pedagogical processes, school organization, and community involvement also showed similar results, demonstrating that the lack of effects is not just true of inputs. Out of the ten non-input measures, only one was significant at the 5 percent level for math, while for reading, three measures were significant at the 5 percent level.
6. This is optimistic because the puzzling result is that the predicted gain from the EMIS-visible fantasy is modestly negative—scores would fall. This result is because one input is estimated to have a large negative effect. So to get any positive impact at all we have to just rule that one out and say it must be a fluke.
7. This study also collected measures of pedagogical processes based on observation of teachers in the classroom.
8. The natural assumption is that most nonexperimental settings make input use look bigger than its true impact because inputs and unobserved factors are positively correlated. That is, suppose that motivated parents/students are both more likely to be in schools that use inputs and more likely to perform well at any level of inputs. Then, if “motivation” is not measured in a nonexperimental study, this positive association of inputs and the omitted variable of motivation will cause estimates of inputs to be larger than their true causal impact because statistically the motivation impact, which goes unmeasured, gets falsely attributed to inputs. In contrast, pure measurement error of any input produces attenuation bias.
9. In research with Deon Filmer (Filmer and Pritchett 1999), I have shown that the education production function literature reveals more about the politics of spending than about the pedagogical value of inputs.
10. For the same population (seventeen years old, white, at least one parent a college graduate), mathematics scores increased from 319 in 1978 to 322 in 2004.