CHAPTER 11
Full Employment
After he made a speech to the National Bureau of Economic Research in Cambridge, Massachusetts, in July 2018 Governor Mark Carney asked me what I thought the NAIRU (Non-Accelerating Inflation Rate of Unemployment), which is the technical name for full employment, was. I replied: “I know the MPC thinks it is around 4.5 percent but I think it is likely closer to 2.5 percent.” The evidence seems to be that in the United States and the UK the NAIRU was likely around 4.5 percent before the Great Recession and 2.5 percent after it. The recession of 2008 and 2009 was a major structural break that policymakers still do not seem to accept or understand. The Great Recession has changed everything.
As I noted at the beginning of the book, and as it should be well clear by now, this book is about jobs, decent jobs that pay well, and the lack of them. The big issue is how to bring back the good, well-paying jobs. An obvious way is to let the economy run hot. Workers would become increasingly scarce, which is something that hasn’t happened for years. That way wage growth would rise sharply, at rates comparable to those observed in the years before 2008, perhaps 4 percent or even 5 percent. That would make workers feel good and encourage many to join the labor force, including many of those who have been left behind for so long. That might well take the wind out of the sails of populism.
One of the first things I learned in my Economics A-level class in 1968 was that full employment didn’t mean everyone had a job. Far from it. A dynamic capitalist economy, I was taught, was always changing, with firms being born and others dying. Workers move between firms and even set up their own business, and hence sometimes it was necessary for them to have, hopefully short, spells of unemployment. Some of those businesses succeed, but most fail. If unemployment gets too low wages would have to rise as the only way to get workers would be to pinch them from other firms, since there is no available pool of labor to dip into. I recall being taught that the full-employment rate of unemployment was 3 percent.
A big question is, how low can unemployment go? William Beveridge ([1944] 1960) tells the story in the prologue to his book that he described 3 percent in his original report as a “conservative rather than unduly hopeful aim for the average unemployment rate of the future under conditions of full-employment.” When Keynes saw this number, he wrote to Beveridge to say that he saw no harm in aiming for 3 percent but that he would be surprised if it could go so low in practice. In the prologue Beveridge notes that in fact in the twelve years from 1948 through 1959 the unemployment rate surprised to the low side with no wage explosion and averaged 1.55%. Here are the UK numbers: 1948–50 = 1.5%; 1951 = 1.2%; 1952 = 2%; 1953 = 1.6%; 1954 = 1.3%; 1955 = 1.1%; 1956 = 1.2%; 1957 = 1.4%; 1958 = 2.1%; and 1959 = 2.2%. I see no reason we couldn’t go as low again and get downside surprises to the unemployment rate globally.
It doesn’t appear from the data we have that there was a wage explosion over those years. We have data available from the Bank of England on real consumption wages over this period. This is based on what they call the preferred earnings and CPI series (1900 = 100). In 1948 the index number was 143.97, which rose to 170.74 in 1959, which means real earnings rose by 18.6 percent over this eleven-year period. Such a rise in real wages would be welcomed around the world.
In the United States the unemployment rate was 2.5 percent in May and June 1953. From January 1960 through August 1975, the Japanese unemployment rate was never above 2 percent and in the latest data for April 2018 is 2.5 percent. Over the entire period of January 1955 through April 2018, Japanese unemployment averaged 2.7 percent versus 5.95 percent in the United States. Maybe this is the future for the United States and the UK? I see no reason why the U.S. and UK unemployment rates couldn’t get close to 2.5 percent again. Japan has seen no nominal wage growth in nearly three decades and real wages are down 11 percent and may well be the precedent.
My contention, then, is that there is really no good reason why the unemployment rate could not go below 3 percent in the United States, the UK, and Germany again and maybe even to 2 percent. That is what happened, to the surprise of both Beveridge and Keynes, in the UK between 1948 and 1959, so why not again? The (failed) economic models say you shouldn’t do this because this would push up inflation, but it hasn’t even when unemployment rates dropped from 6 to 5 to 4 percent.
But that is what the inflation hawks said when the unemployment rate was at 6.5 percent and falling and nothing happened on the way down below 4.5 percent. I wouldn’t be surprised if the same happens if the unemployment rate is allowed to drop from 4.5 to 2.5 percent; there will be little wage pressure and no inflation, so why not try it again? All three countries have nominal wage growth in 2019 of about 2.5–3 percent and much below pre-recession levels at comparably low unemployment rates. Let’s give it a shot.
The puzzle for central bankers, who are trying to drive inflation down by raising rates as in the case of the Fed in the United States or threatening to do so in the case of the Bank of England, is that the models keep telling them there is about to be lots of price and wage inflation. Their problem is there isn’t any such inflation. These models are primarily driven by what happened in the 1970s, when unions were powerful fifty years ago, after the Paris riots of May 1968.1 The economists who play with their silly little out-of-date models simply can’t figure out why there is no inflation. So, they are trying to drive the unemployment rate up.
Now is the time to realize there has been a structural break and the best thing to do is to look to the 1950s and try to get the unemployment rate down. The unemployment rate was 2.7 percent in 1952 in the United States. Such low rates in my view are not infeasible. That would give workers’ wages a huge fillip. It is time to stop running Western economies on empty. The elites have argued we shouldn’t and can’t do this, but why believe them? They have been wrong at every turn. Yes, we can.
In reality, the high level of labor market slack and the weakness of workers’ bargaining power are keeping pay and price inflation down. Full employment is a long way off. If it was anywhere close wage growth would be back to pre-recession levels of 4 percent or even higher. Workers are not standing by waiting for high-wage offers to roll in. A wage norm near 3 percent is operating. If and when an economy approaches full employment we will see wage growth rising to 4 percent or so. Until it does, it is a good indicator the economy is not close to full employment. I do expect wage growth will start to kick up gradually as the economy moves to the left of the flat part of the wage curve. It hasn’t gotten there yet. It may not do so until the unemployment rate goes below 3 percent or even 2 percent or lower principally because of the large amount of underemployment, which is still well above pre-recession levels. Underemployment pushes wages down; unemployment does not seem to these days.
Wages are the dog that hasn’t barked around the world. There is no sign that is set to change any time soon. Woof, woof. All hands to the pump. It’s time to prime that pump to change all that. Workers will see decent job opportunities opening in front of their very eyes. Three percent unemployment here we come, or maybe even 2 percent. Let the good times roll. I don’t see any better choice.
Tivvy Junction
Moving closer to full employment would obviously boost the availability of good jobs, meaning, high-paying jobs. As labor becomes less readily available, firms have to bid workers away from other firms. They have to increase wages for menial jobs to such a degree that many who are outside the labor force want to take them. Working in a fast-food restaurant for seven bucks an hour would be very different from receiving twenty an hour. My own experience with this was that in 1975, the UK labor market was humming with an unemployment rate of below 5 percent. I went to work in Tiverton “Tivvy” Junction in Devon building the M5 motorway for the construction firm Tarmac, which became Carillion and failed in early 2018. Labor was in short supply in the 1970s, so I was hired as a “chain-boy” who worked for the surveyors marking out the lines where the bulldozers would have to cut. That job was previously paid youth rates, but I got full laborers’ rates as the market was so tight. That was a good job, meaning it paid well. A rising tide lifts all boats: Richard Freeman taught me that those who do worst in the slump do best in the boom.
“Good jobs” basically just means high-paying jobs, with benefits and retirement plans. There are lots of them when the economy is at full employment. Chain-boys don’t take laborers’ jobs at laborers’ rates during recessions. In 2017 many people found that their skills were being underutilized; at full employment that would not be the case. Workers who weren’t using their skills fully could move up the job pyramid as the demand for workers took off. At full employment workers are able to start climbing the occupational ladder once again.
Policymakers are worried about what would happen to inflation if the unemployment rate continued to drop. That concern is driven by fears about what happened in the 1970s and 1980s, but that was then and this is now. Why believe them? They are precisely the people who have been saying for the last decade that wage growth was going to take off and the productivity puzzle was solved and next year there would be four rate rises followed by four the next year and four the next. None of that happened, so why trust them on inflation? I don’t. In any case we know that a 1-percentage-point rise in the unemployment rate is five times worse, in terms of well-being, than a 1-percentage-point rise in inflation. Unemployment hurts (Blanchflower et al. 2014).
Wage inflation in the UK, the United States, and Germany has hardly moved at all in the last five years as the unemployment rate dropped from 6.5 to 5.5 percent, to 4.5 percent, and then to 4 percent. At the same time wage growth went from 2 percent to 2.8 percent. My central thesis is that a drop from 4.5 to 2.5 percent, and perhaps even lower, will have similar minimal impacts. Workers now have little bargaining power, and trade unions are weaker than they have been in many a moon, plus we are in a global marketplace, to a much greater extent than in the past, where firms can move production where they please. The Great Recession exacerbated these factors as it scared workers senseless.
The NAIRU Has Fallen
In New Hampshire, where I have lived for the past twenty-eight years, the monthly unemployment rate has been under 3 percent since the beginning of 2016. It is currently 2.5 percent (December 2018). A friend of mine who is a large employer in the Upper Valley near where I work told me, “From my limited perspective, there is no wage pressure out there, even with our low local unemployment.” The EWA generally doesn’t lie.
The fix is for central bankers and fiscal authorities to keep their feet on the stimulus gas pedal.2 Paul Krugman argued in the New York Times that it is obvious that structural explanations of unemployment are wrong. He noted that anti-structuralists or demand siders tried to point out that if the structural story were true, there should be a lot of upward pressure on the wages of those workers who did have the right skills; in fact, nobody was seeing much in the way of wage gains. He goes on to argue that adequate stimulus would have sorted out many of the labor market problems we have observed. Krugman suggests, “There was also the problem Keynesian economics always faces: it just doesn’t sound serious enough to Serious People. The idea that mass unemployment is fundamentally just a problem of inadequate demand … and that it is easily solved by spending more, sounds too easy.”3 It is time to spend more to get the economy buzzing. As Larry Summers has said, we should wait to see the whites of the eyes of inflation. I would extend that to wait to see any evidence of wage inflation of 4 percent.
The fall in the homeownership rate in the United States and the UK is an important factor behind my claim that the equilibrium unemployment rate can come down by a lot. This will increase mobility. In the UK, the arrival of several million workers from the ten Accession countries since 2004 has made the labor market perform more efficiently, largely unconstrained by the housing market. This has also contributed to a fall in the equilibrium unemployment rate as these workers are free to move about the country.
In addition, the low levels of unionization around the world and the spread of globalization have decreased workers’ bargaining power as has the rise of monopsony power. Workers are fearful that their employer will move to Mexico or subcontract their work to India. In the UK workers are concerned that if they ask for significant pay increases thousands more Poles will enter the country and take their jobs away. A given unemployment rate is now associated with less wage pressure than it was in the past. This means that full employment in advanced countries—the natural rate of unemployment or NAIRU—is likely much lower than it was in the past.
Nobel Economics Laureate Ned Phelps concurs. Workers have been shaken by the Great Recession, he argues. Unemployment can surprise on the low side before wages start to rise back to the 4 percent or so they were growing at pre-recession. As Phelps says,
For me, a compelling hypothesis is that workers, shaken by the 2008 financial crisis and the deep recession that resulted, have grown afraid to demand promotions or to search for better-paying employers—despite the ease of finding work in the recently tight labor market. A corollary hypothesis is that employers, disturbed by the extremely slow growth of productivity, especially in the past ten years, have grown leery of granting pay raises—despite the return of demand to pre-crisis proportions…. As the return of a strong dollar by early 2015 threatened to inundate American markets with imports, firms became scared to supply more output at the same price. Or else they supplied the same output as before at reduced prices. And they refused to raise employees’ wages. In short, more competition created “super-employment”—low unemployment and low inflation.4
That looks right.
Eddie Lazear, chairman of George W. Bush’s Council of Economic Advisers, and J. R. Spletzer argued in 2012 that structural changes had not obviously occurred in the U.S. labor market that would prevent low unemployment rates from returning. Their view is that the patterns observed during the recession were primarily cyclical. That is my view too.
The question is important because central banks may be able to reduce unemployment that is cyclic in nature, but not that which is structural. An analysis of labor market data suggests that there are no structural changes that can explain movements in unemployment rates over recent years. Neither industrial nor demographic shifts nor a mismatch of skills with job vacancies is behind the increased rates of unemployment. Although mismatch increased during the recession, it retreated at the same rate. The patterns observed are consistent with unemployment being caused by cyclic phenomena that are more pronounced during the current recession than in prior recessions. (Lazear and Spletzer 2012)
In his 1968 address to the American Economic Association, Milton Friedman famously argued that the natural rate of unemployment can be expected to depend upon the degree of labor mobility in the economy.5 The functioning of the labor market will thus be shaped not just by long-studied factors such as the generosity of unemployment benefits and the strength of trade unions but also by the nature, and inherent flexibility and dynamism, of the housing market.
Friedman also made clear that the natural rate of unemployment is not unchanging: “I do not mean to suggest that it is immutable and unchangeable. On the contrary, many of the market characteristics that determine its level are man-made and policy-made” (1968, 9). Friedman goes on to argue, for example, that the strength of union power and the size of the minimum wage make the natural rate higher; their declines in recent years thus make the natural rate lower. He emphasized that improvements in labor exchanges, in availability of information about job vacancies and labor supply, all of which have been enhanced by the Internet, tend to lower the natural rate. That, I contend, is what has happened. The natural rate of unemployment in advanced countries has fallen sharply since the Great Recession.
Janet Yellen in a speech in September 2017 raised the possibility that, indeed, the natural rate has fallen and perhaps by a lot:
Some key assumptions underlying the baseline outlook could be wrong in ways that imply that inflation will remain low for longer than currently projected. For example, labor market conditions may not be as tight as they appear to be, and thus they may exert less upward pressure on inflation than anticipated.
The unemployment rate consistent with long-run price stability at any time is not known with certainty; we can only estimate it. The median of the longer-run unemployment rate projections submitted by FOMC participants last week is around 4–1/2 percent. But the long-run sustainable unemployment rate can drift over time because of demographic changes and other factors, some of which can be difficult to quantify—or even identify—in real time. For these and other reasons, the statistical precision of such estimates is limited, and the actual value of the sustainable rate could well be noticeably lower than currently projected.6
At the press conference following the FOMC rate increase decision on March 21, 2018, the new Fed chairman Jay Powell in response to a reporter’s question as to whether he was satisfied by the current pace of wage growth said the following:
As the market is tightened, as labor markets have tightened, and we hear reports of labor shortages that we see that, you know, groups of unemployed are diminishing, and the unemployment rate is going down, we haven’t seen, you know, higher wages, wages going up more. And I would—I think I’ve been surprised by that, and I think others have as well. In terms of what’s the right level, I don’t think I have a view on what the right level of wages is, but I think we will know that the labor market is getting tight when we do see a more meaningful upward move in wages.7
Even in 2018, ten years in, they really don’t have much of a clue as to what is going on in the labor market. At a speech at an ECB forum in June 2018, Jay Powell argued as follows:
Wage growth has been moderate, consistent with low productivity growth but also an indication that the labor market is not excessively tight…. What would be the consequences for inflation if unemployment were to run well below the natural rate for an extended period? The flat Phillips curve suggests that the implications for inflation might not be large, although a very tight labor market could lead to larger, nonlinear effects.
That wage explosion is really just around the corner. Actually, it isn’t. Research from the Fed confirms that. Babb and Deitmeister find in their work that a noticeably higher inflation rate is only likely to emerge “once unemployment falls well below its current level” (2017, 16).
Staiger, Stock, and Watson examined the precision of estimates of the natural rate of unemployment. They note that the NAIRU “is commonly taken to be the rate of unemployment at which inflation remains constant. Unfortunately, the NAIRU is not directly observable…. The task of measuring the NAIRU is further complicated by the general recognition that, plausibly, the NAIRU has changed over the post-war period, perhaps as a consequence of changes in labor markets” (1997a, 195). They further note that “a wide range of values of the NAIRU are consistent with the empirical evidence” (1997a, 237) and, crucially, that the trigger point—when wages and prices start to rise—is poorly estimated. For example, they estimate a NAIRU for the United States of 6.2 percent in 1990 with a 95 percent confidence interval of 5.1 to 7.7 percent. In a different publication the same authors argue that the tightest of the 95 percent confidence intervals for 1994 in the United States is 4.8 to 6.6 percent. They conclude that “it is difficult to estimate the level of unemployment at which the curve predicts is constant rate of inflation” (1997b, 47). Doug Staiger is in the next office to me and is almost always right.
Standing By
It is my contention that the natural rate of unemployment in most advanced countries is well below 3 percent. Employment rates and participation rates can rise, and unemployment rates can fall and by a lot. Globalization has weakened workers’ bargaining power. Migrant flows have put downward pressure on wages and greased the wheels of the labor market as their presence has increased mobility. The decline in the homeownership rate, which slows job creation and increases unemployment, has helped mobility and lowered the natural rate as has the influx of highly mobile migrants. The Great Recession exposed underlying weaknesses and exposed the possibility to the populace of catastrophic declines in house prices and pension pots. The balance between capital and labor shifted once again toward capital. Workers are frightened in a way that they weren’t pre-recession. Hence the natural rate has fallen, and that is why there has been no spurt in wage growth as the unemployment rate fell from 10 to 8 percent; from 8 to 6 percent; and from 6 to 4 percent.
As William Beveridge noted in 1944, “full employment means that unemployment is reduced to short intervals of standing by, with the certainty that very soon one will be wanted in one’s old job again or will be wanted in a new job that is within one’s powers…. It means that the jobs are at fair wages, of such a kind, and so located that the unemployed men can reasonably be expected to take them: it means, by consequence, that the normal lag between losing one job and finding another will be short” ([1944] 1960, 18). We are a long way from that and we need to get there. I am standing by.
Beveridge also noted that “full employment means having more vacancies for workers than there are workers seeking vacancies,” but “it does not mean having no unemployment at all” ([1944] 1960, 1).
It is my thesis in this book that there is no reason why unemployment couldn’t surprise again on how low it can go. Full employment in advanced countries such as the United Kingdom and the United States is likely well below 3 percent. Already it is down to 3.3 percent in Germany in October 2018 without any obvious wage surge and seems set to go lower. It is 2.3 percent in Japan and nominal wages haven’t grown in years. In December 2018 the lowest unemployment rate was 2.4 percent in Iowa with no obvious signs of a wage explosion. It was below 3 percent in nine other states: Hawaii (2.5%), New Hampshire (2.5%), Idaho (2.6%), North Dakota (2.7%), Vermont (2.7%), Minnesota (2.8%), Nebraska (2.8%), Virginia (2.8%), and South Dakota (2.9%). Thirty-two states had rates under 4 percent. Alaska had the highest rate at 6.3 percent.
Policymakers Have Endlessly Cried Wolf over Wage Growth
Policymakers in the UK have long been expecting wage growth to accelerate. For example, in the opening statement at the February 2018 press conference for the Bank of England’s Inflation Report, Governor Mark Carney argued as follows: “The firming of shorter-term measures of wage growth in recent quarters, and a range of survey indicators that suggests pay growth will rise further in response to the tightening labour market, give increasing confidence that growth in wages and unit labour costs will pick up to target-consistent rates.”8
Twelve months earlier, Governor Carney at the February 2017 press conference had argued, “Following a long period of consistently overestimating wage growth, the MPC has updated its view of the natural rate of unemployment. Specifically, the MPC now judges that the rate of unemployment the economy can achieve while being consistent with sustainable rates of wage growth to be around 4.5%, down from around 5% previously.”9
The February 2018 Inflation Report reduced the MPC’s estimate of the natural rate once again to 4.25 percent: “Based on a range of evidence, the MPC judges that the long-term equilibrium unemployment rate is around 4.25%, a little lower than judged a year ago and broadly in line with the current headline rate of unemployment.”10
On February 21, 2018, the Bank of England’s chief economist, Andy Haldane (wrongly, I argued at the time), continued the hopeful theme that wages were set to rocket: “The long-awaited—and we have been waiting for a long time—pickup in wages is starting to take root. We get intelligence from our agents that would suggest that wage settlements this year were going to pick up, perhaps to a number with a three in front of it, rather than a two in front of it.”11 He repeated that claim again in a subsequent speech later in 2018, but still not much action on the wage-growth front.12
They never give up. External MPC member Silvana Tenreyro seems to not care much about data at all but assumes wages are going to pick up anyway: “Many commentators have recently argued that the Phillips curve is no longer apparent in the data…. My view is that these fears are largely misplaced…. Successful monetary policy will make the Phillips curve harder to identify in the data…. I am unconvinced by reports of the death of the Phillips curve, so I expect this to translate into a pickup in domestic cost pressures.”13 I see no ships.
There had been a small pickup in settlements in 2018 reported by pay experts XpertHR. For 2018 they found that the median raise was 2.5 percent. This follows a seven-year stretch where pay awards were worth close to 2 percent. But by March 2019 XpertHR was reporting that employers were predicting that pay awards in 2019 would be at the same level as in 2018, at 2.5 percent in both services and manufacturing, driven by Brexit uncertainty. The Bank of England’s agents in a special survey also found a pickup in 2018. The question is whether this is the start of a new constant at 2.5 percent as appears to have begun in the United States or the start of something bigger. This is pretty thin gruel to vote for rate rises on.
Flat Bits
Another way of looking at wage dynamics is through the Phillips curve, which Bill Phillips in his 1958 Economica article plotted as wage changes against the unemployment rate. The title of the article tells it all: “The Relation between Unemployment and the Rate of Change of Money Wage Rates in the United Kingdom, 1861–1957.” Figure 11.1A plots U.S. monthly annual private-sector hourly wage growth for private-sector production and non-supervisory workers (PNSW) against the unemployment rate for the pre-recession period from January 1998 to December 2007. I also include the equation of the linear best-fit line, which is +7.3348 - .809 * unemployment rate. Plugging in an unemployment rate of 3.9%, as observed in April 2000, and in July 2018, for example, predicts wage growth of 7.3348 - (.809 * 3.8) = 4.3%.
Figure 11.1B plots U.S. monthly private-sector hourly annualized wage growth for PNSW against the underemployment rate U7 for the recovery period from January 2011 to October 2018. The best-fit line now is 3.4564 - .2885 * unemployment rate. Plugging in the current U7 underemployment rate of 2.9%, as observed in May 2018, predicts wage growth of 3.4564 - (0.2885 * 2.9) = 2.6%. If we plug in the lowest observed U7 rate of 2.3% observed in six separate months in 2000 we still only get wage growth of 2.8%, not anywhere close to 4%. As the U.S. economy approached full employment we would expect to see wage growth pick up faster than that.14
Ewald Nowotny, who sits on the Governing Council at the European Central Bank, put it punchily: “There’s a big international discussion about why wages react so slowly to downward changes in the unemployment rate—this is the famous Phillips curve problem. We had just recently a meeting at the Bank for International Settlements where Bill Dudley, the central-bank governor of New York, said that in the U.S. the Phillips curve now is ‘flat as Kansas.’”15 That is a bit of an exaggeration, but the Phillips curve is clearly flatter than it was post-recession compared with pre-recession.
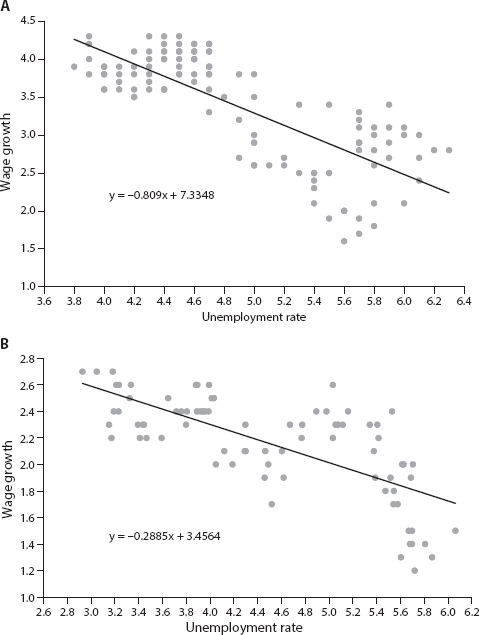
Figure 11.1. (A) U.S. hourly wage Phillips curve of production and non-supervisory workers, January 1998-December 2007 (B) U.S. hourly wage Phillips curve of production and non-supervisory workers, January 2011-October 2018. Source: BLS.
In a recent speech external MPC member Gertjan Vlieghe argued that a credible Phillips curve still exists in the UK. His main evidence was a plot of wage changes against the unemployment rate, such as in the period 2001 through 2018. David Bell and I (2018b) argued this covered up major structural shifts as it does for the United States. Since 2008 the underemployment rate replaces the unemployment rate as the main measure of labor market slack.16 Figure 11.2A covers Vlieghe’s time period from January 2001 to May 2018 using data on total pay growth using single-month data. There is a downward-sloping Phillips curve for the entire period with a best-fit line with the equation of y = -.7168x + 7.1158. At the current unemployment rate U3 in May 2018 of 4.2% this predicts wage growth of y = (-.7168 * 4) + 7.1158 = 4.2% versus the actual of 2.5%. It may be credible, but it isn’t much use for forecasting.
Figure 11.2B is for September 2014 to May 2018 and illustrates where the same wage-growth data are plotted against the U7 underemployment rate (part-time wants full- time/employment). The line of best fit is y = +2.8374 - .1176 * unemployment rate. That predicts that wage growth at the most recent underemployment rate of 2.8% for August 2018 would be y = +2.8374 - (.1176 * 2.8) = 2.5%. Using the lowest level of the underemployment rate of 1.9% that occurred in December 2004 predicts wage growth of only 2.6%. This seems the most appropriate way to model the post-recession Phillips curve given that the unemployment rate doesn’t explain wages post-2008 whereas the underemployment rate does. The UK Phillips curve has flattened.
So, it looks awfully like the Phillips curve is shallower in the United States and the UK and likely elsewhere too. In a paper with my Dartmouth colleague Andy Levin (Blanchflower and Levin 2014), who was previously economic advisor to Janet Yellen and Ben Bernanke, we examined the impact of inactivity and underemployment on wages in the United States. The FOMC in our view underestimated the scale of slack in the labor market as did the MPC in the UK for broadly similar reasons. Both wrongly focused on the unemployment rate as the measure of slack. This was fine prior to 2008, but as I have shown in earlier chapters, this was not fine subsequently.
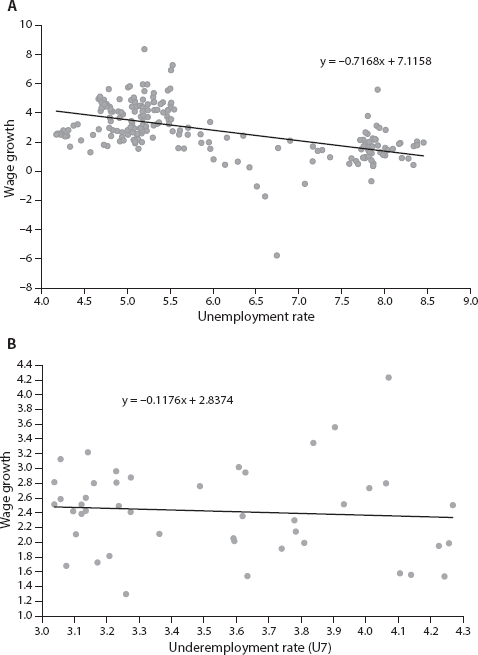
Figure 11.2. (A) UK AWE total pay single-month Phillips curve and the unemployment rate (U3), January 2001–May 2018. (B) UK AWE total pay single month and the underemployment rate (U7), September 2014–May 2018.
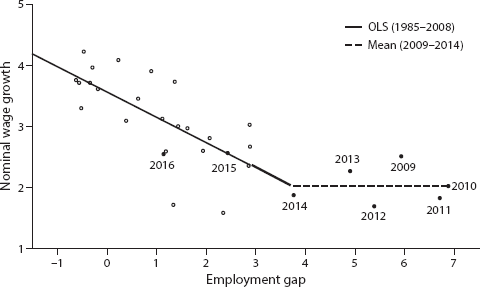
Figure 11.3. The wage curve. This figure shows the relationship between the annual average employment gap (expressed as a percent of the CBO’s assessment of the potential labor force) and the twelve-month percent change in average hourly earnings of production and non-supervisory workers for each calendar year since 1985, with a label for each observation from 2009 to 2016. Source: Blanchflower and Levin 2014.
Figure 11.3 presents our interpretation of the relationship between nominal wage growth and the true unemployment rate (including underemployment and nonparticipation). I suspect that the wage curve is relatively flat at elevated levels of labor market slack, that is, a decline in slack does not generate any significant wage pressures, when the level of slack remains large. As noted above, our benchmark analysis indicates that the true unemployment rate is currently around 7 percent—a notable decline from its peak of more than 10 percent but still well above its longer-run normal level of around 5 percent. Thus, the shape of the wage curve can explain why nominal wage growth has remained stagnant at around 2 percent over the past few years even as the employment gap has diminished substantially. Moreover, our interpretation suggests that nominal wages will not begin to accelerate until labor market slack diminishes substantially further and the true unemployment rate approaches its longer-run normal level of around 5 percent.
The average hourly earnings of production and non-supervisory workers decelerated sharply during the recession and then remained at a plateau of around 2 percent despite the strengthening job market. This pattern Andy and I noted was consistent with other evidence of downward nominal wage rigidity, which essentially flattens out the “wage curve” at high levels of labor market slack. Moreover, our analysis indicated that nominal wage growth would pick up noticeably once the employment gap diminished further, and that’s exactly what’s been observed more recently.
The technical explanation of the employment gap is in fact the sum of three specific components. First, the unemployment gap is the deviation of the conventional unemployment rate labeled U3 by the BLS from professional forecasters’ consensus projections of its longer-run normal rate (as reported in semi-annual Blue-Chip surveys). Second, the participation gap is the deviation (in percentage points) of the actual size of the labor force from CBO assessments of the potential labor force; this shortfall corresponds to the notion of “hidden unemployment” (that is, people who are not actively searching but who would rejoin the workforce if the job market were stronger). Third, the underemployment gap takes the BLS measure of people working part-time for economic reasons (expressed as a fraction of the potential labor force) as a deviation from its 1994–2007 average and then converts this deviation into full-time equivalent (FTE) jobs.
Indeed, for the year 2015, the average employment gap was about 2.5 percent of the potential labor force, while nominal earnings increased 2.6 percent. As shown in figure 11.3, that outcome is precisely in line with the implications of the wage curve fitted to the previous data from 1984 through 2014. The estimate for 2016 was below what the fitted wage curve would suggest. The U.S. economy is a long way from full employment and that is why so many are hurting. Trump called it right.
Learning from the Past
It seems to me we should learn from the lessons of the past. The puzzle for central bankers, who are trying to drive inflation down and increase unemployment by raising rates as in the case of the Fed in the United States or threatening to do so in the case of the Bank of England, is that the models keep telling them there is about to be lots of price and wage inflation. Their problem is there isn’t any. They have wrongly concluded full employment is close by.
Central banks have been using models that are primarily driven by what happened in the 1970s, and the economists who play with them simply can’t figure out why there is no inflation. So they are trying to drive the unemployment rate up because they just know inflation is about to take off even though it hasn’t for years. Things are different nowadays.
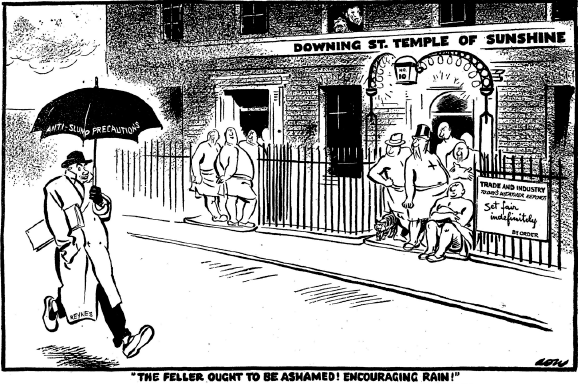
Figure 11.4. “The feller ought to be ashamed! Encouraging rain!” This is a famous cartoon by David Low printed in the UK Evening Standard on January 5, 1938, depicting the residences of the UK prime minister at #10 Downing Street and of the Chancellor of the Exchequer at #11. As background, the Treasury view was that fiscal policy had no effect on the total amount of economic activity and unemployment, even during times of economic recession. This view was most famously advanced in the 1930s by the staff of the British Chancellor of the Exchequer. In 2010 the UK Chancellor George Osborne implemented huge public spending cuts that he argued would result in an expansionary fiscal contraction but resulted in the slowest peacetime recovery in three hundred years since the South Sea Bubble. Depicted in the cartoon are John Maynard Keynes, Prime Minister Neville Chamberlain, Chancellor of the Exchequer Viscount John Allsebrook Simon, and the fictional character Colonel Blimp. The Treasury officials wrapped in towels at the Downing Street “Temple of Sunshine” next to a sign that the weather is “set fair indefinitely” are saying the feller ought to be ashamed for encouraging rain. Keynes is holding up an umbrella with the words “anti-slump precautions” on it. Top left the storm clouds are gathering. I showed the cartoon to Ben Bernanke when I met with him in his office at the Fed. Source: Copyright © David Low / Solo Syndication.
Once economies reach full employment workers will be standing by as in the past, waiting for decent job offers. That is not happening now. The elites have kept saying inflation is set to explode but they have been wrong so many times, why believe them now? The problem is both price inflation and wage inflation are too low, not too high. Past remedies have failed. Now is the time for a big rethink.
One way to get toward full employment would be, as Larry Summers suggests (2018), to raise the 2 percent inflation target that exists around the world, in the United States, Canada, and the UK, for example, to something higher. Other possibilities include price-level or nominal GDP targets, as set out by Wessel (2018), but these amount to much the same thing, currently, as they would keep rates lower for longer. Summers argues that the Fed’s logic in setting the target at 2 percent involves trading off what are seen as the costs of inflation and the benefits of avoiding deflation. In the last decade, he rightly points out, the costs of deflation have increased: “If deflation risks look considerably greater than they did in the 1990s and the costs of inflation look about the same, it follows that whatever inflation target was appropriate then is too low today” (2018, 2). With a higher inflation target the Fed would likely not be raising rates in 2018. Summers believes the current framework is “singularly brittle” and suggests that there is no evidence that the costs of running 3 percent rather than 2 percent inflation are especially large. I agree. The current framework has severe consequences for ordinary folk.
The fix is to get the unemployment rate in advanced countries down to levels not seen since the 1940s and 1950s; this can plausibly be done. Full employment is nowhere near the 4.5 percent or so that policymakers including at the Fed, the U.S. central bank, and the MPC in the UK seem to believe. That would be running an economy on a full tank. If we were anywhere close to full employment so many people wouldn’t be hurting and hating, and wages would start to rise again. My experience at universities is that fights in departments occur when there is a lack of resources. The NAIRU pre-2008 was likely around 4.5 percent and in my view has now dropped to around an unemployment rate of 2.5 percent.17
Everyone wants a good, well-paying job. That is most likely to be delivered when workers are standing by for job offers at full employment. It is unclear where that point is exactly, but it is clear at the time of writing at the end of 2018 that we are not there yet.