In the previous example, we looked at extending pipe assemblies in Cascading workflows.
Functionally, is only a few changes away from implementing an algorithm called
term frequency–inverse document frequency (TF-IDF).
This is the basis for many search indexing metrics, such as in the popular open source search engine
Apache Lucene.
See the
Similarity class
in Lucene for a great discussion of the algorithm and its use.
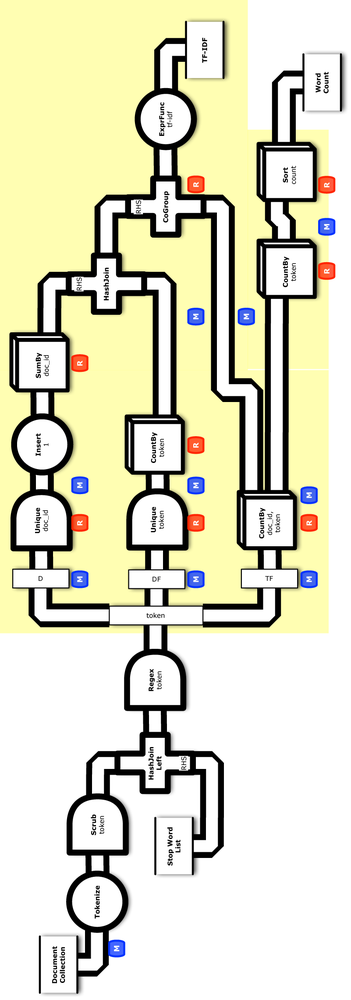
For this example, let’s show how to implement TF-IDF in Cascading—which is a useful subassembly to reuse in a variety of apps. Figure 3-1 shows a conceptual diagram for this. Based on having a more complex app to work with, we’ll begin to examine Cascading features for testing at scale.
Starting from the source code directory that you cloned in Git, connect into the part5 subdirectory. First let’s add another sink tap to write the TF-IDF weights:
StringtfidfPath=args[3];TaptfidfTap=newHfs(newTextDelimited(true,"\t"),tfidfPath);
Next we’ll modify the existing pipe assemblies for Word Count, beginning immediately after the join used as a “stop words” filter.
We add the following line to retain only the doc_id and token fields in the output tuple stream, based on the fieldSelector parameter:
tokenPipe=newRetain(tokenPipe,fieldSelector);
Now let’s step back and consider the desired end result, a TF-IDF metric. The “TF” and “IDF” parts of TF-IDF can be calculated given four metrics:
- Term count
- Number of times a given token appears in a given document
- Document frequency
- How frequently a given token appears across all documents
- Number of terms
- Total number of tokens in a given document
- Document count
- Total number of documents
Slight modifications to Word Count produce both term count and document frequency, along with the other two components, which get calculated almost as by-products.
At this point, we need to use the tuple stream in multiple ways—effectively splitting the intermediate results from tokenPipe in three ways.
Note that there are three basic patterns for separating or combining tuple streams:
- Merge
- Combine two or more streams that have identical fields
- Join
- Combine two or more streams that have different fields, based on common field values
- Split
- Take a single stream and send it down two or more pipes, each with unique branch names
We’ve already seen a join; now we’ll introduce a split. This is also a good point to talk about the names of branches in pipe assemblies. Note that pipes always have names. When we connect pipes into pipe assemblies, the name gets inherited downstream—unless it gets changed through the API or due to a structural difference such as a join or a merge. Branch names are important for troubleshooting and instrumentation of workflows. In this case where we’re using a split, Cascading requires each branch to have a different name.
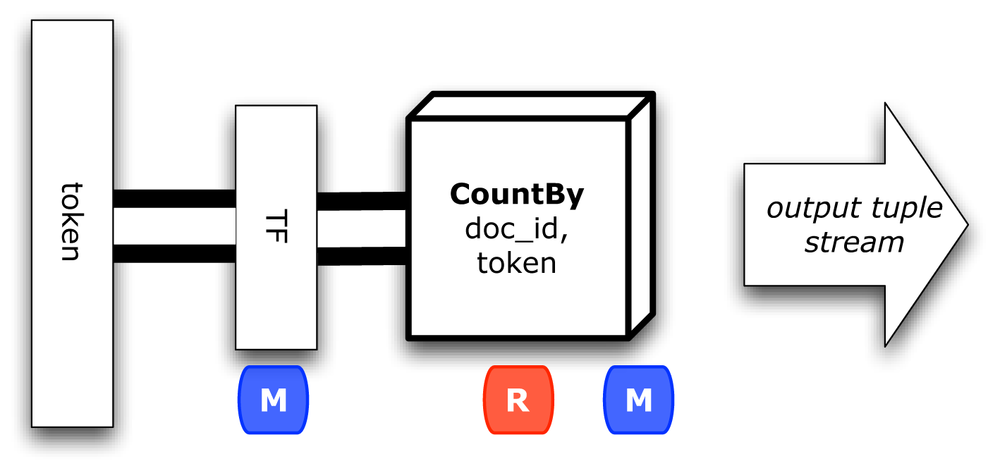
The first branch after tokenPipe calculates term counts, as shown in Figure 3-2.
We’ll call that pipe assembly tfPipe, with a branch name TF:
// one branch of the flow tallies the token counts for term frequency (TF)PipetfPipe=newPipe("TF",tokenPipe);Fieldstf_count=newFields("tf_count");tfPipe=newCountBy(tfPipe,newFields("doc_id","token"),tf_count);Fieldstf_token=newFields("tf_token");tfPipe=newRename(tfPipe,token,tf_token);
This uses a built-in partial aggregate operation called CountBy, which counts duplicates in a tuple stream. Partial aggregates are quite useful for parallelizing algorithms efficiently. Portions of an aggregation—for example, a summation—can be performed in different tasks.
We also rename token to tf_token so that it won’t conflict with other tuple streams in a subsequent join.
At this point, we have the term counts.
The next branch may seem less than intuitive…and it is a bit odd, but efficient.
We need to calculate the total number of documents, in a way that can be consumed later in a join.
So we’ll produce total document count as a field, in each tuple for the RHS of the join.
That keeps our workflow parallel, allowing the calculations to scale out horizontally.
We’ll call that pipe assembly dPipe, with a branch name D, as shown in Figure 3-3.
Alternatively, we could calculate the total number of documents outside of this workflow
and pass it along as a parameter, or use a distributed counter.
Fieldsdoc_id=newFields("doc_id");Fieldstally=newFields("tally");Fieldsrhs_join=newFields("rhs_join");Fieldsn_docs=newFields("n_docs");PipedPipe=newUnique("D",tokenPipe,doc_id);dPipe=newEach(dPipe,newInsert(tally,1),Fields.ALL);dPipe=newEach(dPipe,newInsert(rhs_join,1),Fields.ALL);dPipe=newSumBy(dPipe,rhs_join,tally,n_docs,long.class);
This filters for the unique doc_id values and then uses another built-in partial aggregate operation called
SumBy,
which sums values associated with duplicate keys in a tuple stream.
Great, now we’ve got the document count.
Notice that the results are named rhs_join, preparing for the subsequent join.
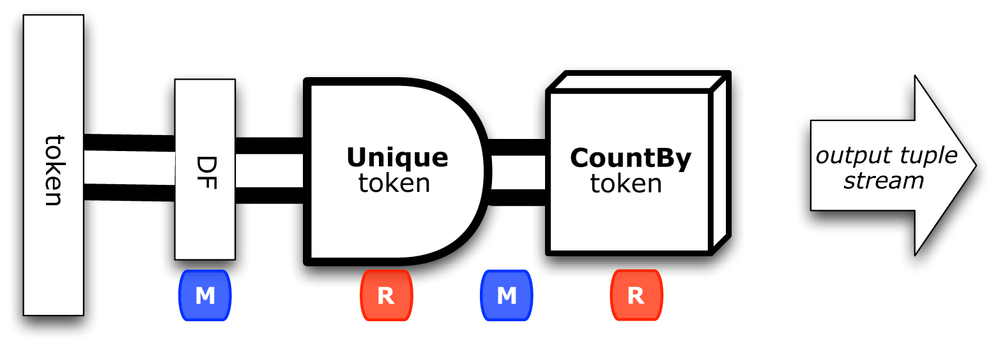
The third branch calculates document frequency for each token.
We’ll call that pipe assembly dfPipe, with a branch name DF, as shown in Figure 3-4:
// one branch tallies the token counts for document frequency (DF)PipedfPipe=newUnique("DF",tokenPipe,Fields.ALL);Fieldsdf_count=newFields("df_count");dfPipe=newCountBy(dfPipe,token,df_count);Fieldsdf_token=newFields("df_token");Fieldslhs_join=newFields("lhs_join");dfPipe=newRename(dfPipe,token,df_token);dfPipe=newEach(dfPipe,newInsert(lhs_join,1),Fields.ALL);
Notice that the results are named lhs_join, again preparing for the subsequent join.
Now we have all the components needed to calculate TF-IDF weights.
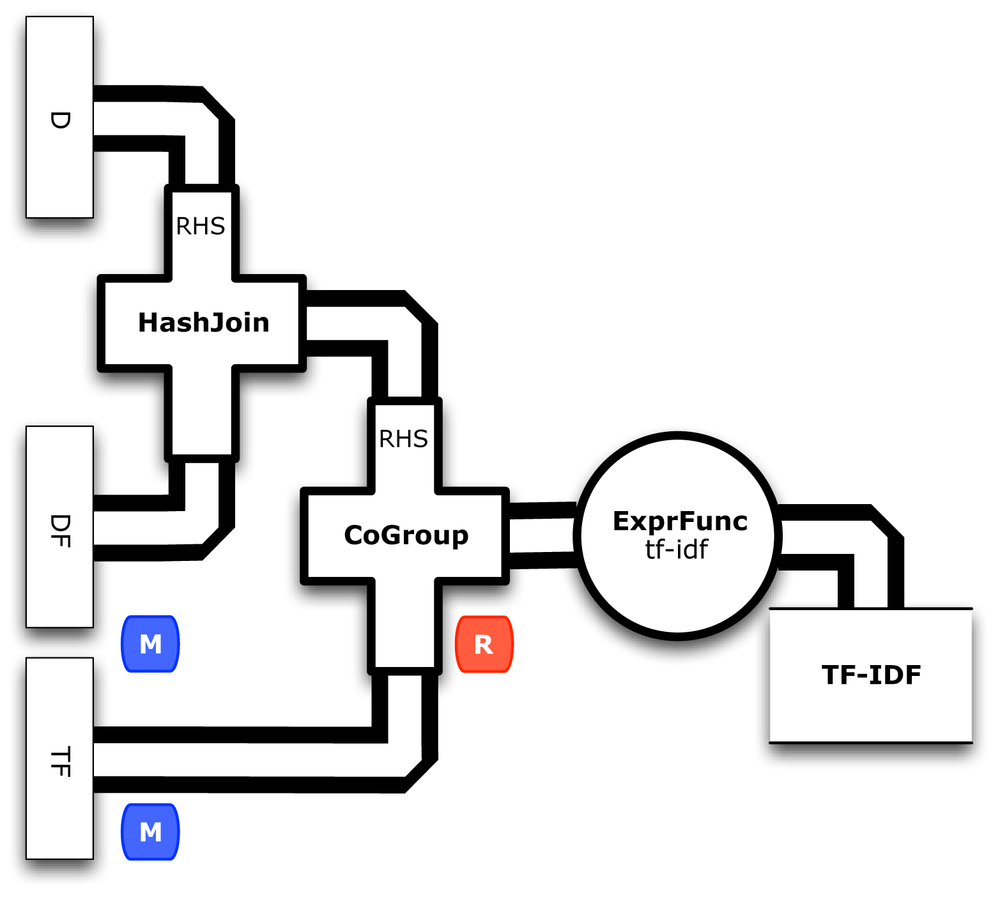
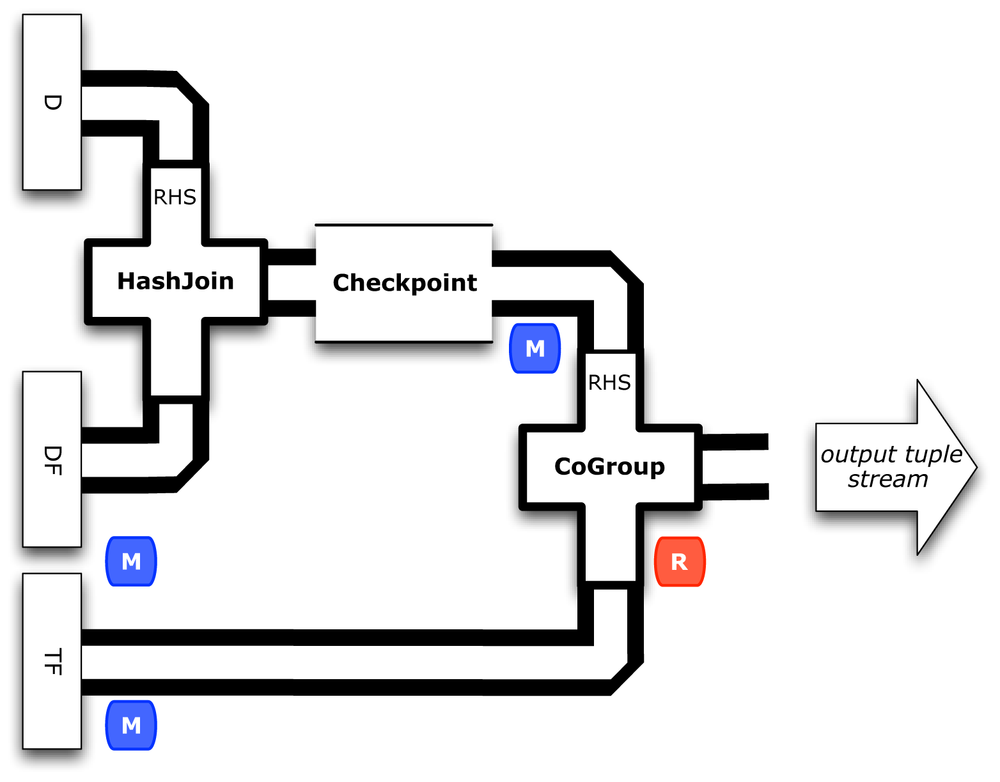
To finish the calculations in parallel, we’ll use two different kinds of joins in Cascading—a HashJoin followed by a CoGroup. Figure 3-5 shows how these joins merge the three branches together:
// join to bring together all the components for calculating TF-IDF// the D side of the join is smaller, so it goes on the RHSPipeidfPipe=newHashJoin(dfPipe,lhs_join,dPipe,rhs_join);// the IDF side of the join is smaller, so it goes on the RHSPipetfidfPipe=newCoGroup(tfPipe,tf_token,idfPipe,df_token);
We used HashJoin previously for a replicated join.
In this case we know that document count will not be a large amount of data, so it works for the RHS.
The other join, CoGroup, handles a more general case where the RHS cannot be kept entirely in memory.
In those cases a threshold can be adjusted for “spill,” where RHS tuples get moved to disk.
Then we calculate TF-IDF weights using an ExpressionFunction in Cascading:
// calculate the TF-IDF weights, per token, per documentFieldstfidf=newFields("tfidf");Stringexpression="(double) tf_count * Math.log( (double) n_docs / ( 1.0 + df_count ) )";ExpressionFunctiontfidfExpression=newExpressionFunction(tfidf,expression,Double.class);FieldstfidfArguments=newFields("tf_count","df_count","n_docs");tfidfPipe=newEach(tfidfPipe,tfidfArguments,tfidfExpression,Fields.ALL);fieldSelector=newFields("tf_token","doc_id","tfidf");tfidfPipe=newRetain(tfidfPipe,fieldSelector);tfidfPipe=newRename(tfidfPipe,tf_token,token);
Now we can get back to the rest of the workflow.
Let’s keep the Word Count metrics, because those become useful when testing.
This branch uses CountBy as well, to optimize better than :
// keep track of the word counts, which are useful for QAPipewcPipe=newPipe("wc",tfPipe);Fieldscount=newFields("count");wcPipe=newSumBy(wcPipe,tf_token,tf_count,count,long.class);wcPipe=newRename(wcPipe,tf_token,token);// additionally, sort by countwcPipe=newGroupBy(wcPipe,count,count);
Last, we’ll add another sink tap to the FlowDef, for the TF-IDF output data:
// connect the taps, pipes, etc., into a flowFlowDefflowDef=FlowDef.flowDef().setName("tfidf").addSource(docPipe,docTap).addSource(stopPipe,stopTap).addTailSink(tfidfPipe,tfidfTap).addTailSink(wcPipe,wcTap);
We’ll also change the name of the resulting Flow, to distinguish this from previous examples:
// write a DOT file and run the flowFlowtfidfFlow=flowConnector.connect(flowDef);tfidfFlow.writeDOT("dot/tfidf.dot");tfidfFlow.complete();
Modify the Main method for these changes.
This code is already in the part5/src/main/java/impatient/ directory, in the Main.java file.
You should be good to go.
For those keeping score, the physical plan in now uses 11 maps and 9 reduces.
That amount jumped by 5x since our previous example.
If you want to read in more detail about the classes in the Cascading API that were used, see the Cascading User Guide and JavaDoc.
To build:
$ gradle clean jarTo run:
$rm -rf output$hadoop jar ./build/libs/impatient.jar data/rain.txt output/wc data/en.stop\output/tfidf
Output text gets stored in the partition file output/tfidf, and you can verify the first 10 lines (including the header) by using the following:
$head output/tfidf/part-00000 doc_id tfidf token doc02 0.9162907318741551 air doc01 0.44628710262841953 area doc03 0.22314355131420976 area doc02 0.22314355131420976 area doc05 0.9162907318741551 australia doc05 0.9162907318741551 broken doc04 0.9162907318741551 california's doc04 0.9162907318741551 cause doc02 0.9162907318741551 cloudcover
A gist on GitHub shows building and running . If your run looks terribly different, something is probably not set up correctly. Ask the developer community for troubleshooting advice.
By the way, did you notice what the TF-IDF weights for the tokens rain and shadow were?
Those represent what these documents all have in common.
How do those compare with weights for the other tokens?
Conversely, consider the weight for australia (high weight) or area (different weights).
TF-IDF calculates a metric for each token, which indicates how “important” that token is to a document within the context of a collection of documents. The metric is calculated based on relative frequencies. On one hand, tokens that appear in most documents tend to have very low TF-IDF weights. On the other hand, tokens that are less common but appear multiple times in a few documents tend to have very high TF-IDF weights.
Note that information retrieval papers use token and term almost interchangeably in some cases.
More advanced text analytics might calculate metrics for phrases, in which case a term becomes a more complex structure.
However, we’re only looking at single words.
Now that we have a more complex workflow for TF-IDF, let’s consider best practices for test-driven development (TDD) at scale. We’ll add unit tests into the build, then show how to leverage TDD features that are unique to Cascading: checkpoints, traps, assertions, etc. Figure 3-6 shows a conceptual diagram for this app.
Generally speaking, TDD starts off with a failing test, and then you code until the test passes. We’ll start with a working app, with tests that pass—followed by discussion of how to use assertions for the test/code cycle.
Starting from the source code directory that you cloned in Git, connect into the part6 subdirectory.
As a first step toward better testing, let’s add a unit test and show how it fits into this example.
We need to add support for testing into our build.
In the Gradle build script build.gradle we need to modify the compile task to include
JUnit and other testing dependencies:
dependencies{compile('cascading:cascading-core:2.1.+'){excludegroup:'log4j'}compile('cascading:cascading-hadoop:2.1.+'){transitive=true}testCompile('cascading:cascading-test:2.1.+')testCompile('org.apache.hadoop:hadoop-test:1.0.+')testCompile('junit:junit:4.8.+')}
Then we’ll add a new test task to the build:
test{include'impatient/**'//makes standard streams (err, out) visible at console when running teststestLogging.showStandardStreams=true//listening to test execution eventsbeforeTest{descriptor->logger.lifecycle("Running test: "+descriptor)}onOutput{descriptor,event->logger.lifecycle("Test: "+descriptor+" produced standard out/err: "+event.message)}}
A little restructuring of the source directories is required—see this GitHub code repo where that is already set up properly.
The custom function ScrubFunction used to scrub tokens in Example 3: Customized Operations had an additional method, to make unit testing simpler.
We add a unit test in a new class called ScrubTest.java, which extends
CascadingTestCase:
publicclassScrubTestextendsCascadingTestCase{@TestpublicvoidtestScrub(){FieldsfieldDeclaration=newFields("doc_id","token");Functionscrub=newScrubFunction(fieldDeclaration);Tuple[]arguments=newTuple[]{newTuple("doc_1","FoO"),newTuple("doc_1"," BAR "),newTuple("doc_1"," ")// will be scrubbed};ArrayList<Tuple>expectResults=newArrayList<Tuple>();expectResults.add(newTuple("doc_1","foo"));expectResults.add(newTuple("doc_1","bar"));TupleListCollectorcollector=invokeFunction(scrub,arguments,Fields.ALL);Iterator<Tuple>it=collector.iterator();ArrayList<Tuple>results=newArrayList<Tuple>();while(it.hasNext())results.add(it.next());assertEquals("Scrubbed result is not expected",expectResults,results);}}
Again, this is a particularly good place for a unit test. Scrubbing tokens is a likely point where edge cases will get encountered at scale. In practice, you’d want to define even more unit tests.
Going back to the Main.java module, let’s see how to handle other kinds of unexpected issues with data at scale. We’ll add both a trap and a checkpoint as taps:
StringtrapPath=args[4];StringcheckPath=args[5];TaptrapTap=newHfs(newTextDelimited(true,"\t"),trapPath);TapcheckTap=newHfs(newTextDelimited(true,"\t"),checkPath);
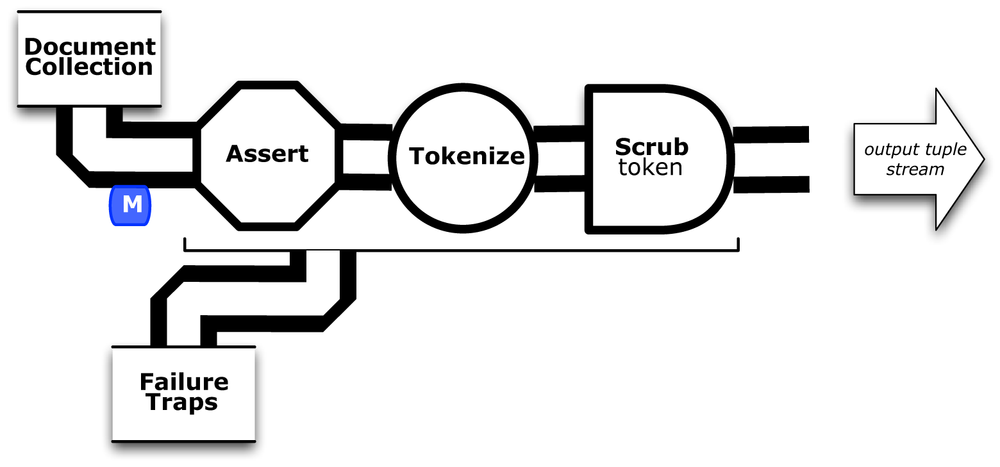
Next we’ll modify the head of the pipe assembly for documents to incorporate a stream assertion, as Figure 3-7 shows. This uses an AssertMatches to define the expected pattern for data in the input tuple stream. There could be quite a large number of documents, so it stands to reason that some data may become corrupted. In our case, another line has been added to the example input data/rain.txt to exercise the assertion and trap.
Notice in Figure 3-7 how the trap will apply to the entire branch that includes the stream assertion. Then we apply AssertionLevel.STRICT to force validation of the data:
// use a stream assertion to validate the input dataPipedocPipe=newPipe("token");AssertMatchesassertMatches=newAssertMatches("doc\\d+\\s.*");docPipe=newEach(docPipe,AssertionLevel.STRICT,assertMatches);
Sometimes, when working with complex workflows, we just need to see what the tuple stream looks like. To show this feature, we’ll insert a Debug operation on the DF branch and use DebugLevel.VERBOSE to trace the tuple values in the flow there:
// example use of a debug, to observe tuple stream; turn off belowdfPipe=newEach(dfPipe,DebugLevel.VERBOSE,newDebug(true));
This prints the tuple values at that point to the log file. Fortunately, it can be disabled with a single line—in practice, you’d probably use a command-line argument to control that.
Next let’s show how to use a Checkpoint that forces the tuple stream to be persisted to HDFS. Figure 3-8 shows this inserted after the join of the DF and D branches.
// create a checkpoint, to observe the intermediate data in DF streamCheckpointidfCheck=newCheckpoint("checkpoint",idfPipe);PipetfidfPipe=newCoGroup(tfPipe,tf_token,idfCheck,df_token);
Checkpoints help especially when there is an expensive unit of work—such as a lengthy calculation. On one hand, if a calculation fits into a single map and several branches consume from it, then a checkpoint avoids having to redo the calculation for each branch. On the other hand, if a Hadoop job step fails, for whatever reason, then the Cascading app can be restarted from the last successful checkpoint.
At this point we have a relatively more complex set of taps to connect in the FlowDef, to include the new output data for test-related features:
// connect the taps, pipes, traps, checkpoints, etc., into a flowFlowDefflowDef=FlowDef.flowDef().setName("tfidf").addSource(docPipe,docTap).addSource(stopPipe,stopTap).addTailSink(tfidfPipe,tfidfTap).addTailSink(wcPipe,wcTap).addTrap(docPipe,trapTap).addCheckpoint(idfCheck,checkTap);
Last, we’ll specify the verbosity level for the debug trace and the strictness level for the stream assertion:
// set to DebugLevel.VERBOSE for trace,// or DebugLevel.NONE in productionflowDef.setDebugLevel(DebugLevel.VERBOSE);// set to AssertionLevel.STRICT for all assertions,// or AssertionLevel.NONE in productionflowDef.setAssertionLevel(AssertionLevel.STRICT);
Modify the Main method for those changes.
This code is already in the part6/src/main/java/impatient/ directory, in the Main.java file.
You should be good to go.
For those keeping score, the physical plan for now uses 12 maps and 9 reduces. In other words, we added one map as the overhead for gaining lots of test features.
To build:
$ gradle clean jarTo run:
$rm -rf output$hadoop jar ./build/libs/impatient.jar data/rain.txt output/wc data/en.stop\output/tfidf output/trap output/check
Remember that data/rain.txt has another row, intended to cause a trap. The output log should include a warning based on the stream assertion, which looks like this:
12/08/06 14:15:07 WARN stream.TrapHandler: exceptiontrapon branch:'token',forfields:[{2}:'doc_id','text']tuple:['zoink','null']cascading.operation.AssertionException: argument tuple:['zoink','null']did not match: doc\d+\s.* at cascading.operation.assertion.BaseAssertion.throwFail(BaseAssertion.java:107)at cascading.operation.assertion.AssertMatches.doAssert(AssertMatches.java:84)
That is expected behavior. We asked Cascading to show warnings when stream assertions failed. The data that caused this warning gets trapped.
Not too far after that point in the log, there should be some other debug output that looks like the following:
12/08/06 14:15:46 INFO hadoop.FlowReducer: sinking to: TempHfs["SequenceFile[ ['df_count', 'df_token', 'lhs_join']]"][DF/93669/]['df_count','df_token','lhs_join']['1','air','1']['3','area','1']['1','australia','1']['1','broken','1']
Plus several more similar lines. That is the result of our debug trace.
Output text gets stored in the partition file output/tfidf as before. We also have the checkpointed data now:
$head output/check/part-00000 df_count df_token lhs_join rhs_join n_docs 1 air 1 1 5 3 area 1 1 5 1 australia 1 1 5 1 broken 1 1 5 1 california's 1 1 5 1 cause 1 1 5 1 cloudcover 1 1 5 1 death 1 1 5 1 deserts 1 1 5
Also notice the data tuple trapped in output/trap:
$ cat output/trap/part-m-00001-00000

zoink null
That tuple does not match the regex doc\\d+\\s.* that was specified by the stream assertion.
Great, we caught it before it blew up something downstream.
A gist on GitHub shows building and running . If your run looks terribly different, something is probably not set up correctly. Ask the developer community for troubleshooting advice.
At first glance, the notion of TDD might seem a bit antithetical in the context of Big Data. After all, TDD is supposed to be about short development cycles, writing automated test cases that are intended to fail, and lots of refactoring. Those descriptions don’t seem to fit with batch jobs that involve terabytes of data run on huge Hadoop clusters for days before they complete.
Stated in a somewhat different way, according to Kent Beck, TDD “encourages simple designs and inspires confidence.”
That statement fits quite well with the philosophy of Cascading.
The Cascading API is intended to provide a pattern language for working with large-scale data—GroupBy, Join, Count, Regex, Filter—so that the need for writing custom functions becomes relatively rare.
That speaks to “encouraging simple designs” directly.
The practice in Cascading of modeling business process and orchestrating Apache Hadoop workflows speaks to “inspiring confidence” in a big way.
So now we’ll let the cat out of the bag for a little secret…working with unstructured data at scale has been shown to be quite valuable by the likes of Google, Amazon, eBay, Facebook, LinkedIn, Twitter, etc. However, most of the “heavy lifting” that we perform in MapReduce workflows is essentially cleaning up data. DJ Patil, formerly Chief Scientist at LinkedIn, explains this point quite eloquently in the mini-book Data Jujitsu:
It’s impossible to overstress this: 80% of the work in any data project is in cleaning the data… Work done up front in getting clean data will be amply repaid over the course of the project.
— DJ Patil Data Jujitsu (2012)
Cleaning up unstructured data allows for subsequent use of sampling techniques, dimensional reduction, and other practices that help alleviate some of the bottlenecks that might otherwise be encountered in Enterprise data workflows. Thinking about this in another way, we have need for API features that demonstrate how “dirty” data has been cleaned up. Cascading provides those features, which turn out to be quite valuable in practice.
Common practices for test-driven development include writing unit tests or mocks. How does one write a quick unit test for a Godzilla-sized data set?
The short answer is: you don’t. However, you can greatly reduce the need for writing unit test coverage by limiting the amount of custom code required. Hopefully we’ve shown that aspect of Cascading by now. Beyond that, you can use sampling techniques to quantify confidence that an app has run correctly. You can also define system tests at scale in relatively simple ways. Furthermore, you can define contingencies for what to do when assumptions fail…as they inevitably do, at scale.
Let’s discuss sampling. Generally speaking, large MapReduce workflows tend to be relatively opaque processes that are difficult to observe. Cascading, however, provides two techniques for observing portions of a workflow. One very simple approach is to insert a Debug into a pipe to see the tuple values passing through a particular part of a workflow. Debug output goes to the log instead of a file, but it can be turned off, e.g., with a command-line option. If the data is large, one can use a Sample filter to sample the tuple values that get written to the log.
Another approach is to use a Checkpoint, which forces intermediate data to be written out to HDFS. This may also become important for performance reasons, i.e., forcing results to disk to avoid recomputing—e.g., when there are multiple uses for the output of a pipe downstream such as with the RHS of a HashJoin. Sampling may be performed either before (with Debug) or after (with Checkpoint) the data gets persisted to HDFS. Checkpoints can also be used to restart partially failed workflows, to recover some costs.
Next, let’s talk about system tests.
Cascading includes support for
stream assertions.
These provide mechanisms for asserting that the values in a tuple stream meet certain criteria—similar to the assert keyword in Java, or an assert not null in a JUnit test.
We can assert patterns strictly as unit tests during development and then run testing against regression data.
For performance reasons, we might use command-line options to turn off assertions in production—or keep them (fail-fast mode) if a use case requires that level of guarantee.
Lastly, what should you do when assumptions fail? One lesson of working with data at scale is that the best assumptions will inevitably fail. Unexpected things happen, and 80% of the work will be cleaning up problems.
Cascading defines failure traps, which capture data that would otherwise cause an operation to fail, e.g., by throwing an exception. For example, perhaps 99% of the cases in your log files can be rolled up into a set of standard reports…but 1% requires manual review. Great, process the 99% that work and shunt the 1% failure cases into a special file marked “For manual review.” That can be turned into a report for the customer support department. Keep in mind, however, that traps are intended for handling exceptional cases. If you know in advance how to categorize good versus bad data, then a best practice is to use a filter instead of a trap.
