8 Creating Evaluations and Reports
If your daily work frequently requires you to create reports and lists, you can print, send, and use these lists for the decision-making process via the SAP reporting options.
Besides the tools contained in SAP ERP, there are further powerful tools (e.g., within SAP NetWeaver) that aren’t discussed in this book. This chapter is limited to the information system in SAP ERP.
In this chapter, you’ll learn the following:
- How to call standard reports in the SAP system
- How to use the SAP List Viewer for presentation
- How to export reports to Microsoft Excel
- How to use variants
- How to access further reporting tools provided in SAP ERP
8.1 Using Standard Reports in the SAP System
Reporting and analysis play a central role in the success of a business. The wealth of information stored in the SAP system can be evaluated and presented in reports (e.g., in lists) for analysis.
The different areas and departments of your business have diverse information requirements. In the HR area, the employees and managers require personal data that ranges from simple lists of employees to more complex reports. In logistics, reports can involve stock lists or lists of orders from a specific time period. In accounting, you can display all items of a debtor (customer), the costs and revenues of a specific area, and much more.
Part III of this book provides a selection of the most important reports in the Purchasing, Sales and Distribution (SD), Human Resources (HR), SAP ERP Financials (FI), and Controlling (CO) components.
SAP List Viewer (ALV)
The SAP system provides various options to display queried data. One of the most important display tools is the SAP List Viewer (ALV). ALV stands for ABAP List Viewer, which is the name of the tool in older releases. Different list operations such as search, filter, and sort are available within the ALV. With the ALV grid control, SAP gives you a standardized tool for displaying lists in the system. Grid control lets you define which information is displayed in the list and choose the criteria used to filter it.
Let's use an example to illustrate how to call standard reports. You must determine in the SAP system which sales were generated by a specific sales organization (in this example, 1000) within a specific time period (three months). Follow these steps:
-
Open the Logistics • Logistics Controlling • Logistics Information System • Standard Analyses • Sales and Distribution • MCTA – Customer path in the SAP Easy Access menu (Figure 8.1). Alternatively, start Transaction MCTA by entering the transaction code in the command field.
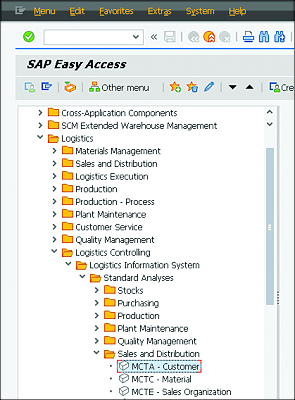
Figure 8.1 SAP Easy Access Menu
-
In the initial screen of the customer analysis, enter the sales organization in the corresponding field for which you want to create the evaluation. Enter “1000” in this example. Limit the period to analyze to four years (01.2012 to 01.2016) using the fields, Month and To (Figure 8.2). To run the evaluation, click the Next
 button or press (F8).
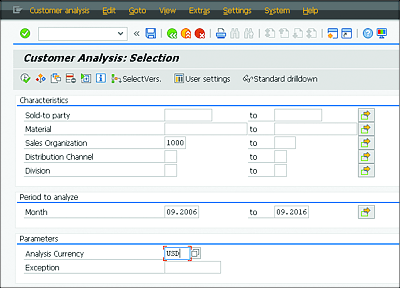
Figure 8.2 Month and To Fields
-
After the selection is executed, the basic list is displayed (Figure 8.3). You can now modify the report using the buttons that are detailed in the upcoming Table 8.1.
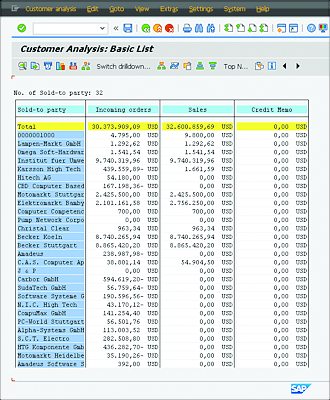
Figure 8.3 Customer Analysis: Basic List
You’ve now successfully created a sales report. The list, which was output in ALV format, offers various navigation options. The ALV grid control has a special toolbar for this that offers the important buttons shown in Table 8.1.
| Button | Name | Key Combination | Explanation |
|---|---|---|---|
|
|
First Page | (Ctrl)+(Pageì) | Navigates to the beginning of the list |
|
|
Previous Page | (Pageì) | Navigates to the previous page in the list |
|
|
Next Page | (Pageë) | Navigates to the next page in the list |
|
|
Last Page | (Ctrl)+(Pageë) | Navigates to the end of the list |
|
|
Select (Details) | (F2) | Shows detailed information on the selection |
|
|
Save in PC File | (Shift)+(F8) | Exports the list to a PC file |
|
|
Send | (Ctrl)+(F1) | Sends a link of this list to another user |
|
|
Graphic | (F5) | Creates a graphic |
|
|
Sort in Ascending Order | (Ctrl)+(F5) | Sorts a selected column by contents in ascending order |
|
|
Sort in Descending Order | (Shift)+(F4) | Sorts a selected column by contents in descending order |
|
|
Other Info Structure | (Ctrl)+(F4) | Changes the list structure |
|
|
Change Drilldown | (F7) | Changes the first column |
|
|
Analysis Currency | (Ctrl)+(F7) | Changes the currency to the selected currency |
|
|
Drilldown by | (F8) | Provides further drilldown of a selected criterion |
|
|
Top • Values | (Shift)+(F6) | Shows the highest values of a selected column |
Table 8.1 Buttons in the ALV Grid Control
The next section describes how to find the report that meets your evaluation purposes best.