18.5 Profitability Analysis
One of the key reasons to implement CO is to understand profitability. Here, the focus is on with which product or customer the highest profit is made. Profitability Analysis (CO-PA) answers this question.
CO-PA is used, for example, for variable costing (contribution margin accounting) or absorption costing in combination with specific criteria such as customer, product, or region. Businesses incur costs for wages, salaries, energy, materials, and so on. Selling the manufactured goods leads to revenues. At its simplest, the difference between revenues and costs is the profit. The contribution margin is the difference between the earned revenues and the variable costs, and thus refers to the amount that is available to cover fixed costs. In full absorption costing, in turn, all costs are allocated to cost objects. That is the business perspective.
In addition, it can be important to know the difference between costs and revenue per product, customer, market segment, and so on. To determine this, you have to integrate data from other SAP components. Because these data are mainly related to sales, the central information is provided by SD. In the Customizing of CO-PA, you define which information from SD you want to copy as a characteristic to CO-PA (e.g., division, article, customer, or material group) and which numeric values you want to transfer from SD to CO-PA (e.g., sales quantity or gross revenue).
Characteristics and Value Fields
The data structure in CO-PA consists of characteristics and value fields that let you structure, select, and sort your data. You can copy the characteristics from SD or directly from the article or customer master. For example:
- Division (SD)
- Product (SD sales order)
- Customer (SD sales order)
- Material group (article master)
Alternatively, you can derive your characteristics from an existing characteristic. For example, you can derive the continent from the country of the customer and thus sort your evaluations by country and continent.
Value fields represent values or quantities, for example:
- Sales quantity (SD sales order)
- Gross revenue (SD conditions)
The advantage of the data structure in CO-PA is its flexibility. Because there is no defined structure, you can develop the structure according to your specific requirements. You decide whether you want to have the bill-to party or ship-to party as a characteristic in addition to the customer, or whether you need discounts from the SD conditions in addition to the level of detail already being transferred from CO-PC to cover the product costs. Figure 18.10 shows an example of profitability analysis.
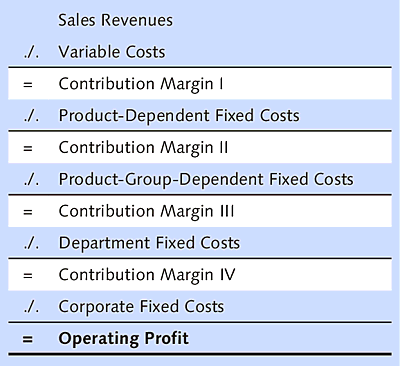
Figure 18.10 Example of Profitability Analysis
The operating profit for a product is calculated using the sales revenue minus all variable and fixed costs. The individual contribution margins are calculated as subtotals. To give you an overview of how you can call your CO-PA data, the following example displays a profitability report for the individual divisions. Follow these steps:
- Call Transaction KE30 via the command field, or navigate via the SAP Easy Access menu path: Accounting • Controlling • Profitability Analysis • Information System • Execute Report.
- If the system prompts you to, set the Operating concern (in this example, “IDEA”) before the system takes you to the initial screen (Figure 18.11).
-
Press (Enter) or click the Next
 button..
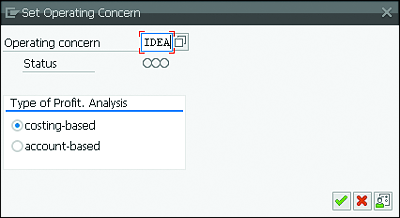
Figure 18.11 Setting the Operating Concern
-
In the next screen, you have to select the profitability report (in this example, IDES-010) that you want to view (Figure 18.12). Select the report, and press (Enter).
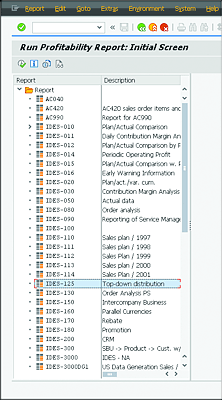
Figure 18.12 Selecting the Report
- In the Report selections area, make the following specifications: Period from “001.2002”, Period to “012.2002”, and Version “100” (Figure 18.13). The version is used to differentiate the various costing variants for one material.
- Under Output Type, you can select the graphical report output (not displayed here).
-
Click the Execute
 button, or press (F8).
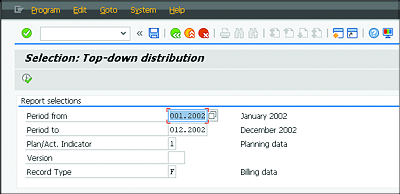
Figure 18.13 Selection for the Profitability Report
The next screen displays the profitability report for the individual divisions (Figure 18.14).
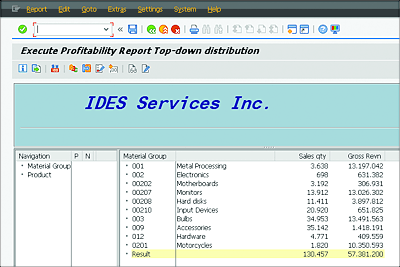
Figure 18.14 Profitability Report
In the lower part of the screen, you can now see your sales quantity and gross revenues (value fields) as planned and actual data, absolute variances, and variances in percentages as the total. By double-clicking this navigation area, you get detailed information about division, article, customer, or material group characteristics.